#jChaart - Introduction
A Javascript-only, web based Dashboard library, that you can use to make eye-catchy Charts showing Transactions stats for your application, Server CPU, Memory, IO graphs etc. It offers libraries to convert different types of delimited text files into Charts. Those delimited files are generated from various sources, eg running SQL queries against a Database, or running shell scripts to collect system stats, or Powershell scripts to process IIS logs. End result is a nice-looking Twitter Bootstrap powered, responsive Web Dashboard, that you can get up and running in no time, on any platform. Since it is HTML and Javascript, you can customize it to show exactly what you want, how you want. Quite handy for earning brownie points and wooing your customers.
MIT License http://opensource.org/licenses/MIT
Copyright (c) 2015 Omar AL Zabir
First you define the html for the Chart Container, using Twitter Bootstrap template. For ex, here's the first two Chart HTML snippet:
<div class="container">
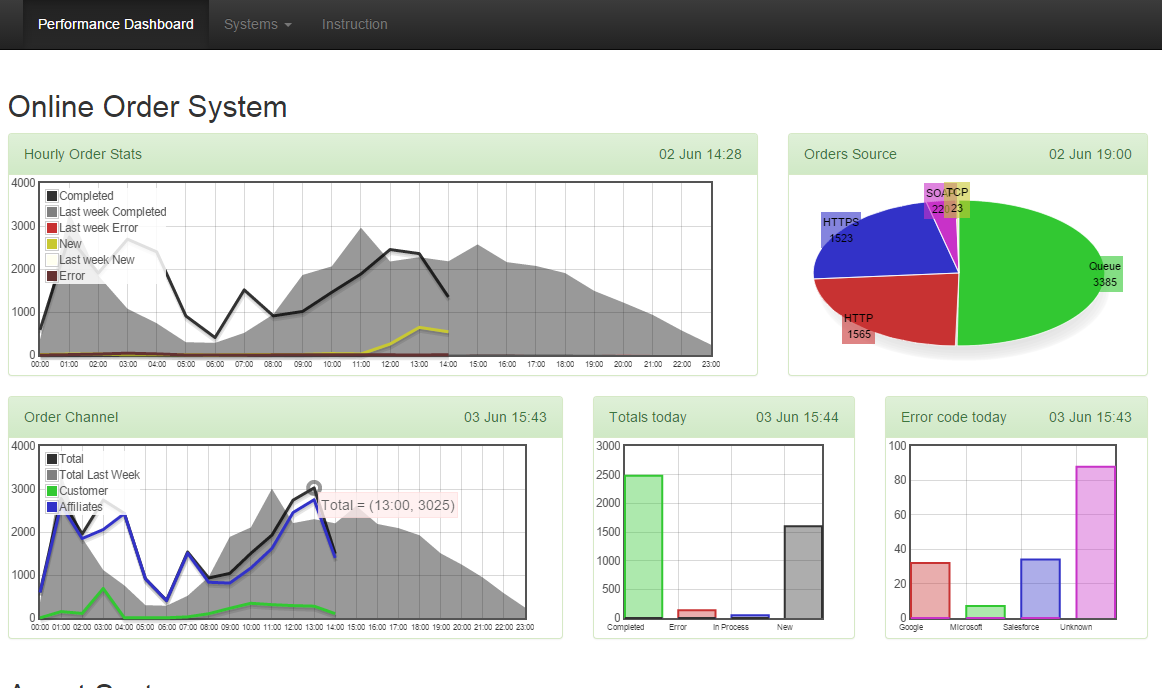
<h2>Online Order System</h2>
<div class="row">
<div class="col-md-8">
<div class="panel panel-success">
<div class="panel-heading">Hourly Order Stats</div>
<div class="panel-body panel-body-height">
<div class="chart-container">
<div id="OnlineOrderWeekComparison" class="chart-placeholder"></div>
</div>
</div>
</div>
</div>
<div class="col-md-4">
<div class="panel panel-success">
<div class="panel-heading">Orders Source</div>
<div class="panel-body panel-body-height">
<div class="chart-container">
<div id="OnlineOrderSourceCount" class="chart-placeholder"></div>
</div>
</div>
</div>
</div>
</div>
Then the following Javascript takes care of rendering the graphs by reading data files:
jChaart.build({ id: '#OnlineOrderWeekComparison', urls: "data/transactions/Online_week_comparison.txt" });
jChaart.build({ id: '#OnlineOrderSourceCount', urls: "data/transactions/OnlineOrders.txt", style: jChaart.GraphStyles.pieChart });
That's it! Twitter bootstrap takes care of all the responsiveness stuff. FlotChart does the cross-browser Chart rendering. jChaart offers the library to make these two work together, parse delimited text files, and present the Charts with a nice look and feel.
The data files are in this format:
01:00|Inflight|55|blue
01:00|Success|34|green
01:00|Failure|2|red
02:00|Inflight|60|blue
02:00|Success|20|green
02:00|Failure|20|red
It is a pipe delimited file. First one is the xaxis name. Second, the label of the line/bar/pie on the graph. Third, the value for the yaxis, and fourth, the color name for the line/bar/pie.
At midnight you start a new file, keep appending data to it every hour or minute. Once the file is updated, transfer the file in a location where the javascript library can load it using AJAX.
You can also aggregate data into a daily summary kind of Chart using the aggregate function:
jChaart.aggregate({ id: '#Chart2', urls: "data/transactions/OnlineHourlyOrderCount.txt", style: jChaart.GraphStyles.barChart });
It will generate a bar chart by summing up all Failure, Inflight, Success in the entire file.
jChaart offers many ways to customize the way you want to parse the data files. You can define custom functions to resolve x-axis, y-axis, color etc. You can dynamically calculate color based on data on the file. You can impose maximum numbers of x-axis values, maximum lines to process from the file, override the pre-defined styles and so on.
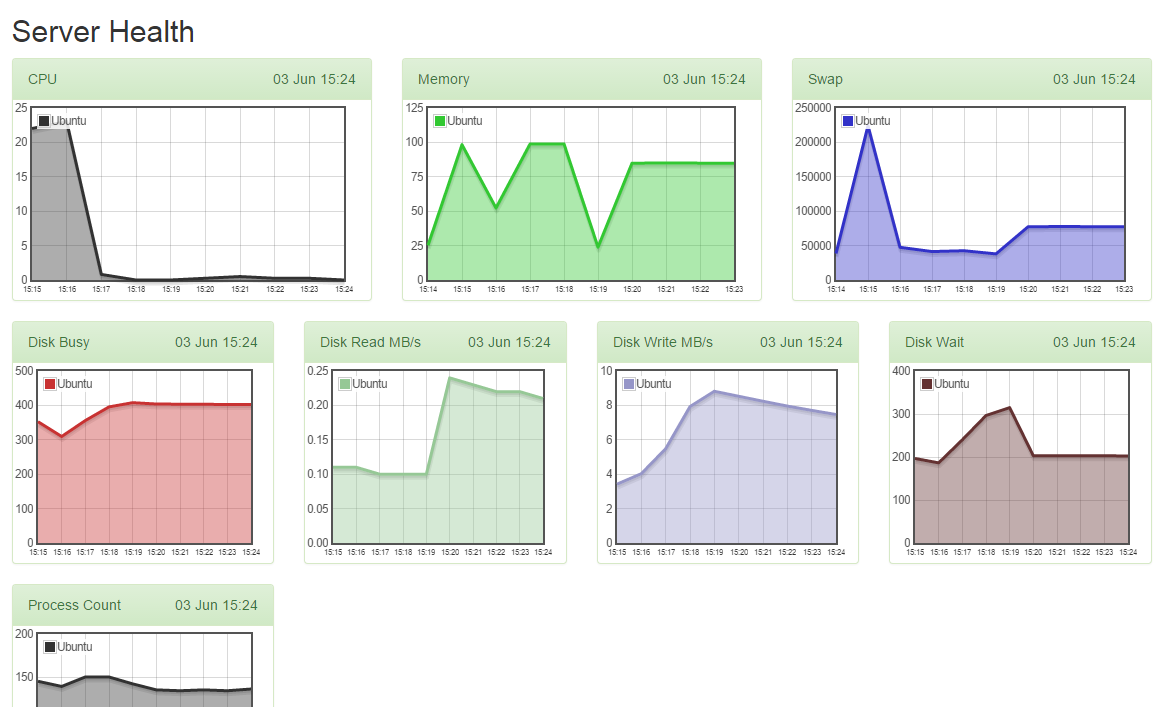
For example, say you want to produce a CPU, IO, Disk statistics. You can use the popular Unix sar command to produce the system stats. It will produce data in this format:
15:15|22.02|75.73|0.90
15:16|23.04|75.62|0.22
15:17|0.81|5.15|62.87
15:18|0.00|4.71|60.99
15:19|0.00|0.75|0.00
15:20|0.25|1.00|0.00
15:21|0.50|1.00|0.00
15:22|0.25|0.50|0.00
15:23|0.25|0.75|0.00
15:24|0.00|1.27|0.00
This is a completely different format. Yet you can easily parse this file and produce chart with this script:
jChaart.build({ id:'#CPUGraph', urls:["data/server/omar-ubuntu_cpu.txt"], seriesNames: ['Ubuntu'], valueIndex:1, color: 'black', style:jChaart.GraphStyles.lineChart_filled });
Here you are saying that the y-axis value is the 2nd item on each line, and color of line will be black. Also the series name is 'Ubuntu' for the first file. Yes, you can specify multiple files as well to be overlayed on a single Chart!
With the help of sar and iostat, you can build a pretty awesome Server monitor dashboard in no time:
The Web Dashboard is hosted in a web server, on any platform - Linux or Windows. You just need to expose the "data" folder somehow to your other servers, which will be pushing text files to it. The Javascript uses AJAX to load the text files and then produces an object model and uses FlotChart to produce the Charts.
jChaart can parse delimited text files and render Charts. In order to produce the files, you need to setup some scheduled tasks or crons on your application or database server. Here are some ideas how you can do that:
Here's a boilerplate shell script that you can use to generate the text files. You can setup a cron to run this say every 10 mins or every hour.
# This is the file that you will upload
filename=filefordashboard.txt
# If file exists and we are on a new day, create new file
if [ -f $filename ]; then
    day=`date +%d -r $filename`
    today=`date +%d`
    if (($day == $today))
    then
        # same day, just append data
        echo "Same day just add more data" > /dev/null
    else
        # new day, new beginning
        echo "Create new file" > /dev/null
        cp $filename $filename.$day
        cp /dev/null $filename
    fi;
fi;
# Do your thing and append data to the file
echo "Appending data" >> $filename
# upload the file to the dashboard
cp $filename /var/www/dashboard/data/
After generating the file, you need to transfer the file to the "data" folder on the Web Dashboard. You can use FTP, SFTP, network share copy anything you like.
Here's an example SQL Query that you can run via SQLPlus to get data from oracle in the above suitable format. Let's assume there's a table called Orders, which has a created column to hold the order creation date. Status column holds the status of the orders. Now, we want to get the Success and Failure of today vs last week's same day. Here's an example of Oracle script:
-- These options are necessary to correctly format the output
set colsep |
set pagesize 0
set trimspool on
set headsep off
set linesize 80
set numw 20
set echo off
set feedback off
set sqlprompt ''

-- This is the output file, which needs to be FTP'd
spool xxx_order_stats.txt

select
    Axis,
    Label,
    NVL(SUM(Value),0) as Value,
    case Label
        when 'Success' then 'green'
        when 'Failed' then 'brown'
        when 'Last week Success' then 'lightgreen'
        when 'Last week Failed' then 'red'
    end as Color
    FROM
(
select
    -- First column is the hour of the day, eg 08:00
    -- 'created' is the date column
    TO_CHAR(created, 'HH24') || ':00' as Axis,

    -- Second column is the label, like Success, Failed
    -- 'status' is the order status column
    case status
        when 'failed' then 'Failed'
        when 'succeeded' then 'Success'
    end as Label,

    -- Third colum is the value for success
    nvl(count(*),0) as value

    -- This is where you add your application specific conditions to
    -- select rows from today midnight.
    -- 'orders' is the table which holds orders
    from orders
    where
        -- Condition to select rows since today midnight
        created >= trunc(sysdate) and created < trunc(sysdate+1)
    group by
        -- This one groups by the hour of the day and order status
        TO_CHAR(created, 'HH24'), Status

UNION

    -- The above query is copied and pasted to get last week same day's status

select
    -- First axis is hour of the day, eg 08:00
    TO_CHAR(created, 'HH24') || ':00' as Axis,
    -- Second is 'Last Week Success', 'Last Week failure'
    'Last week ' || case status
        when 'failed' then 'Failed'
        when 'succeeded' then 'Success'
    end as Label,
    nvl(count(*),0) as value

    -- Application specific condition to get orders from last week
    from orders
    where
        -- Get rows from last week same day, between sysdate-7 and sysdate-6
        created >= trunc(sysdate-7) and created < trunc(sysdate-6)
    group by
        TO_CHAR(created, 'HH24'), status
)
GROUP BY Axis, Label
order by 1,2
/
spool off
quit
SET NOCOUNT ON
;WITH Status_CTE (Axis, Label, Value, Color)
AS
(
SELECT
    -- This gives the hour of the day, eg 08:00
    convert(nvarchar,DATEPART(hour,GetDate()),2)+':'+
    Right('00' + convert(nvarchar,DATEPART(minute,GetDate()),2), 2)
AS Axis,
CASE Status
    when 4 then 'Completed'
    when 5 then 'Failed'
END as Label,
count(*) as Value,
CASE Status
    when 4 then 'green'
    when 5 then 'yellow'
END as Color
FROM Orders WITH (NOLOCK)
WHERE Created BETWEEN dateadd(DAY,0, datediff(day,0, GETDATE())) AND dateadd(DAY,1, datediff(day,0, GETDATE()))
GROUP BY Status
)
SELECT
    Axis,
    Label,
    SUM(Value) as Value,
    Color
FROM Status_CTE
GROUP BY Axis, Label, Color;
For Unix, you can use the following command line to run queries against your database and generate the output in a text file.
sqlplus -L -S user/pass@(description=(address_list=(address=(protocol=TCP)(host=hostname.bt.com)(port=63447)))(connect_data=(service_name=service))) @xxxx_stats.sql
Similarly, for SQL server, you can run it using these parameters to produce the data file in suitable format:
sqlcmd -S hostname.bt.com -U user -P pass -d dbname -i .\xxxx_stats.sql -h-1 -s"|" -w 700 -W -o xxxx_stats.txt
If you are running the command from Powershell, you need to use this format:
cmd /c "sqlcmd -S hostname.bt.com -U user -P pass -d dbname -i .\xxxx_stats.sql -h-1 -s""|"" -w 700 -W -o xxxx_stats.txt"
There's some trick with setting up ORACLE_HOME, PATH and running the script from the folder where the .sql file is.
today=`date +%d-%m-%y`
ORACLE_HOME= ORACLE_HOME=/home/export/oracle/product/11.1.0
export ORACLE_HOME
PATH=$PATH:/usr/sbin:/usr/local/bin:$ORACLE_HOME/bin;export PATH
# This is important, go to the folder where the script file is
cd /home/myuser
sqlplus -s username/password@service_name @xxxx_stats_query.sql
# The output is spooled to the file specified inside the script
cp xxxx_order_stats.txt /var/www/dashboard/data/
First create a batch file with all the command and run the batch file manually to make sure it works. Then create a Task in Task Scheduler, use the SYSTEM user to avoid permission issues. While setting up the Trigger, you must put the "Startup Directory" as the folder where the batch file, sql file and text file is going to be. Also make sure the first line in the batch file has the full Path setup:
set Path=C:\Program Files\Microsoft SQL Server\100\Tools\Binn;C:\oracle\instantclient_12_1
sqlcmd -S hostname -U user -P pass -d database -i .\xxxx_orders.sql -h-1 -s""|"" -w 700 -W -o .\xxx_orders.txt


