GithubHelp home page GithubHelp logo

simonw / datasette-cluster-map Goto Github PK

View Code? Open in Web Editor NEW
83.0 5.0 14.0 122 KB

Datasette plugin that shows a map for any data with latitude/longitude columns

License: Apache License 2.0

Python 16.86% JavaScript 80.78% CSS 2.36%
datasette datasette-plugin leafletjs datasette-io

datasette-cluster-map's Introduction

datasette-cluster-map

PyPI Changelog License

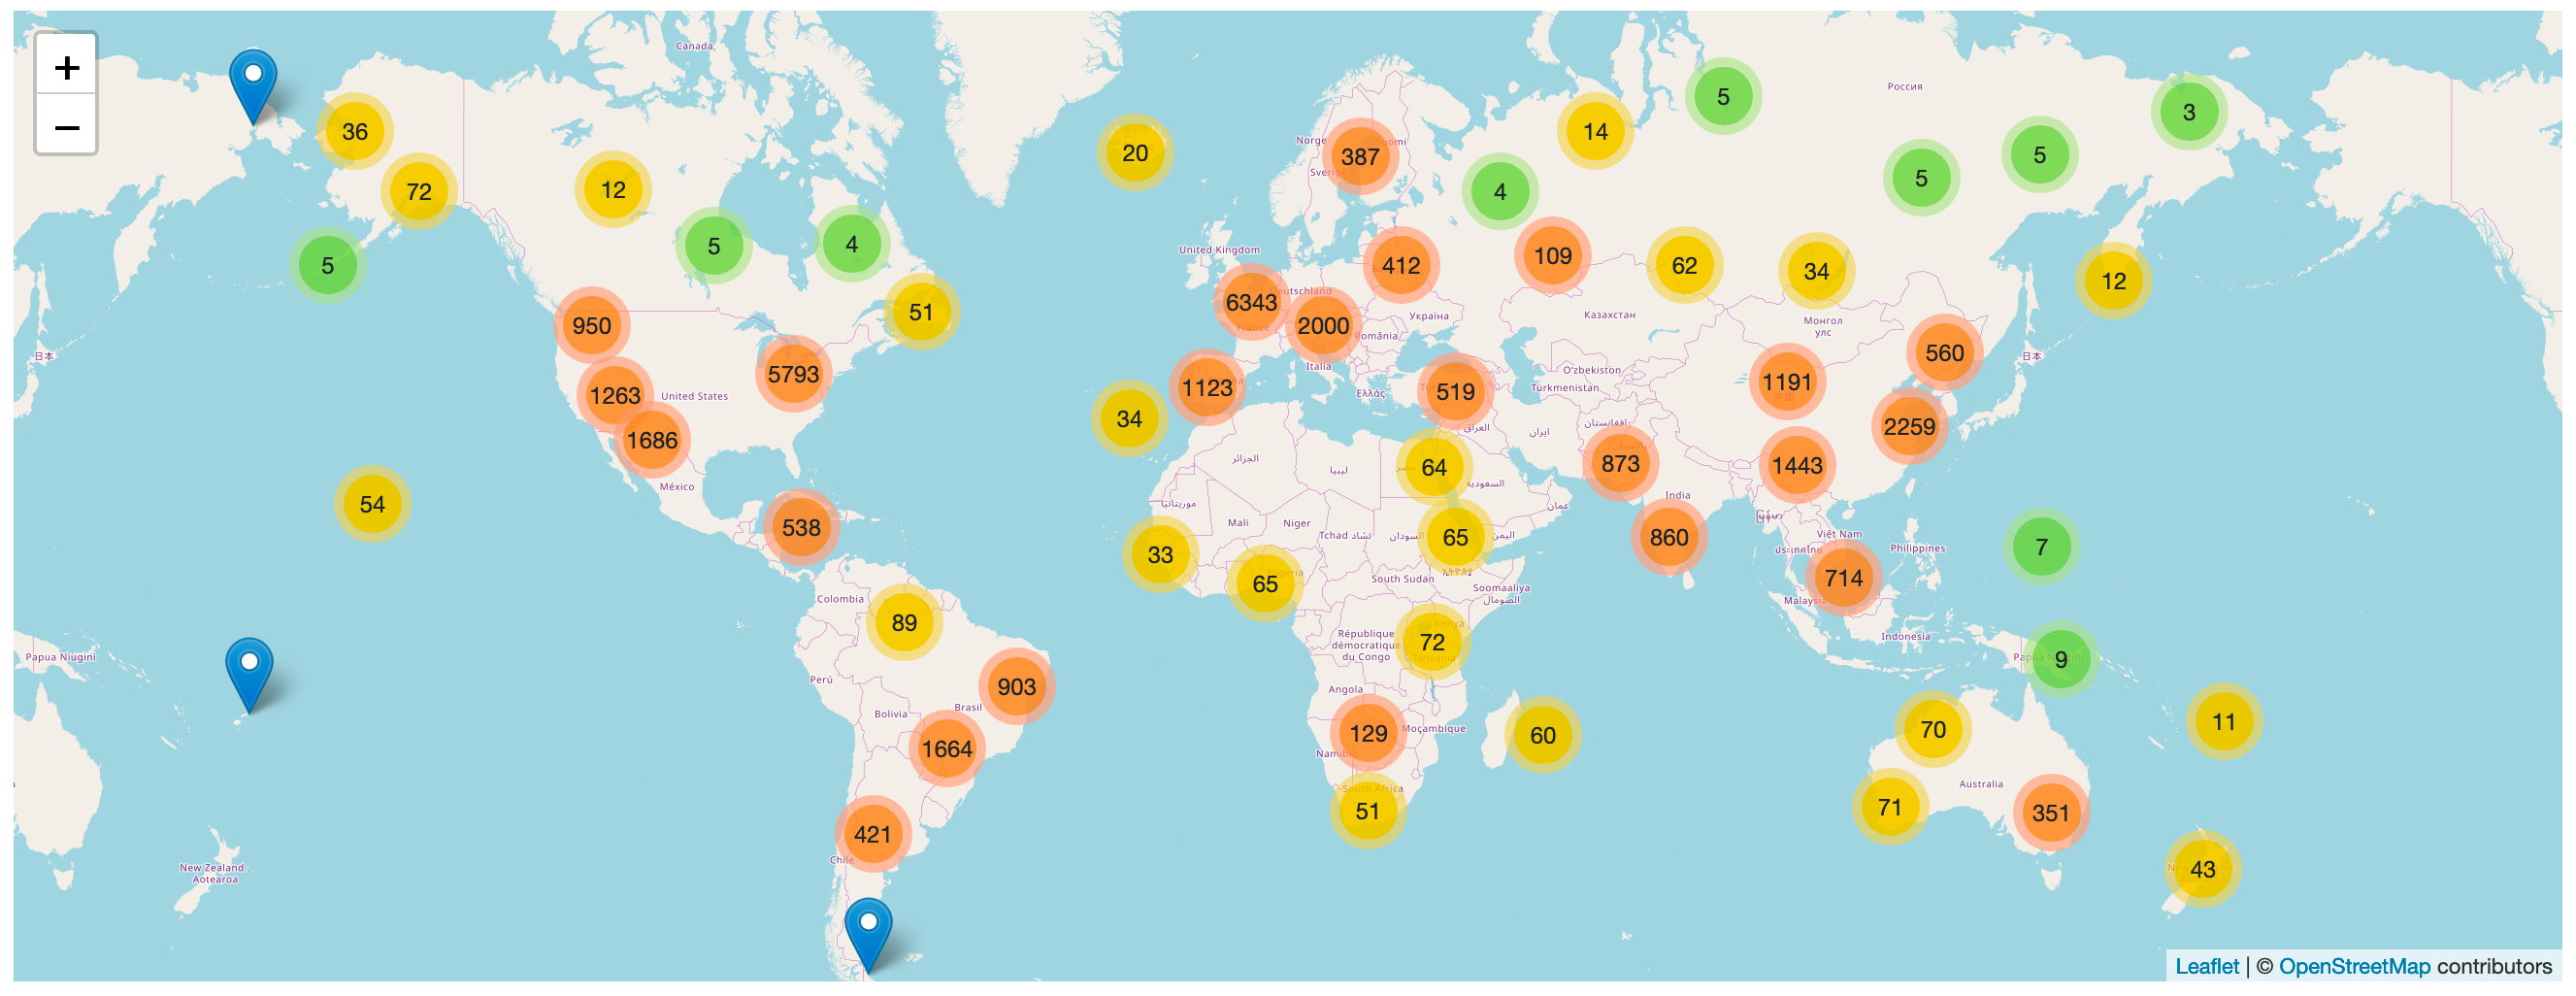
A Datasette plugin that detects tables with latitude and longitude columns and then plots them on a map using Leaflet.markercluster.

More about this project: Datasette plugins, and building a clustered map visualization.

Demo

global-power-plants.datasettes.com hosts a demo of this plugin running against a database of 33,000 power plants around the world.

Cluster map demo

Installation

Run datasette install datasette-cluster-map to add this plugin to your Datasette virtual environment. Datasette will automatically load the plugin if it is installed in this way.

If you are deploying using the datasette publish command you can use the --install option:

datasette publish cloudrun mydb.db --install=datasette-cluster-map

If any of your tables have one of the following pairs of columns a map will be automatically displayed:

  • latitude and longitude
  • lat and lng
  • lat and lon
  • lat and long
  • *_latitude and *_longitude
  • *_lat and *_lng for any of the three variants of lng

Configuration

If your columns are called something else you can configure the column names using plugin configuration in a metadata.json file. For example, if all of your columns are called xlat and xlng you can create a metadata.json file like this:

{
    "title": "Regular metadata keys can go here too",
    "plugins": {
        "datasette-cluster-map": {
            "latitude_column": "xlat",
            "longitude_column": "xlng"
        }
    }
}

Then run Datasette like this:

datasette mydata.db -m metadata.json

This will configure the required column names for every database loaded by that Datasette instance.

If you want to customize the column names for just one table in one database, you can do something like this:

{
    "databases": {
        "polar-bears": {
            "tables": {
                "USGS_WC_eartag_deployments_2009-2011": {
                    "plugins": {
                        "datasette-cluster-map": {
                            "latitude_column": "Capture Latitude",
                            "longitude_column": "Capture Longitude"
                        }
                    }
                }
            }
        }
    }
}

You can also use a custom SQL query to rename those columns to latitude and longitude, for example:

select *,
    "Capture Latitude" as latitude,
    "Capture Longitude" as longitude
from [USGS_WC_eartag_deployments_2009-2011]

The map defaults to being displayed above the main results table on the page. You can use the "container" plugin setting to provide a CSS selector indicating an element that the map should be appended to instead.

Custom tile layers

You can customize the tile layer used by the maps using the tile_layer and tile_layer_options configuration settings. For example, to use the OpenTopoMap you can use these settings:

{
    "plugins": {
        "datasette-cluster-map": {
            "tile_layer": "https://{s}.tile.opentopomap.org/{z}/{x}/{y}.png",
            "tile_layer_options": {
                "attribution": "Map data: &copy; <a href='https://www.openstreetmap.org/copyright'>OpenStreetMap</a> contributors, <a href='http://viewfinderpanoramas.org'>SRTM</a> | Map style: &copy; <a href='https://opentopomap.org'>OpenTopoMap</a> (<a href='https://creativecommons.org/licenses/by-sa/3.0/'>CC-BY-SA</a>)",
                "maxZoom": 17
            }
        }
    }
}

The Leaflet Providers preview list has details of many other tile layers you can use.

Custom marker popups

The marker popup defaults to displaying the data for the underlying database row.

You can customize this by including a popup column in your results containing JSON that defines a more useful popup.

The JSON in the popup column should look something like this:

{
    "image": "https://niche-museums.imgix.net/dodgems.heic?w=800&h=400&fit=crop",
    "alt": "Dingles Fairground Heritage Centre",
    "title": "Dingles Fairground Heritage Centre",
    "description": "Home of the National Fairground Collection, Dingles has over 45,000 indoor square feet of vintage fairground rides... and you can go on them! Highlights include the last complete surviving and opera",
    "link": "/browse/museums/26"
}

Each of these columns is optional.

  • title is the title to show at the top of the popup
  • image is the URL to an image to display in the popup
  • alt is the alt attribute to use for that image
  • description is a longer string of text to use as a description
  • link is a URL that the marker content should link to

You can use the SQLite json_object() function to construct this data dynamically as part of your SQL query. Here's an example:

select json_object(
  'image', photo_url || '?w=800&h=400&fit=crop',
  'title', name,
  'description', substr(description, 0, 200),
  'link', '/browse/museums/' || id
  ) as popup,
  latitude, longitude from museums
where id in (26, 27) order by id

Try that example here or take a look at this demo built using a SQL view.

How I deployed the demo

datasette publish cloudrun global-power-plants.db \
    --service global-power-plants \
    --metadata metadata.json \
    --install=datasette-cluster-map \
    --extra-options="--config facet_time_limit_ms:1000"

Development

To set up this plugin locally, first checkout the code. Then create a new virtual environment:

cd datasette-cluster-map
python3 -mvenv venv
source venv/bin/activate

Or if you are using pipenv:

pipenv shell

Now install the dependencies and tests:

pip install -e '.[test]'

To run the tests:

pytest

datasette-cluster-map's People

Contributors

alberto-salinas avatar lbhelewis avatar simonw avatar

Stargazers

 avatar  avatar  avatar  avatar  avatar  avatar  avatar  avatar  avatar  avatar  avatar  avatar  avatar  avatar  avatar  avatar  avatar  avatar  avatar  avatar  avatar  avatar  avatar  avatar  avatar  avatar  avatar  avatar  avatar  avatar  avatar  avatar  avatar  avatar  avatar  avatar  avatar  avatar  avatar  avatar  avatar  avatar  avatar  avatar  avatar  avatar  avatar  avatar  avatar  avatar  avatar  avatar  avatar  avatar  avatar  avatar  avatar  avatar  avatar  avatar  avatar  avatar  avatar  avatar  avatar  avatar  avatar  avatar  avatar  avatar  avatar  avatar  avatar  avatar  avatar  avatar  avatar  avatar  avatar  avatar  avatar

Watchers

 avatar  avatar  avatar  avatar  avatar

datasette-cluster-map's Issues

Kepler.gl - any chance we can revise to use this as a backend

Thanks @simonw for a great tool. I've played with this (maybe not as the tool intended) as a tool to aggregate all my "life data" into one db. I use cluster map as a great display tool, and I attempted to create a Kepler.gl plugin - but I'm not a programmer by trade. If I get anywhere I will post up.

Would be a great plugin - given the variety of maps that Kepler gl is able to produce and the performance.

I have over 3 million gps points that I have plotted on some charts (Kepler.gl is able to handle them well). Would be great to integrate them into datasette as well.

If someone with more of a clue has the time and inclination, its got a well documented plugin structure here: https://docs.kepler.gl/docs/api-reference

Update Stamen example in README

They changed their tile URLs: https://maps.stamen.com/stadia-partnership/

This should work:

var Stadia_StamenWatercolor = L.tileLayer('https://tiles.stadiamaps.com/tiles/stamen_watercolor/{z}/{x}/{y}.{ext}', {
	minZoom: 1,
	maxZoom: 16,
	attribution: '&copy; <a href="https://www.stadiamaps.com/" target="_blank">Stadia Maps</a> &copy; <a href="https://www.stamen.com/" target="_blank">Stamen Design</a> &copy; <a href="https://openmaptiles.org/" target="_blank">OpenMapTiles</a> &copy; <a href="https://www.openstreetmap.org/copyright">OpenStreetMap</a> contributors',
	ext: 'jpg'
});

Plugin can break other plugins

This plugin broke my installation of datasette-edit-schema. I got this error: 'dict' object has no attribute 'lower'

The traceback lead me here:

> /Users/simon/.local/share/virtualenvs/datasette-for-datasettecloud-tDBqAXoo/lib/python3.8/site-packages/datasette_cluster_map/__init__.py(83)<listcomp>()
-> columns = [column.lower() for column in columns]
(Pdb) list
 78  	
 79  	
 80  	def has_columns(database, table, columns, datasette):
 81  	    if not columns:
 82  	        return False
 83  ->	    columns = [column.lower() for column in columns]
 84  	    config = (
 85  	        datasette.plugin_config("datasette-cluster-map", database=database, table=table)
 86  	        or {}
 87  	    )
 88  	    latitude_column = config.get("latitude_column") or "latitude"

Loading gif or message

Hello!

Would it be possible to add a loading gif/message? It may take bunch of seconds before the map displays something, and I'd like my visitors to understand the map isn't going to remain grey and empty :)

I've tried to fiddle with the JS, but my DOM manipulation skills were not up to the task.

Thanks!

Support for multiple lat/lon columns

I'd like to try to publish.a dataset that has multiple locations. I'm working on an NEH grant for Green-Wood Cemetery in Brooklyn and the historic burial registries include the person's place of birth, death and residence.

Maybe something like matching columns that begin with "latitude_" and "longitude_"?

Pick up more name pairs, e.g. `long,lat`

There's no reason this tool couldn't be smarter at spotting potential latitude/longitude column pairs - since they come in pairs, there's not much risk of seeing a lat column and triggering when there's no sensible lon to accompany it.

Create cluster count based on the value of a column

Today as I was working with some data. I had the need to not only see where on a map I had database records but I was interested to see where a particular column was bigger.

The use case was to visualized some data related to greenhouse gas emission.

If I have correctly understood the JS each time a node is added to a cluster (we are adding 1). ideally I would like to override this by the value of a specific column named count (or anything else).

I am very new to datasette so may be there is a better way to do this or I am missing the point of this plugin.

Btw, thank you very much for creating datasette and sharing it with the rest of the world.

small maps using docker

>docker run --rm -p 8001:8001 -v c/Users/joe/Downloads:/mnt  datasetteproject/datasette datasette -p 8001 -h 0.0.0.0 /mnt/my.db --install=datasette-cluster-map 


Usage: datasette serve [OPTIONS] [FILES]...
Try 'datasette serve --help' for help.

Error: no such option: --install

so i have been trying to install attaching a terminal to running container:


docker exec -i -t ec5b9dd7c551 /bin/bash
root@ec5b9dd7c551:/# datasette install datasette-cluster-map
Collecting datasette-cluster-map
  Downloading datasette_cluster_map-0.17.1-py3-none-any.whl (34 kB)
Collecting datasette-leaflet>=0.2.2
  Downloading datasette_leaflet-0.2.2-py3-none-any.whl (112 kB)
     |████████████████████████████████| 112 kB 26.2 MB/s
Requirement already satisfied: datasette>=0.54 in /usr/local/lib/python3.7/site-packages (from datasette-cluster-map) (0.55)
Requirement already satisfied: click~=7.1.1 in /usr/local/li...............
....
....
Installing collected packages: datasette-leaflet, datasette-cluster-map
Successfully installed datasette-cluster-map-0.17.1 datasette-leaflet-0.2.2

and then stopped and run the container again.
Maps now available but very small. Like a banner above the data. is there any way of setting maps full windows size?

Cloudrun not loading SpatiaLite module?

I've been unable to publish a cluster map to google cloudrun even though essentially the same command runs locally. Specifically, I'm getting "Error: It looks like you're trying to load a SpatiaLite database without first loading the SpatiaLite module."

Am trying to follow the cloudrun publish example here.

That example does not use a "--load-extension" argument, but maybe it is needed? The one thing I can think of is that somehow the location isn't being set correctly on cloudrun? A different example noted that it was running in a docker container locally--is it possible that using --install=datasette-cluster-map gets misconfigured if you're not in docker? I'm running on mac os x locally, I'm a bit unclear on how packaging works...

This is the publish command I'm using:

datasette publish cloudrun --install=datasette-cluster-map --metadata=metadata.json --template-dir=custom_templates nursing_home_compare/Nursing_Homes.db --service=nh

From the google cloud logs

Showing logs for last 1 hour starting at 10/21/20, 10:40 AM.
Default
2020-10-21 11:40:14.454 PDT
Usage: datasette serve [OPTIONS] [FILES]...
Default
2020-10-21 11:40:14.454 PDT
Default
2020-10-21 11:40:14.454 PDT
Error: It looks like you're trying to load a SpatiaLite database without first loading the SpatiaLite module.
Default
2020-10-21 11:40:14.454 PDT
Default
2020-10-21 11:40:14.454 PDT
Read more: https://docs.datasette.io/en/stable/spatialite.html
Warning
2020-10-21 11:40:16.885 PDT
Container called exit(2)

This is the local log traceback:

Traceback (most recent call last):
File "/Users/jacob/.pyenv/versions/irw-accountability-3-7-3/bin/datasette", line 11, in <module>
  load_entry_point('datasette==0.50.2+6.gf3a087a.dirty', 'console_scripts', 'datasette')()
File "/Users/jacob/.pyenv/versions/3.7.3/envs/irw-accountability-3-7-3/lib/python3.7/site-packages/click/core.py", line 829, in __call__
  return self.main(*args, **kwargs)
File "/Users/jacob/.pyenv/versions/3.7.3/envs/irw-accountability-3-7-3/lib/python3.7/site-packages/click/core.py", line 782, in main
  rv = self.invoke(ctx)
File "/Users/jacob/.pyenv/versions/3.7.3/envs/irw-accountability-3-7-3/lib/python3.7/site-packages/click/core.py", line 1259, in invoke
  return _process_result(sub_ctx.command.invoke(sub_ctx))
File "/Users/jacob/.pyenv/versions/3.7.3/envs/irw-accountability-3-7-3/lib/python3.7/site-packages/click/core.py", line 1259, in invoke
  return _process_result(sub_ctx.command.invoke(sub_ctx))
File "/Users/jacob/.pyenv/versions/3.7.3/envs/irw-accountability-3-7-3/lib/python3.7/site-packages/click/core.py", line 1066, in invoke
  return ctx.invoke(self.callback, **ctx.params)
File "/Users/jacob/.pyenv/versions/3.7.3/envs/irw-accountability-3-7-3/lib/python3.7/site-packages/click/core.py", line 610, in invoke
  return callback(*args, **kwargs)
File "/Users/jacob/.pyenv/versions/3.7.3/envs/irw-accountability-3-7-3/lib/python3.7/site-packages/datasette/publish/cloudrun.py", line 142, in cloudrun
  shell=True,
File "/Users/jacob/.pyenv/versions/3.7.3/lib/python3.7/subprocess.py", line 347, in check_call
  raise CalledProcessError(retcode, cmd)
subprocess.CalledProcessError: Command 'gcloud run deploy --allow-unauthenticated --platform=managed --image gcr.io/datasette-hosting/datasette nh' returned non-zero exit status 1.

Add option to specify selector in which Leaflet is loaded.

I am using a custom _table.html template. I want to surround the table with an element which has overflow-x: scroll so that my table scrolls within its container rather than filling the width of the page. But in this case the leaflet map is put inside the scrollable container too because the code is doing this:

let table = document.querySelector('table.rows-and-columns'); table.parentNode.insertBefore(el, table);

Feature request: render-images in pins

Hi Simon
I have installed both this and datasette-render-images plugins and have a table with lat/lon and also a blob image I wish to display. However with both plugins installed the images are no longer rendered (they are if only render-images is installed). I assume there is some compatibility issue?
Cheers

image

Clustermap misinterprets SQL calculations

This query, when applied to the PUDL 0.4.0 dataset, provides a somewhat expected result:

select plant_id_eia, plant_name_eia, city, county, iso_rto_code, latitude, plants_entity_eia.longitude, primary_purpose_naics_id, sector_name, sector_id, service_area, state, street_address, zip_code, timezone from plants_entity_eia where "longitude" >= 0 order by plant_id_eia limit 11

That is to say, it shows 10 cases of "dirty data" due either to deliberate zeroes used to indicate uncertain future plans, or erroneously missing minus signs putting US-based power plants in Chinese longitudes.

What I wanted to do was to re-plot these erroneous points by using a SQL query to select them and then flip the sign of the longitude result. It did not work. I simplified to just using the plants_entity_eia table name to qualify the terms of the conditional to ignore the selection and just pay attention to raw data in the table:

select plant_id_eia, plant_name_eia, city, county, iso_rto_code, latitude, plants_entity_eia.longitude, primary_purpose_naics_id, sector_name, sector_id, service_area, state, street_address, zip_code, timezone from plants_entity_eia where "plants_entity_eia.longitude" >= 0 order by plant_id_eia limit 11

It turns out that putting that term inside the quotes results in what can only be defined as undefined behavior. When I removed the quotes, I was able to get the correct results with this query:

select plant_id_eia, plant_name_eia, city, county, iso_rto_code, latitude, -1*plants_entity_eia.longitude as longitude, primary_purpose_naics_id, sector_name, sector_id, service_area, state, street_address, zip_code, timezone from plants_entity_eia where plants_entity_eia.longitude >= 0 order by plants_entity_eia.longitude limit 11

Cluster-map not showing

I am trying to replicate the global power plants example to test the cluster map extension of datasette but no map is shown after I launch the application.

I created a separate virtual environment for this test in which I have only python 3.8 and datasette, its plugins and relative dependencies (see below). I installed the plugins using datasette install as suggested to make sure to install the packages appropriately within the environment.

When I pull up the database all seems to go well with fetching the plugin but the map is not shown.

image

I think it is likely something I am doing wrong but I cannot find a hint of where the problem might arise. Any thoughts?
I should also mention that the datasette-vega plugins works instead correctly.
Thanks for your help!

Packages Installed

# Name                    Version                   Build  Channel
aiofiles                  0.7.0                    pypi_0    pypi
anyio                     3.3.1                    pypi_0    pypi
asgi-csrf                 0.9                      pypi_0    pypi
asgiref                   3.4.1                    pypi_0    pypi
backcall                  0.2.0              pyhd3eb1b0_0
ca-certificates           2021.7.5             haa95532_1
certifi                   2021.5.30        py38haa95532_0
charset-normalizer        2.0.6                    pypi_0    pypi
click                     8.0.1                    pypi_0    pypi
click-default-group       1.2.2                    pypi_0    pypi
colorama                  0.4.4              pyhd3eb1b0_0
datasette                 0.58.1                   pypi_0    pypi
datasette-cluster-map     0.17.1                   pypi_0    pypi
datasette-leaflet         0.2.2                    pypi_0    pypi
datasette-vega            0.6.2                    pypi_0    pypi
debugpy                   1.4.1            py38hd77b12b_0
decorator                 5.0.9              pyhd3eb1b0_0
entrypoints               0.3                      py38_0
h11                       0.12.0                   pypi_0    pypi
httpcore                  0.13.7                   pypi_0    pypi
httpx                     0.19.0                   pypi_0    pypi
hupper                    1.10.3                   pypi_0    pypi
idna                      3.2                      pypi_0    pypi
ipykernel                 6.2.0            py38haa95532_1
ipython                   7.27.0           py38hd4e2768_0
ipython_genutils          0.2.0              pyhd3eb1b0_1
itsdangerous              2.0.1                    pypi_0    pypi
janus                     0.6.1                    pypi_0    pypi
jedi                      0.18.0           py38haa95532_1
jinja2                    3.0.1                    pypi_0    pypi
jupyter_client            7.0.1              pyhd3eb1b0_0
jupyter_core              4.7.1            py38haa95532_0
markupsafe                2.0.1                    pypi_0    pypi
matplotlib-inline         0.1.2              pyhd3eb1b0_2
mergedeep                 1.3.4                    pypi_0    pypi
nest-asyncio              1.5.1              pyhd3eb1b0_0
openssl                   1.1.1l               h2bbff1b_0
packaging                 21.0                     pypi_0    pypi
parso                     0.8.2              pyhd3eb1b0_0
pickleshare               0.7.5           pyhd3eb1b0_1003
pint                      0.17                     pypi_0    pypi
pip                       21.0.1           py38haa95532_0
pluggy                    0.13.1                   pypi_0    pypi
prompt-toolkit            3.0.17             pyhca03da5_0
pygments                  2.10.0             pyhd3eb1b0_0
pyparsing                 2.4.7                    pypi_0    pypi
python                    3.8.11               h6244533_1
python-baseconv           1.2.2                    pypi_0    pypi
python-dateutil           2.8.2              pyhd3eb1b0_0
python-multipart          0.0.5                    pypi_0    pypi
pywin32                   228              py38hbaba5e8_1
pyyaml                    5.4.1                    pypi_0    pypi
rfc3986                   1.5.0                    pypi_0    pypi
setuptools                58.0.4           py38haa95532_0
six                       1.16.0             pyhd3eb1b0_0
sniffio                   1.2.0                    pypi_0    pypi
sqlite                    3.36.0               h2bbff1b_0
tornado                   6.1              py38h2bbff1b_0
traitlets                 5.0.5              pyhd3eb1b0_0
uvicorn                   0.15.0                   pypi_0    pypi
vc                        14.2                 h21ff451_1
vs2015_runtime            14.27.29016          h5e58377_2
watermark                 2.2.0                    pypi_0    pypi
wcwidth                   0.2.5              pyhd3eb1b0_0
wheel                     0.37.0             pyhd3eb1b0_1
wincertstore              0.2                      py38_0

Just one invalid latitude/longitude causes the entire map to fail to load

I had data with nan strings for some columns. This resulted in the following error:

leaflet.js:5 Uncaught (in promise) Error: Invalid LatLng object: (nan, nan)
    at new j (leaflet.js:5)
    at Object.W [as latLng] (leaflet.js:5)
    at datasette-cluster-map.js:36
    at Array.forEach (<anonymous>)
    at datasette-cluster-map.js:32

Recommend Projects

  • React photo React

    A declarative, efficient, and flexible JavaScript library for building user interfaces.

  • Vue.js photo Vue.js

    🖖 Vue.js is a progressive, incrementally-adoptable JavaScript framework for building UI on the web.

  • Typescript photo Typescript

    TypeScript is a superset of JavaScript that compiles to clean JavaScript output.

  • TensorFlow photo TensorFlow

    An Open Source Machine Learning Framework for Everyone

  • Django photo Django

    The Web framework for perfectionists with deadlines.

  • D3 photo D3

    Bring data to life with SVG, Canvas and HTML. 📊📈🎉

Recommend Topics

  • javascript

    JavaScript (JS) is a lightweight interpreted programming language with first-class functions.

  • web

    Some thing interesting about web. New door for the world.

  • server

    A server is a program made to process requests and deliver data to clients.

  • Machine learning

    Machine learning is a way of modeling and interpreting data that allows a piece of software to respond intelligently.

  • Game

    Some thing interesting about game, make everyone happy.

Recommend Org

  • Facebook photo Facebook

    We are working to build community through open source technology. NB: members must have two-factor auth.

  • Microsoft photo Microsoft

    Open source projects and samples from Microsoft.

  • Google photo Google

    Google ❤️ Open Source for everyone.

  • D3 photo D3

    Data-Driven Documents codes.