GithubHelp home page GithubHelp logo

stefanprodan / swarmprom Goto Github PK

View Code? Open in Web Editor NEW
1.9K 66.0 737.0 5.79 MB

Docker Swarm instrumentation with Prometheus, Grafana, cAdvisor, Node Exporter and Alert Manager

License: MIT License

Shell 57.92% Dockerfile 42.08%
docker swarm prometheus grafana cadvisor traefik

swarmprom's Introduction

swarmprom

Swarmprom is a starter kit for Docker Swarm monitoring with Prometheus, Grafana, cAdvisor, Node Exporter, Alert Manager and Unsee.

Install

Clone this repository and run the monitoring stack:

$ git clone https://github.com/stefanprodan/swarmprom.git
$ cd swarmprom

ADMIN_USER=admin \
ADMIN_PASSWORD=admin \
SLACK_URL=https://hooks.slack.com/services/TOKEN \
SLACK_CHANNEL=devops-alerts \
SLACK_USER=alertmanager \
docker stack deploy -c docker-compose.yml mon

Prerequisites:

  • Docker CE 17.09.0-ce or Docker EE 17.06.2-ee-3
  • Swarm cluster with one manager and a worker node
  • Docker engine experimental enabled and metrics address set to 0.0.0.0:9323

Services:

  • prometheus (metrics database) http://<swarm-ip>:9090
  • grafana (visualize metrics) http://<swarm-ip>:3000
  • node-exporter (host metrics collector)
  • cadvisor (containers metrics collector)
  • dockerd-exporter (Docker daemon metrics collector, requires Docker experimental metrics-addr to be enabled)
  • alertmanager (alerts dispatcher) http://<swarm-ip>:9093
  • unsee (alert manager dashboard) http://<swarm-ip>:9094
  • caddy (reverse proxy and basic auth provider for prometheus, alertmanager and unsee)

Alternative install with Traefik and HTTPS

If you have a Docker Swarm cluster with a global Traefik set up as described in DockerSwarm.rocks, you can deploy Swarmprom integrated with that global Traefik proxy.

This way, each Swarmprom service will have its own domain, and each of them will be served using HTTPS, with certificates generated (and renewed) automatically.

Requisites

These instructions assume you already have Traefik set up following that guide above, in short:

  • With automatic HTTPS certificate generation.
  • A Docker Swarm network traefik-public.
  • Filtering to only serve containers with a label traefik.constraint-label=traefik-public.

Instructions

  • Clone this repository and enter into the directory:
$ git clone https://github.com/stefanprodan/swarmprom.git
$ cd swarmprom
  • Set and export an ADMIN_USER environment variable:
export ADMIN_USER=admin
  • Set and export an ADMIN_PASSWORD environment variable:
export ADMIN_PASSWORD=changethis
  • Set and export a hashed version of the ADMIN_PASSWORD using openssl, it will be used by Traefik's HTTP Basic Auth for most of the services:
export HASHED_PASSWORD=$(openssl passwd -apr1 $ADMIN_PASSWORD)
  • You can check the contents with:
echo $HASHED_PASSWORD

it will look like:

$apr1$89eqM5Ro$CxaFELthUKV21DpI3UTQO.
  • Create and export an environment variable DOMAIN, e.g.:
export DOMAIN=example.com

and make sure that the following sub-domains point to your Docker Swarm cluster IPs:

  • grafana.example.com
  • alertmanager.example.com
  • unsee.example.com
  • prometheus.example.com

(and replace example.com with your actual domain).

Note: You can also use a subdomain, like swarmprom.example.com. Just make sure that the subdomains point to (at least one of) your cluster IPs. Or set up a wildcard subdomain (*).

  • If you are using Slack and want to integrate it, set the following environment variables:
export SLACK_URL=https://hooks.slack.com/services/TOKEN
export SLACK_CHANNEL=devops-alerts
export SLACK_USER=alertmanager

Note: by using export when declaring all the environment variables above, the next command will be able to use them.

  • Deploy the Traefik version of the stack:
docker stack deploy -c docker-compose.traefik.yml swarmprom

To test it, go to each URL:

  • https://grafana.example.com
  • https://alertmanager.example.com
  • https://unsee.example.com
  • https://prometheus.example.com

Setup Grafana

Navigate to http://<swarm-ip>:3000 and login with user admin password admin. You can change the credentials in the compose file or by supplying the ADMIN_USER and ADMIN_PASSWORD environment variables at stack deploy.

Swarmprom Grafana is preconfigured with two dashboards and Prometheus as the default data source:

After you login, click on the home drop down, in the left upper corner and you'll see the dashboards there.

Docker Swarm Nodes Dashboard

Nodes

URL: http://<swarm-ip>:3000/dashboard/db/docker-swarm-nodes

This dashboard shows key metrics for monitoring the resource usage of your Swarm nodes and can be filtered by node ID:

  • Cluster up-time, number of nodes, number of CPUs, CPU idle gauge
  • System load average graph, CPU usage graph by node
  • Total memory, available memory gouge, total disk space and available storage gouge
  • Memory usage graph by node (used and cached)
  • I/O usage graph (read and write Bps)
  • IOPS usage (read and write operation per second) and CPU IOWait
  • Running containers graph by Swarm service and node
  • Network usage graph (inbound Bps, outbound Bps)
  • Nodes list (instance, node ID, node name)

Docker Swarm Services Dashboard

Nodes

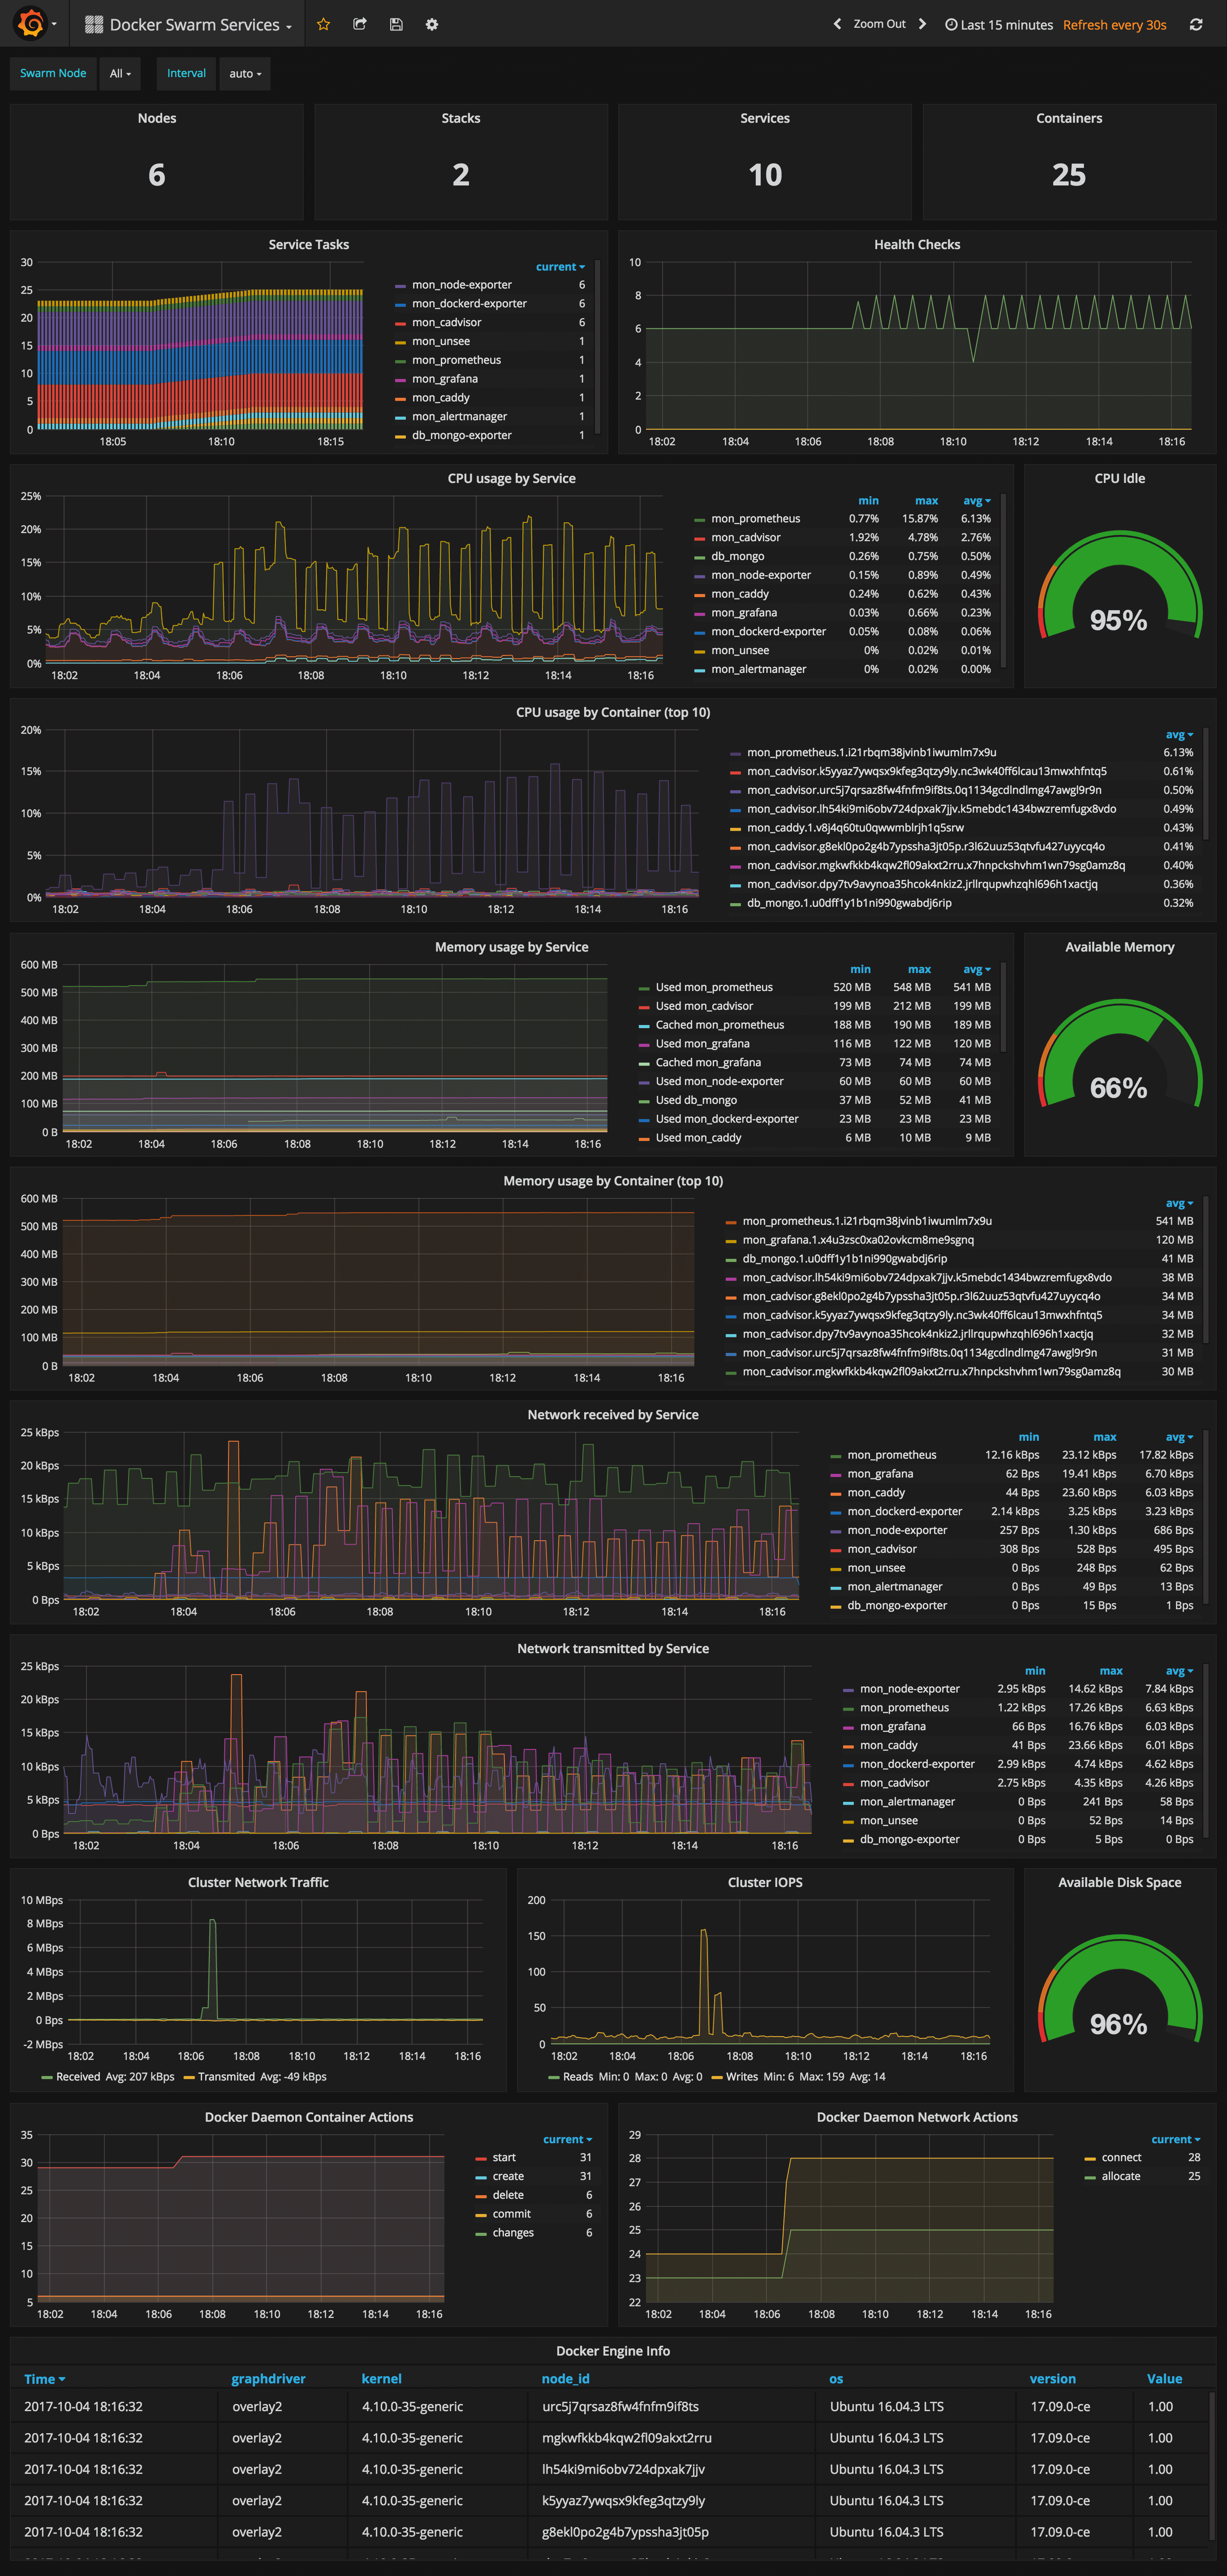
URL: http://<swarm-ip>:3000/dashboard/db/docker-swarm-services

This dashboard shows key metrics for monitoring the resource usage of your Swarm stacks and services, can be filtered by node ID:

  • Number of nodes, stacks, services and running container
  • Swarm tasks graph by service name
  • Health check graph (total health checks and failed checks)
  • CPU usage graph by service and by container (top 10)
  • Memory usage graph by service and by container (top 10)
  • Network usage graph by service (received and transmitted)
  • Cluster network traffic and IOPS graphs
  • Docker engine container and network actions by node
  • Docker engine list (version, node id, OS, kernel, graph driver)

Prometheus Stats Dashboard

Nodes

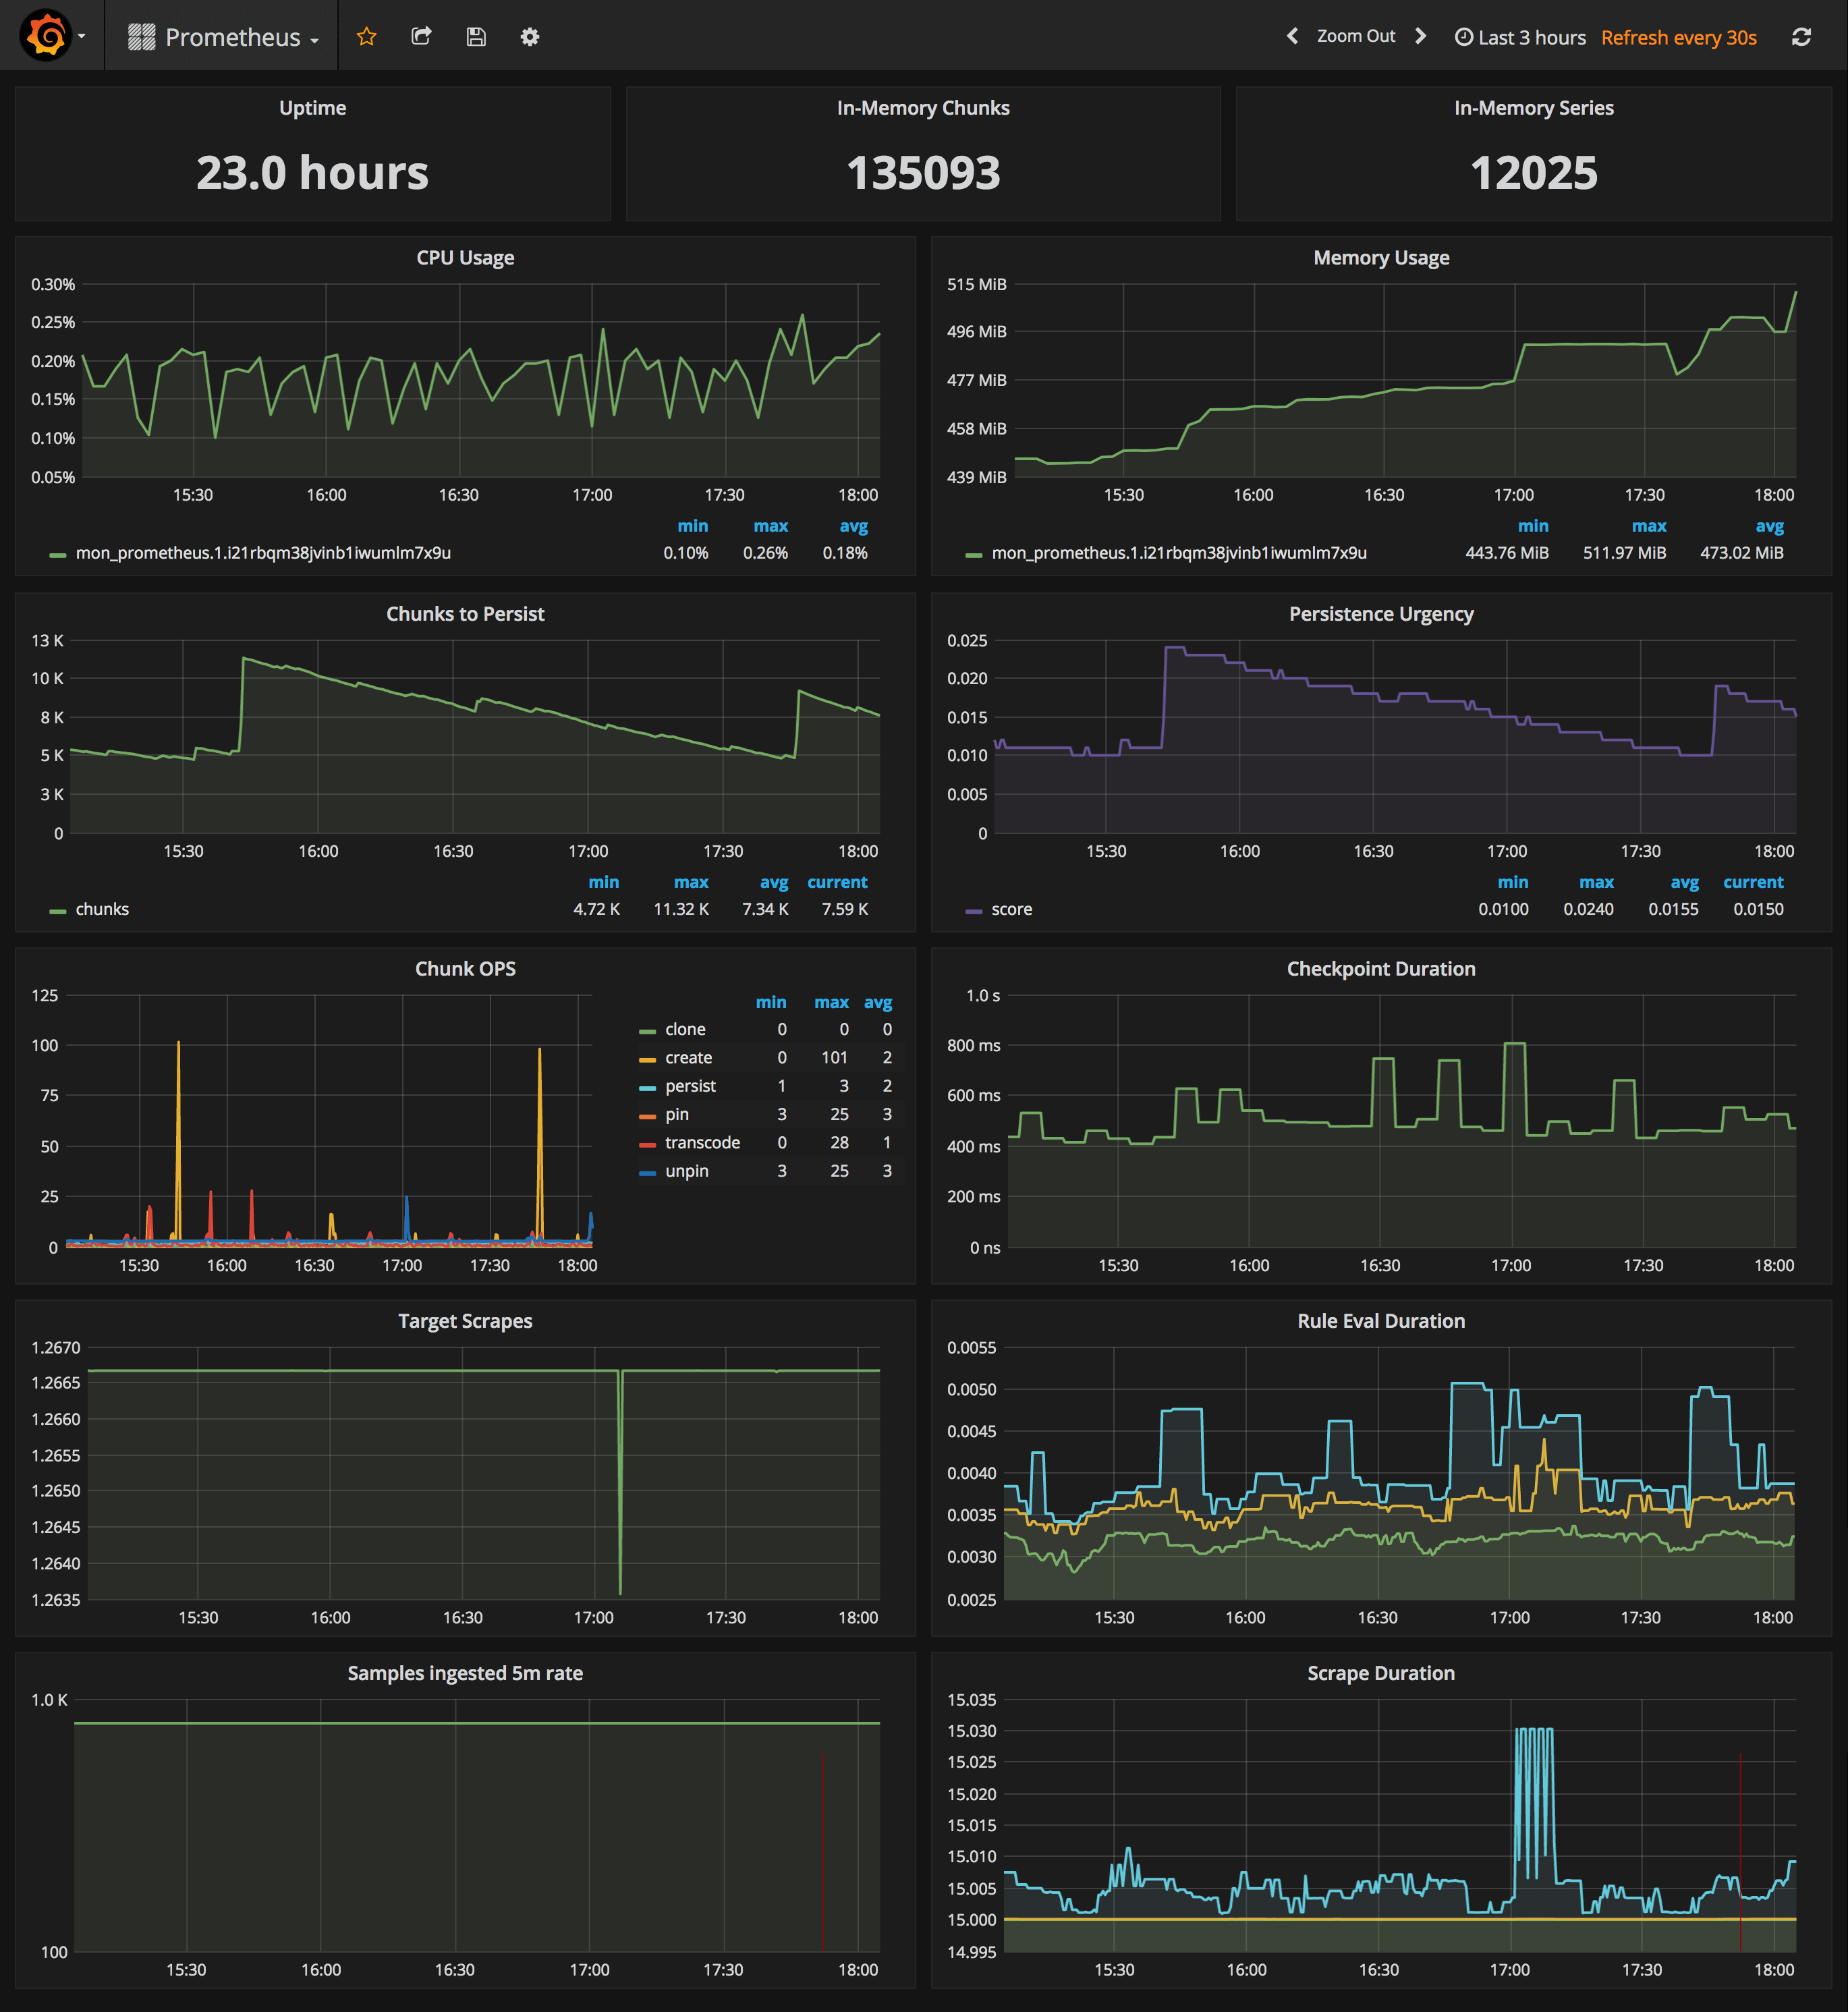
URL: http://<swarm-ip>:3000/dashboard/db/prometheus

  • Uptime, local storage memory chunks and series
  • CPU usage graph
  • Memory usage graph
  • Chunks to persist and persistence urgency graphs
  • Chunks ops and checkpoint duration graphs
  • Target scrapes, rule evaluation duration, samples ingested rate and scrape duration graphs

Prometheus service discovery

In order to collect metrics from Swarm nodes you need to deploy the exporters on each server. Using global services you don't have to manually deploy the exporters. When you scale up your cluster, Swarm will launch a cAdvisor, node-exporter and dockerd-exporter instance on the newly created nodes. All you need is an automated way for Prometheus to reach these instances.

Running Prometheus on the same overlay network as the exporter services allows you to use the DNS service discovery. Using the exporters service name, you can configure DNS discovery:

scrape_configs:
  - job_name: 'node-exporter'
    dns_sd_configs:
    - names:
      - 'tasks.node-exporter'
      type: 'A'
      port: 9100
  - job_name: 'cadvisor'
    dns_sd_configs:
    - names:
      - 'tasks.cadvisor'
      type: 'A'
      port: 8080
  - job_name: 'dockerd-exporter'
    dns_sd_configs:
    - names:
      - 'tasks.dockerd-exporter'
      type: 'A'
      port: 9323

When Prometheus runs the DNS lookup, Docker Swarm will return a list of IPs for each task. Using these IPs, Prometheus will bypass the Swarm load-balancer and will be able to scrape each exporter instance.

The problem with this approach is that you will not be able to tell which exporter runs on which node. Your Swarm nodes' real IPs are different from the exporters IPs since exporters IPs are dynamically assigned by Docker and are part of the overlay network. Swarm doesn't provide any records for the tasks DNS, besides the overlay IP. If Swarm provides SRV records with the nodes hostname or IP, you can re-label the source and overwrite the overlay IP with the real IP.

In order to tell which host a node-exporter instance is running, I had to create a prom file inside the node-exporter containing the hostname and the Docker Swarm node ID.

When a node-exporter container starts node-meta.prom is generated with the following content:

"node_meta{node_id=\"$NODE_ID\", node_name=\"$NODE_NAME\"} 1"

The node ID value is supplied via {{.Node.ID}} and the node name is extracted from the /etc/hostname file that is mounted inside the node-exporter container.

  node-exporter:
    image: stefanprodan/swarmprom-node-exporter
    environment:
      - NODE_ID={{.Node.ID}}
    volumes:
      - /etc/hostname:/etc/nodename
    command:
      - '-collector.textfile.directory=/etc/node-exporter/'

Using the textfile command, you can instruct node-exporter to collect the node_meta metric. Now that you have a metric containing the Docker Swarm node ID and name, you can use it in promql queries.

Let's say you want to find the available memory on each node, normally you would write something like this:

sum(node_memory_MemAvailable) by (instance)

{instance="10.0.0.5:9100"} 889450496
{instance="10.0.0.13:9100"} 1404162048
{instance="10.0.0.15:9100"} 1406574592

The above result is not very helpful since you can't tell what Swarm node is behind the instance IP. So let's write that query taking into account the node_meta metric:

sum(node_memory_MemAvailable * on(instance) group_left(node_id, node_name) node_meta) by (node_id, node_name)

{node_id="wrdvtftteo0uaekmdq4dxrn14",node_name="swarm-manager-1"} 889450496
{node_id="moggm3uaq8tax9ptr1if89pi7",node_name="swarm-worker-1"} 1404162048
{node_id="vkdfx99mm5u4xl2drqhnwtnsv",node_name="swarm-worker-2"} 1406574592

This is much better. Instead of overlay IPs, now I can see the actual Docker Swarm nodes ID and hostname. Knowing the hostname of your nodes is useful for alerting as well.

You can define an alert when available memory reaches 10%. You also will receive the hostname in the alert message and not some overlay IP that you can't correlate to a infrastructure item.

Maybe you are wondering why you need the node ID if you have the hostname. The node ID will help you match node-exporter instances to cAdvisor instances. All metrics exported by cAdvisor have a label named container_label_com_docker_swarm_node_id, and this label can be used to filter containers metrics by Swarm nodes.

Let's write a query to find out how many containers are running on a Swarm node. Knowing from the node_meta metric all the nodes IDs you can define a filter with them in Grafana. Assuming the filter is $node_id the container count query should look like this:

count(rate(container_last_seen{container_label_com_docker_swarm_node_id=~"$node_id"}[5m]))

Another use case for node ID is filtering the metrics provided by the Docker engine daemon. Docker engine doesn't have a label with the node ID attached on every metric, but there is a swarm_node_info metric that has this label. If you want to find out the number of failed health checks on a Swarm node you would write a query like this:

sum(engine_daemon_health_checks_failed_total) * on(instance) group_left(node_id) swarm_node_info{node_id=~"$node_id"})

For now the engine metrics are still experimental. If you want to use dockerd-exporter you have to enable the experimental feature and set the metrics address to 0.0.0.0:9323.

If you are running Docker with systemd create or edit /etc/systemd/system/docker.service.d/docker.conf file like so:

[Service]
ExecStart=
ExecStart=/usr/bin/dockerd \
  --storage-driver=overlay2 \
  --dns 8.8.4.4 --dns 8.8.8.8 \
  --experimental=true \
  --metrics-addr 0.0.0.0:9323

Apply the config changes with systemctl daemon-reload && systemctl restart docker and check if the docker_gwbridge ip address is 172.18.0.1:

ip -o addr show docker_gwbridge

Replace 172.18.0.1 with your docker_gwbridge address in the compose file:

  dockerd-exporter:
    image: stefanprodan/caddy
    environment:
      - DOCKER_GWBRIDGE_IP=172.18.0.1

Collecting Docker Swarm metrics with Prometheus is not a smooth process, and because of group_left queries tend to become more complex. In the future I hope Swarm DNS will contain the SRV record for hostname and Docker engine metrics will expose container metrics replacing cAdvisor all together.

Configure Prometheus

I've set the Prometheus retention period to 24h, you can change these values in the compose file or using the env variable PROMETHEUS_RETENTION.

  prometheus:
    image: stefanprodan/swarmprom-prometheus
    command:
      - '-storage.tsdb.retention=24h'
    deploy:
      resources:
        limits:
          memory: 2048M
        reservations:
          memory: 1024M

When using host volumes you should ensure that Prometheus doesn't get scheduled on different nodes. You can pin the Prometheus service on a specific host with placement constraints.

  prometheus:
    image: stefanprodan/swarmprom-prometheus
    volumes:
      - prometheus:/prometheus
    deploy:
      mode: replicated
      replicas: 1
      placement:
        constraints:
          - node.labels.monitoring.role == prometheus

Configure alerting

The Prometheus swarmprom comes with the following alert rules:

Swarm Node CPU Usage

Alerts when a node CPU usage goes over 80% for five minutes.

ALERT node_cpu_usage
  IF 100 - (avg(irate(node_cpu{mode="idle"}[1m])  * on(instance) group_left(node_name) node_meta * 100) by (node_name)) > 80
  FOR 5m
  LABELS      { severity="warning" }
  ANNOTATIONS {
      summary = "CPU alert for Swarm node '{{ $labels.node_name }}'",
      description = "Swarm node {{ $labels.node_name }} CPU usage is at {{ humanize $value}}%.",
  }

Swarm Node Memory Alert

Alerts when a node memory usage goes over 80% for five minutes.

ALERT node_memory_usage
  IF sum(((node_memory_MemTotal - node_memory_MemAvailable) / node_memory_MemTotal) * on(instance) group_left(node_name) node_meta * 100) by (node_name) > 80
  FOR 5m
  LABELS      { severity="warning" }
  ANNOTATIONS {
      summary = "Memory alert for Swarm node '{{ $labels.node_name }}'",
      description = "Swarm node {{ $labels.node_name }} memory usage is at {{ humanize $value}}%.",
  }

Swarm Node Disk Alert

Alerts when a node storage usage goes over 85% for five minutes.

ALERT node_disk_usage
  IF ((node_filesystem_size{mountpoint="/rootfs"} - node_filesystem_free{mountpoint="/rootfs"}) * 100 / node_filesystem_size{mountpoint="/rootfs"}) * on(instance) group_left(node_name) node_meta > 85
  FOR 5m
  LABELS      { severity="warning" }
  ANNOTATIONS {
      summary = "Disk alert for Swarm node '{{ $labels.node_name }}'",
      description = "Swarm node {{ $labels.node_name }} disk usage is at {{ humanize $value}}%.",
  }

Swarm Node Disk Fill Rate Alert

Alerts when a node storage is going to remain out of free space in six hours.

ALERT node_disk_fill_rate_6h
  IF predict_linear(node_filesystem_free{mountpoint="/rootfs"}[1h], 6*3600) * on(instance) group_left(node_name) node_meta < 0
  FOR 1h
  LABELS      { severity="critical" }
  ANNOTATIONS {
      summary = "Disk fill alert for Swarm node '{{ $labels.node_name }}'",
      description = "Swarm node {{ $labels.node_name }} disk is going to fill up in 6h.",
  }

You can add alerts to swarm_node and swarm_task files and rerun stack deploy to update them. Because these files are mounted inside the Prometheus container at run time as Docker configs you don't have to bundle them with the image.

The Alertmanager swarmprom image is configured with the Slack receiver. In order to receive alerts on Slack you have to provide the Slack API url, username and channel via environment variables:

  alertmanager:
    image: stefanprodan/swarmprom-alertmanager
    environment:
      - SLACK_URL=${SLACK_URL}
      - SLACK_CHANNEL=${SLACK_CHANNEL}
      - SLACK_USER=${SLACK_USER}

You can install the stress package with apt and test out the CPU alert, you should receive something like this:

Alerts

Cloudflare has made a great dashboard for managing alerts. Unsee can aggregate alerts from multiple Alertmanager instances, running either in HA mode or separate. You can access unsee at http://<swarm-ip>:9094 using the admin user/password set via compose up:

Unsee

Monitoring applications and backend services

You can extend swarmprom with special-purpose exporters for services like MongoDB, PostgreSQL, Kafka, Redis and also instrument your own applications using the Prometheus client libraries.

In order to scrape other services you need to attach those to the mon_net network so Prometheus can reach them. Or you can attach the mon_prometheus service to the networks where your services are running.

Once your services are reachable by Prometheus you can add the dns name and port of those services to the Prometheus config using the JOBS environment variable:

  prometheus:
    image: stefanprodan/swarmprom-prometheus
    environment:
      - JOBS=mongo-exporter:9216 kafka-exporter:9216 redis-exporter:9216

Monitoring production systems

The swarmprom project is meant as a starting point in developing your own monitoring solution. Before running this in production you should consider building and publishing your own Prometheus, node exporter and alert manager images. Docker Swarm doesn't play well with locally built images, the first step would be to setup a secure Docker registry that your Swarm has access to and push the images there. Your CI system should assign version tags to each image. Don't rely on the latest tag for continuous deployments, Prometheus will soon reach v2 and the data store will not be backwards compatible with v1.x.

Another thing you should consider is having redundancy for Prometheus and alert manager. You could run them as a service with two replicas pinned on different nodes, or even better, use a service like Weave Cloud Cortex to ship your metrics outside of your current setup. You can use Weave Cloud not only as a backup of your metrics database but you can also define alerts and use it as a data source for your Grafana dashboards. Having the alerting and monitoring system hosted on a different platform other than your production is good practice that will allow you to react quickly and efficiently when a major disaster strikes.

Swarmprom comes with built-in Weave Cloud integration, what you need to do is run the weave-compose stack with your Weave service token:

TOKEN=<WEAVE-TOKEN> \
ADMIN_USER=admin \
ADMIN_PASSWORD=admin \
docker stack deploy -c weave-compose.yml mon

This will deploy Weave Scope and Prometheus with Weave Cortex as remote write. The local retention is set to 24h so even if your internet connection drops you'll not lose data as Prometheus will retry pushing data to Weave Cloud when the connection is up again.

You can define alerts and notifications routes in Weave Cloud in the same way you would do with alert manager.

To use Grafana with Weave Cloud you have to reconfigure the Prometheus data source like this:

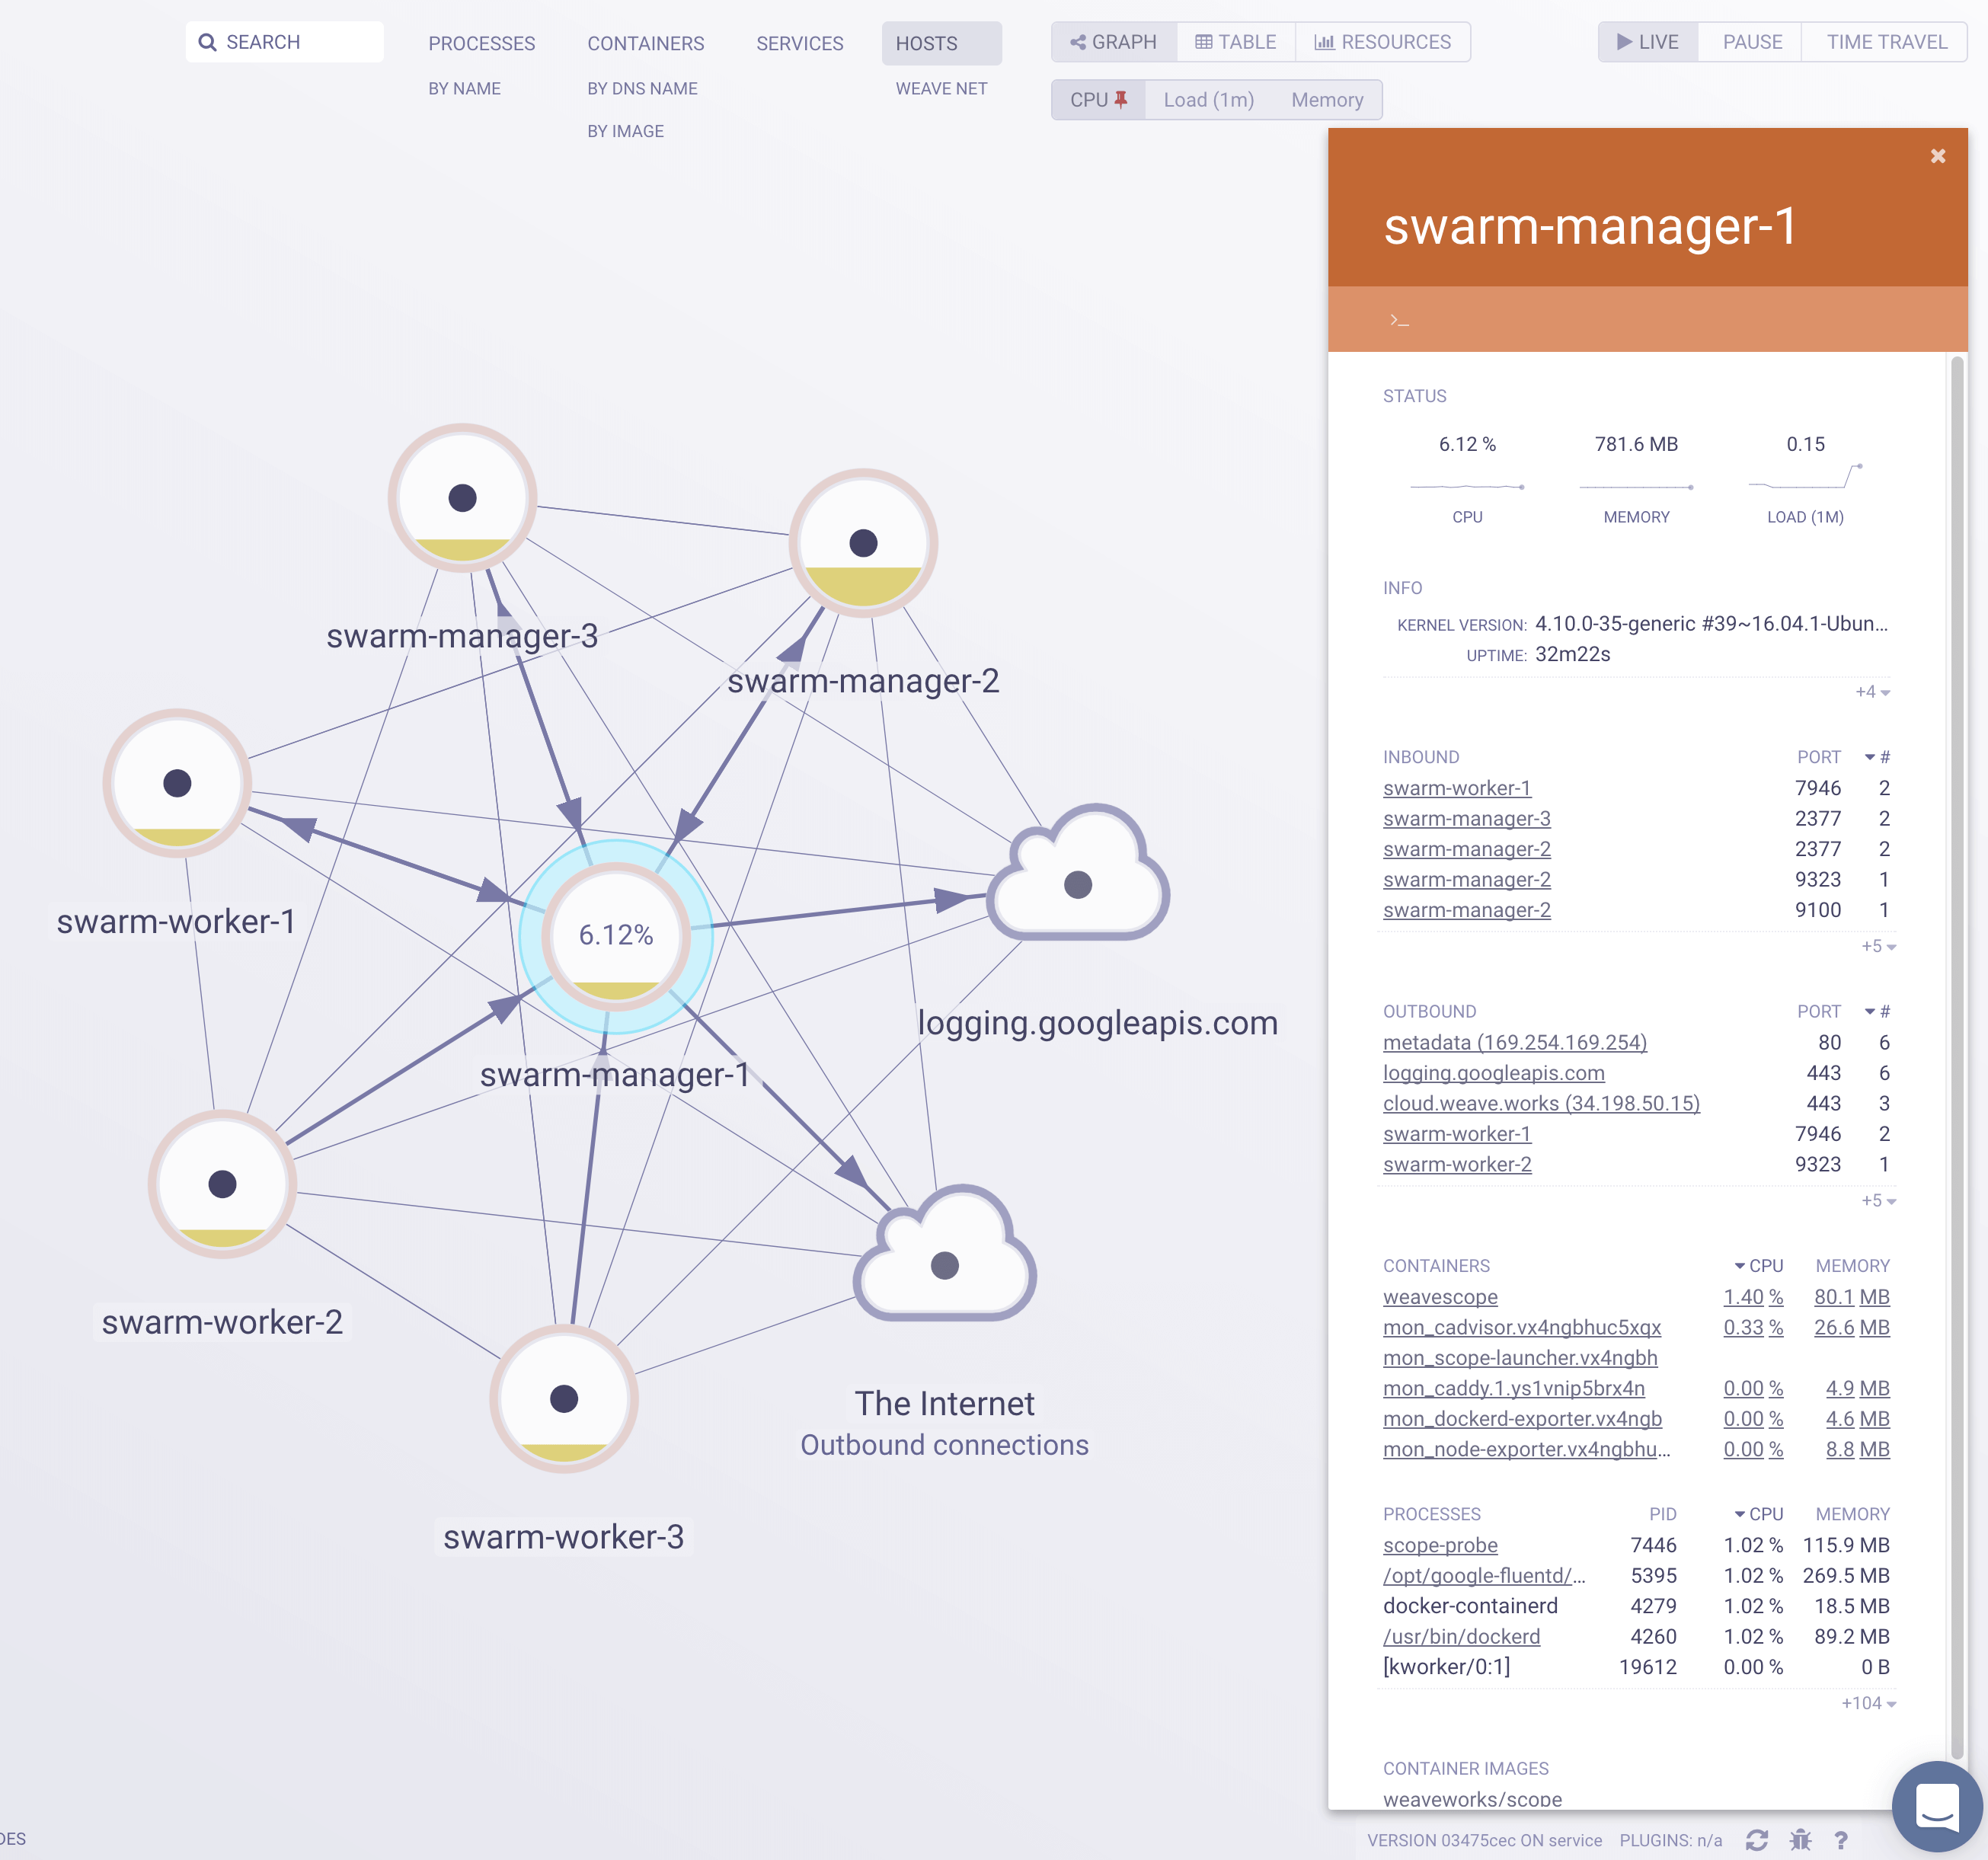
Weave Scope automatically generates a map of your application, enabling you to intuitively understand, monitor, and control your microservices based application. You can view metrics, tags and metadata of the running processes, containers and hosts. Scope offers remote access to the Swarm’s nods and containers, making it easy to diagnose issues in real-time.

Scope

Scope Hosts

swarmprom's People

Contributors

alesnav avatar aletor93 avatar amiralisobhgol avatar dariusj18 avatar eeddaann avatar harrygulliford avatar hastarin avatar jhalfmoon avatar kindratte avatar koenraadm avatar luckyluks avatar mewzherder avatar rms1000watt avatar stefanprodan avatar tarasinf avatar tiangolo avatar yorch avatar

Stargazers

 avatar  avatar  avatar  avatar  avatar  avatar  avatar  avatar  avatar  avatar  avatar  avatar  avatar  avatar  avatar  avatar  avatar  avatar  avatar  avatar  avatar  avatar  avatar  avatar  avatar  avatar  avatar  avatar  avatar  avatar  avatar  avatar  avatar  avatar  avatar  avatar  avatar  avatar  avatar  avatar  avatar  avatar  avatar  avatar  avatar  avatar  avatar  avatar  avatar  avatar  avatar  avatar  avatar  avatar  avatar  avatar  avatar  avatar  avatar  avatar  avatar  avatar  avatar  avatar  avatar  avatar  avatar  avatar  avatar  avatar  avatar  avatar  avatar  avatar  avatar  avatar  avatar  avatar  avatar  avatar  avatar  avatar  avatar  avatar  avatar  avatar  avatar  avatar  avatar  avatar  avatar  avatar  avatar  avatar  avatar  avatar  avatar  avatar  avatar  avatar

Watchers

 avatar  avatar  avatar  avatar  avatar  avatar  avatar  avatar  avatar  avatar  avatar  avatar  avatar  avatar  avatar  avatar  avatar  avatar  avatar  avatar  avatar  avatar  avatar  avatar  avatar  avatar  avatar  avatar  avatar  avatar  avatar  avatar  avatar  avatar  avatar  avatar  avatar  avatar  avatar  avatar  avatar  avatar  avatar  avatar  avatar  avatar  avatar  avatar  avatar  avatar  avatar  avatar  avatar  avatar  avatar  avatar  avatar  avatar  avatar  avatar  avatar  avatar  avatar  avatar  avatar  avatar

swarmprom's Issues

Prometheus only getting metrics from manager node

I'm new to using Prometheus and I would really appreciate some help. I've been looking into this issue for quite a bit. I have a swarm of machines with 1 manager and 7 workers. The manager is on a digital ocean instance and the workers are physical machines on my local network.

The problem is when I go to the Grafana dashboard only 1 node is being detected. When I visit the prometheus targets url at port 9090, I see 8 endpoints but only 1 is up. The rest have an error that says "context_deadline_exceeded".

On each machine, I have set the metrics address to 0.0.0.0:9323 and experimental mode is set to true. I have also enabled port 2376 on the machines, 7946, and 4789.

Any suggestions to get metrics for the other nodes is much appreciated. Thank you!

Monitoring http code status

Hi,

Is possible with swarmprom monitoring HTTP status code of my web applications? I like to get a slack notification if my application don't return HTTP 200 code.

Thanks!

Change default web access port 3000 by 80 (443)

Hi , First of all, thank you for the job you're doing. When the stack is deployed the access port to the web interface is 3000. How can it be changed to 80 (443 eventually)?

Thanks in advance for helping :)

Grafana dashboard

Dashboard and datasource are no longer included after login. there was no changes to the repo, just doing regular docker stack deploy

Progress status

Wow, I'm surprise to see this stack. I was think about migrating your dockprom project :)

As I see you are working actively on it. Do you consider it ready for other folks to try it?

Only see 2 nodes out of the 3 masters

I have deployed swarmprom on a 3 nodes cluster on Docker for AWS. All nodes are masters and are running fine but and only 2 nodes are listed in Grafana, a couple of my app stacks are also missing.
All the swarmprom services seem to run fine though.
Any hints ?

btw, thanks a lot, really great project ! 👍

Grafana reporting 171% available disk space

Bug Report

What did you do?
Deployed swarmprom in my Swarm cluster, logged into Grafana, and noticed that the available disk space exceeds 100%

prombug

What did you expect to see?
A value lower or at most equal to 100%

What did you see instead? Under which circumstances?
171%, every time

Is it a bug in the node-exporter data?
The df -h of the first of the two nodes is:

[msadmin@MS-DSC1 ~]$ df -h
Filesystem                                    Size  Used Avail Use% Mounted on
/dev/sda2                                      30G  4.1G   26G  14% /
devtmpfs                                      3.9G     0  3.9G   0% /dev
tmpfs                                         3.9G     0  3.9G   0% /dev/shm
tmpfs                                         3.9G  377M  3.6G  10% /run
tmpfs                                         3.9G     0  3.9G   0% /sys/fs/cgroup
/dev/sda1                                     497M  105M  392M  22% /boot
/dev/sdb1                                      16G   45M   15G   1% /mnt/resource
//msshare.file.core.windows.net/msshare  5.0T  8.5M  5.0T   1% /mnt/msshare
tmpfs                                         797M     0  797M   0% /run/user/1000

and the second is virtually identical.
Thank you,
Roberto

store prometheus metrics in postgresql

Hi

I'm trying to store prometheus metrics in postgresql based on prometheus-postgresql-adapter. I modified the docker-compose.yml to the docker-compose-pg-old.yml.pdf (which includes 2 additional services corresponding to the first 2 containers in prometheus-postgresql-adapter, and comments out the local storage for prometheus). The prometheus.yml is modified as shown in the prometheus.yml.pdf to direct "read" and "write" to postgresql. I had to build the prometheus docker image to include the modified prometheus.yml.

The stack is deployed under the name "mon". The mon_prometheus should connect to the "mon_prometheus_postgresql_adapter", which in turn connects to mon_pg_prometheus (the postgresql database). The problem is that "mon_prometheus" service is unable to connect the "mon_prometheus_postgresql_adapter". The logs from "mon_prometheus" says:

level=error ts=2018-02-20T04:13:33.284782524Z caller=engine.go:544 component="query engine" msg="error selecting series set" err="error sending request: Post http://mon_prometheus_postgresql_adapter:9201/read: dial tcp: lookup mon_prometheus_postgresql_adapter on 127.0.0.11:53: no such host"

Regards

grafana output

Hi

Thank you Stephan for this work. I have a question about grafana. I try to access it at "127.0.0.1:3000" but it gives me this page
graphena_output

I'm not able to access dashboards, or any other thing from grafana? I'm not sure what I did wrong?

One other question please, what should I do to access collected metric values programmatically in python? should I use a specific library? or should I forward collected metrics to a database, then access it from python?

Regards

Prometheus container is continuously restarting "Received SIGTERM, exiting gracefully..."

I am using this repo to create monitoring stack for our production swarm environments.
Have made some changes in prometheus configuration
Can you please help me to fix this problem.

  1. removed docker-enterypoint.sh
  2. Attached herewith my prometheus.yaml file
  3. Attached herewith prometheus dockerfile
  4. Modified docker-compose.yml
    Share whole code @ https://codeshare.io/5gb8My

I could deploy all services except getting below error on prometheus container

`deb795407a (none))"

level=info ts=2018-03-07T17:07:38.10631854Z caller=main.go:228 fd_limits="(soft=1048576, hard=1048576)"
level=info ts=2018-03-07T17:07:38.109652503Z caller=main.go:502 msg="Starting TSDB ..."
level=info ts=2018-03-07T17:07:38.127573843Z caller=web.go:383 component=web msg="Start listening for connections" address=0.0.0.0:9090
level=info ts=2018-03-07T17:07:38.574693038Z caller=main.go:512 msg="TSDB started"
level=info ts=2018-03-07T17:07:38.574933556Z caller=main.go:588 msg="Loading configuration file" filename=/etc/prometheus/prometheus.yml
level=info ts=2018-03-07T17:07:38.578334416Z caller=main.go:489 msg="Server is ready to receive web requests."
level=warn ts=2018-03-07T17:08:05.313728189Z caller=main.go:366 msg="Received SIGTERM, exiting gracefully..."
level=info ts=2018-03-07T17:08:05.313788495Z caller=main.go:390 msg="Stopping scrape discovery manager..."
level=info ts=2018-03-07T17:08:05.3138142Z caller=main.go:403 msg="Stopping notify discovery manager..."
level=info ts=2018-03-07T17:08:05.313828264Z caller=main.go:427 msg="Stopping scrape manager..."
level=info ts=2018-03-07T17:08:05.313855348Z caller=main.go:386 msg="Scrape discovery manager stopped"
level=info ts=2018-03-07T17:08:05.313893078Z caller=main.go:399 msg="Notify discovery manager stopped"
level=info ts=2018-03-07T17:08:05.31401654Z caller=main.go:421 msg="Scrape manager stopped"
level=info ts=2018-03-07T17:08:05.317560586Z caller=manager.go:460 component="rule manager" msg="Stopping rule manager..."
level=info ts=2018-03-07T17:08:05.317627258Z caller=manager.go:466 component="rule manager" msg="Rule manager stopped"
level=info ts=2018-03-07T17:08:05.31764061Z caller=notifier.go:493 component=notifier msg="Stopping notification manager..."
level=info ts=2018-03-07T17:08:05.317659353Z caller=main.go:573 msg="Notifier manager stopped"
level=info ts=2018-03-07T17:08:05.317714607Z caller=main.go:584 msg="See you next time!"`

`docker@manager:/Users/gaurav.goyal/gg/swarmprom/prometheus/conf$ cat prometheus.yml
global:
scrape_interval: 15s
evaluation_interval: 15s

external_labels:
monitor: 'promswarm'

rule_files:

"swarm_node.rules.yml"
"swarm_task.rules.yml"
alerting:
alertmanagers:

static_configs:
targets:
alertmanager:9093
scrape_configs:

job_name: 'prometheus'
static_configs:
targets: ['localhost:9090']

  • job_name: 'dockerd-exporter'
    dns_sd_configs:
  • names:
  • 'tasks.dockerd-exporter'
    type: 'A'
    port: 9323
    job_name: 'cadvisor'
    dns_sd_configs:

names:
'tasks.cadvisor'
type: 'A'
port: 8080
job_name: 'node-exporter'
dns_sd_configs:

names:
'tasks.node-exporter'
type: 'A'
port: 9100
job_name: 'grafana'
dns_sd_configs:

names:
'tasks.grafana'
type: 'A'
port: 3000 FROM prom/prometheus:v2.2.0-rc.0

COPY conf/ /etc/prometheus/

#ENTRYPOINT [ "/etc/prometheus/docker-entrypoint.sh" ]
CMD [ "--config.file=/etc/prometheus/prometheus.yml",
"--storage.tsdb.path=/prometheus",
"--web.console.libraries=/usr/share/prometheus/console_libraries",
"--web.console.templates=/usr/share/prometheus/consoles" ]`

node_meta metrics are messy on Prometheus console

I have tried to use Prometheus to monitor two docker swarms together refer to your swarmprom guide.
Since Prometheus is not in the same overlay network with the monitored nodes, I tried to use static_config instead of dns_sd_configs:

  1. Deploy node-exporter, cadvisor, dockerd-exporter as global service on two docker swarm seperately.
  2. Add all node-exporter, cadvisor, dockerd-exporter targets using static_config in prometheus.yml
    eg.
    scrape_configs:
  • job_name: 'prometheus'
    static_configs:

    • targets: ['localhost:9090']
  • job_name: 'node-exporter'
    static_configs:

    • targets: ['infbjsrv35.cn.oracle.com:9100','infbjsrv36.cn.oracle.com:9100','infbjvm539.cn.oracle.com:9100','infbjvm223.cn.oracle.com:9100']
  1. Start Prometheus, alertmanager and unsee on another host(which is not node of any swarm)
    When check node_meta metrics on Prometheus console, I found the node_meta is messy.
    In each swarm, the node_meta data from one node will mismach each node exporter instance to composed a node meta metric.
    For eg. swarm “A” has two nodes: infbjsrv35.cn.oracle.com and infbjvm223.cn.oracle.com
    node_meta from http://infbjsrv35.cn.oracle.com:9100/metrics is
    node_meta{container_label_com_docker_swarm_node_id="n9x7iwqhqe51y80c00a5c16fd",node_id="n9x7iwqhqe51y80c00a5c16fd",node_name="infbjsrv35.cn.oracle.com"} 1

node_meta from http://infbjvm223.cn.oracle.com:9100/metrics is
node_meta{container_label_com_docker_swarm_node_id="wx86gspnvhgdli8kq0k93m392",node_id="wx86gspnvhgdli8kq0k93m392",node_name="infbjvm223.cn.oracle.com"} 1

But from Prometheus console, the result of executing node_meta will show 4 metrics, mismached the instances and the node meta data:
node_meta{container_label_com_docker_swarm_node_id="n9x7iwqhqe51y80c00a5c16fd",instance="infbjvm223.cn.oracle.com:9100",job="node-exporter",node_id="n9x7iwqhqe51y80c00a5c16fd",node_name="infbjsrv35.cn.oracle.com"} | 1
node_meta{container_label_com_docker_swarm_node_id="n9x7iwqhqe51y80c00a5c16fd",instance="infbjsrv35.cn.oracle.com:9100",job="node-exporter",node_id="n9x7iwqhqe51y80c00a5c16fd",node_name="infbjsrv35.cn.oracle.com"} | 1
node_meta{container_label_com_docker_swarm_node_id="wx86gspnvhgdli8kq0k93m392",instance="infbjvm223.cn.oracle.com:9100",job="node-exporter",node_id="wx86gspnvhgdli8kq0k93m392",node_name="infbjvm223.cn.oracle.com"} | 1
node_meta{container_label_com_docker_swarm_node_id="wx86gspnvhgdli8kq0k93m392",instance="infbjsrv35.cn.oracle.com:9100",job="node-exporter",node_id="wx86gspnvhgdli8kq0k93m392",node_name="infbjvm223.cn.oracle.com"} | 1

I can not understand why this happen, and why dns_sd_configs can collect the right node metadata.
Can you help me?

Swarm services dashboard is not showing services running on the manager node.

Hi,

My cluster has 2 nodes, 1 manager and 1 worker.

In the swarm node dashboard I can see details for all the nodes (except for CPU usage for both the nodes, is it normal?)

In the swarm services dashboard, I 'm only seeing details from my worker node. When I explicitly select the master node, I don't see anything. As if it's not reading anything from my master.

Unable to scrape outside the swarm.

I'm having trouble scraping data outside of the swarm. I do not get any errors but no data shows up. Here is my prometheus.yml. Its the default file with very minor changes. Any thoughts?

global:
scrape_interval: 15s
evaluation_interval: 15s

external_labels:
monitor: 'promswarm'

rule_files:

  • "swarm_node.rules.yml"
  • "swarm_task.rules.yml"

alerting:
alertmanagers:

  • static_configs:
    • targets:
      • alertmanager:9093

scrape_configs:

  • job_name: 'prometheus'
    static_configs:

    • targets: ['localhost:9090']
  • job_name: 'dockerd-exporter'
    dns_sd_configs:

    • names:
      • 'tasks.dockerd-exporter'
        type: 'A'
        port: 9323
  • job_name: 'cadvisor'
    dns_sd_configs:

    • names:
      • 'tasks.cadvisor'
        type: 'A'
        port: 8080
  • job_name: 'node-exporter'
    dns_sd_configs:

    • names:
      • 'tasks.node-exporter'
        type: 'A'
        port: 9100
  • job_name: 'perforce_node_exporter'
    scrape_interval: 30s
    static_configs:

    • targets:
      • xxx.xxx.xxx.xxx
      • xxx.xxx.xxx.xxx
      • xxx.xxx.xxx.xxx
      • xxx.xxx.xxx.xxx
      • xxx.xxx.xxx.xxx

swarm nodes

first thanks for this nice stack!
for some reason swarm node dashboard always shows wrong number of nodes, it is correct in services dashboard but not in swarm nodes, any idea what it could be?

No graph in swarm node dashboarb

Hi ,
Running docker CE 17.12.0-ce in swarm mode with 3 nodes.
I have deployed swarmprom and everything work fine except that i have no graph in grafana swarm node dashboard.

Any idea ?

Password with @

My password had caracter @ and this caused error on function grafana_api in docker-entrypoint.sh from container Grafana.

templating error when I log in ...

when I log into :3000 at first I get a templating error ...

Templating init failed
[object Object]

api/datasources/proxy/1/api/v1/query_range?query=sum(irate(node_cpu%7Bmode%3D%22idle%22%7D%5B30s%5D)%20*%20on(instance)%20group_left(node_name)%20node_meta%7Bnode_id%3D~%22.%2B%22%7D)%20*%20100%20%2F%20count_scalar(node_cpu%7Bmode%3D%22user%22%7D%20*%20on(instance)%20group_left(node_name)%20node_meta%7Bnode_id%3D~%22.%2B%22%7D)%20&start=1512715040&end=1512715100&step=1

Grafana does not detect any of the docker swarm Dashboards

I've tried this a few times, and logged in an verified the docker swarm nodes and services dashboards are present in the /etc/grafana/dashboards directory, however it never sees them for import.

When I manually import the json files, they result in completely blank dashboards.

Not able to monitor 3rd party exporters

Hi Stefan,

I tried to follow the "https://github.com/stefanprodan/swarmprom#monitoring-applications-and-backend-services" to monitor kafka and MySQL services using Prometheus provided exporters for these tools.

Eg. this one for MySQL
https://github.com/prometheus/mysqld_exporter

I configured this in docker-compose file

    environment:
      - JOBS=kafka-exporter:9308 mysql-exporter:9104

Now I can see the metrics from the web browser. But my Prometheus is not scraping any metrics from them.

So I have some confusion here.

  1. I 've attached these exporter containers to my mon_net network. But I started them with the docker run command, do I need to start with them with stack?
  2. If I want to use the blackbox exporter which needs much more arguments than the exporter name and port how do I pass them to the container? given that I can't edit the Prometheus.yml file.

Thanks for the help.

Regards,
Ashish

Dockerd-exporters are always down

Good day. And thanks for the great project. I really admire this one.

I run your stack on cluster with 1 manager and 2 workers. Everything looks good, but in Prometheus dashboard I see the next one:

dockerd-exporter-down

As you write here, I update /etc/docker/daemon.json and restart docker service:

{
  "experimental": true,
  "metrics-addr": "0.0.0.0:9323"
}

I check my DOCKER_GWBRIDGE_IP:

$ ip -o addr show docker_gwbridge

3: docker_gwbridge    inet 172.18.0.1/16 brd 172.18.255.255 scope global docker_gwbridge\       valid_lft forever preferred_lft forever

If I curl this endpoint with next IPs, everything works:

$ curl http://172.18.0.1:9323/metrics
$ curl http://0.0.0.0:9323/metrics
$ curl http://localhost:9323/metrics

But in Prometheus dockerd-exporter statuses are always down.

$ docker service logs mon_dockerd-exporter

mon_dockerd-exporter.0.ofok9t4isfk9@node-1    | Activating privacy features... done.
mon_dockerd-exporter.0.ofok9t4isfk9@node-1    | http://:9323
mon_dockerd-exporter.0.ofok9t4isfk9@node-1    | 03/Apr/2018:07:36:34 +0000 [ERROR 502 /metrics] context canceled
mon_dockerd-exporter.0.ofok9t4isfk9@node-1    | 03/Apr/2018:07:36:49 +0000 [ERROR 502 /metrics] context canceled
mon_dockerd-exporter.0.ofok9t4isfk9@node-1    | 03/Apr/2018:07:37:04 +0000 [ERROR 502 /metrics] context canceled
mon_dockerd-exporter.0.ofok9t4isfk9@node-1    | 03/Apr/2018:07:37:19 +0000 [ERROR 502 /metrics] context canceled
mon_dockerd-exporter.0.ofok9t4isfk9@node-1    | 03/Apr/2018:07:37:34 +0000 [ERROR 502 /metrics] context canceled
mon_dockerd-exporter.0.ofok9t4isfk9@node-1    | 03/Apr/2018:07:37:49 +0000 [ERROR 502 /metrics] context canceled
mon_dockerd-exporter.0.rfzakmu3h1ml@node-2    | Activating privacy features... done.
mon_dockerd-exporter.0.rfzakmu3h1ml@node-2    | http://:9323
mon_dockerd-exporter.0.rfzakmu3h1ml@node-2    | 03/Apr/2018:07:36:37 +0000 [ERROR 502 /metrics] context canceled
mon_dockerd-exporter.0.rfzakmu3h1ml@node-2    | 03/Apr/2018:07:36:52 +0000 [ERROR 502 /metrics] context canceled
mon_dockerd-exporter.0.rfzakmu3h1ml@node-2    | 03/Apr/2018:07:37:07 +0000 [ERROR 502 /metrics] context canceled
mon_dockerd-exporter.0.rfzakmu3h1ml@node-2    | 03/Apr/2018:07:37:22 +0000 [ERROR 502 /metrics] context canceled
mon_dockerd-exporter.0.rfzakmu3h1ml@node-2    | 03/Apr/2018:07:37:37 +0000 [ERROR 502 /metrics] context canceled
mon_dockerd-exporter.0.rfzakmu3h1ml@node-2    | 03/Apr/2018:07:37:52 +0000 [ERROR 502 /metrics] context canceled
mon_dockerd-exporter.0.z9ud5s9c2u2s@node-3    | Activating privacy features... done.
mon_dockerd-exporter.0.z9ud5s9c2u2s@node-3    | http://:9323
mon_dockerd-exporter.0.z9ud5s9c2u2s@node-3    | 03/Apr/2018:07:36:36 +0000 [ERROR 502 /metrics] context canceled
mon_dockerd-exporter.0.z9ud5s9c2u2s@node-3    | 03/Apr/2018:07:36:51 +0000 [ERROR 502 /metrics] context canceled
mon_dockerd-exporter.0.z9ud5s9c2u2s@node-3    | 03/Apr/2018:07:37:06 +0000 [ERROR 502 /metrics] context canceled
mon_dockerd-exporter.0.z9ud5s9c2u2s@node-3    | 03/Apr/2018:07:37:21 +0000 [ERROR 502 /metrics] context canceled
mon_dockerd-exporter.0.z9ud5s9c2u2s@node-3    | 03/Apr/2018:07:37:36 +0000 [ERROR 502 /metrics] context canceled
mon_dockerd-exporter.0.z9ud5s9c2u2s@node-3    | 03/Apr/2018:07:37:51 +0000 [ERROR 502 /metrics] context canceled

Prometheus.yml needs to be pulled into Docker Configs

Generally speaking, SwarmProm is a great starting point. One issue we're running into implementing this solution, however, is that (at this point) there is no way to extend prometheus metrics to other things.

For instance, we would like to monitor Traefik (BTW as an Aside, you should look at replacing Caddy with Traefik in your stack...In my opinion, it's an easier to configure traffic router than Caddy, with less random config files...YMMV) with Prometheus.

However, when I go to pull prometheus.yml out (create a docker config file for it, add that config into the monitoring stack file) upon starting prometheus we're getting:

"mv: can't rename '/tmp/prometheus.yml': Device or resource busy"

Meaning prometheus appears to already be running by the time Docker attempts to mount the prometheus.yml file into /etc/prometheus.

The only way to add to the scrape configs at this point is to download your Dockerfile / prometheus.yml file and re-build the prometheus container...so the prometheus included in this stack cannot really be extended to monitor other things.

Help a guy out? There's got to be a way to externalize the prometheus.yml file so that it can come in from docker configs (like the rules files do).

caddy not starting.

Hi,

the caddy server is not starting, when I do a docker service ls, all the services I see as started with caddy only having replica as 0/1.
I did inspect and its doesn't show any error or even no logs o/p too from the container. When I remove the stack and redeploy it, sometimes the health of the caaddy container is starting and sometimes it's unhealthy.

I 'm running this on a Ubuntu 16-04 node with latest docker version.

Support for Arm (raspberry Pi 3)

Hello Stefan,

Great project + blog explaining the whole thing!!

Is there any chance to have this project working on a docker swarm build upon 5 raspberry pi 3 nodes?

Greetz,
Raymond

Disable Basic Authentication

How to do i disable the basic authentication that is now required for me to login. I understand that caddy service is responsible for authentication but i cant figure out how to disable it. Any idea?

Disable Basic Authentication

How to Disable basic Authentication. I understand that caddy service is responsible for authentication. How do I bypass this basic authentication. Any help? Thanks

relabing metrics

men if there is a better way to use this "sum(node_memory_MemAvailable * on(instance) group_left(node_id, node_name) node_meta) by (node_id, node_name)", i'll appreciate maybe some metrics_relabel thanks

Monitor Missing/Crashing containers

Hi Stefan,

Need you advise please to understand how to monitor if a container is not running (the reasons could be someone deleted the container, crashed, etc etc).

Eg. I 've a kafka cluster with 3 zookeeper nodes and 3 kafka nodes. I want to be altered if any of the kafka or zookeeper node goes down or is not responding.

Since your setup I can't put additional configs in Prometheus.yml, how can I create such rules with the rules file?

Prometheus 502 Bad Gateway Error

Hello,

I'm new to Docker, Prometheus and Grafana. Trying to learn the basic stuff. I followed the steps that has been said in this repository.I have no problem reaching to Grafana, Alert Manager with <swarm_ip>:xxxx, but when I try to reach Prometheus, <swarm_ip>:9090 I get a 502 Bad Gateway error. Unfortunately I couldn't find a documentation on Prometheus errors.

PS: Thanks for the great tutorial.

alertmanager container mutates config file

It would be better IMO to just copy the alertmanager.yml file into the /tmp folder in the Dockerfile and have the entrypoint perform the file modifications as a part of the copy.

If I try and add a docker config file to the path /etc/alertmanager/alertmanager.yml i get the error

mv: can't rename '/tmp/alertmanager.yml': Device or resource busy

Alertmanager fails to start

Hi !

the alertmanager container is stuck in an endless loop of starting and exiting straight away. These are the logs that I can get from a container:

time="2017-10-02T15:13:34Z" level=info msg="Starting alertmanager (version=0.8.0, branch=HEAD, revision=74e7e48d24bddd2e2a80c7840af9b2de271cc74c)" source="main.go:109"
time="2017-10-02T15:13:34Z" level=info msg="Build context (go=go1.8.3, user=root@439065dc2905, date=20170720-14:14:06)" source="main.go:110"
time="2017-10-02T15:13:34Z" level=info msg="Loading configuration file" file="/etc/alertmanager/alertmanager.yml" source="main.go:234"
time="2017-10-02T15:13:34Z" level=error msg="Loading configuration file failed: no global Slack API URL set" file="/etc/alertmanager/alertmanager.yml" source="main.go:237"

I've set the env variables for each of these ADMIN_USER, ADMIN_PASSWORD, SLACK_URL, SLACK_CHANNEL, SLACK_USER and I don't know what else to do to make this to work properly.

Task rules Slack notification appear wrong

Hello,
can you help me? Why following task_high_memory_usage_1g defined task rule (default):

  - alert: task_high_memory_usage_1g
    expr: |
      sum(container_memory_rss{container_label_com_docker_swarm_task_name=~".+"})
      BY (container_label_com_docker_swarm_task_name, container_label_com_docker_swarm_node_id) > 1e+09
    for: 5m
    annotations:
      description: '{{ $labels.container_label_com_docker_swarm_task_name }} on ''{{ $labels.container_label_com_docker_swarm_node_id }}'' memory usage is {{ humanize $value }}.'
      summary: Memory alert for Swarm task '{{ $labels.container_label_com_docker_swarm_task_name }}' on '{{ $labels.container_label_com_docker_swarm_node_id }}'

Appers in Slack like below?
task_high_memory_usage_1g
No description or other annotations.

task_high_cpu_usage_50 task rule appears correctly:

task_high_cpu_usage_50

Thank you.

Idea: Working around complicated hostname vs. container ip...

In my case it is possible to manually define the hosts to scrape (with hostnames) because they normally do not change.
Then I simply mapped the cAdvisor and node_exporter ports to the host machine so I can combine docker, cAdvisor and node_exporter metrics.
Is this a good, bad or ugly way?
Just an idea...

Docker stack deploy settings are ignored on Docker CE v17.12

All values in this command will be ignored:

ADMIN_USER=admin \
ADMIN_PASSWORD=admin \
SLACK_URL=https://hooks.slack.com/services/TOKEN \
SLACK_CHANNEL=devops-alerts \
SLACK_USER=alertmanager \
docker stack deploy -c docker-compose.yml mon

Ref. e.g. "The same effect occurs without the env_file: .env line, or with "$FOOVAR" in the actual command.

Tested on this docker:

Client:
 Version:       17.12.0-ce
 API version:   1.35
 Go version:    go1.9.2
 Git commit:    c97c6d6
 Built: Wed Dec 27 20:11:19 2017
 OS/Arch:       linux/amd64

Server:
 Engine:
  Version:      17.12.0-ce
  API version:  1.35 (minimum version 1.12)
  Go version:   go1.9.2
  Git commit:   c97c6d6
  Built:        Wed Dec 27 20:09:53 2017
  OS/Arch:      linux/amd64
  Experimental: true

Does not work

node-exporter doesn't capture network traffic

In the current stack the node-exporter services cannot capture the network traffic stats since they aren't attached to the host network.

If one does switch to use the host network then it works fine again but Prometheus cannot discover the exporters anymore.

Is there a way to support both discover and host networking or i have to choose between the two features when using this stack?

Would engine metrics be insecure?

Using experimental and 0.0.0.0:9323 pretty much export the port to the public is there other secure way to export this, and not show it to anyone?

ADMIN vars ???

Been reading the README and it doesn't state WHERE we put the ADMIN vars. No file is given in the README. I see them referenced in the code but I see no place to set them and can only ASSUME we set those in bash as env variables.

But in looking at issue #2 (#2), it looks like we don't... but it doesn't state WHAT FILE to declare those in.

Can someone clarify this in documentation???

How to get the domain name for instances at prometheus dns_sd_configs configuration

At the Part of Prometheus service discovery, the names configured for DNS discovery are formed as tasks.<servicename>:

scrape_configs:
  - job_name: 'node-exporter'
    dns_sd_configs:
    - names:
      - 'tasks.node-exporter'
      type: 'A'
      port: 9100

The names should be <domain_name>. I have no idea of how does the form of tasks.<servicename> come from. Is it comes from your DNS configuration or docker swarm mode discovery?

Having an issue with adding service monitoring.

When I try to monitor an application, for example Redis, I'm having issues.
My config:

*docker-compose.yml:
prometheus:
image: stefanprodan/swarmprom-prometheus
environment:

  • JOBS=redis-exporter:9121

*prometheus.yml:
job_name: 'redis-exporter'
dns_sd_configs:
names:
'tasks.redis-exporter'
type: 'A'
port: 9121
*compose-redis.yml:
version: '3'

networks:
mon_net:
external: true

services:
redis:
image: redis
networks:

  • mon_net
    ports:
  • "6379:6379"
    deploy:
    mode: global

redis-exporter:
image: oliver006/redis_exporter
networks:

  • mon_net
    ports:
  • "9121:9121"
    deploy:
    mode: global

When I run the monitoring stack and then compose-redis:

Prometheus goes up and down all the time.

Log shows:

level=error ts=2018-02-19T16:49:15.594740858Z caller=main.go:582 err="Error loading config couldn't load configuration (--config.file=/etc/prometheus/prometheus.yml): parsing YAML file /etc/prometheus/prometheus.yml: unknown fields in alertmanager config: job_name"

I have no idea how to fix this or what I did wrong.
Any help would be appreciated.

Sorry for posting in the wrong place at first.

Thanks

Instance down

Have you ever tried creating a rule like if the node went down then it will throw an alert?

Not able to monitor Swarm master in Grafana ?

In current setup, we have 3 nodes and 1 master.

All nodes are visible properly on Grafana but Master is not visible Grafana.

Please help me to resolve this issu.

Thanks in advance :-)

Question about service discovery

Hi I d like use Prometheus in swarm . It is not clear for me if I need to add in the composer consul installation or if consul and registrator is already present inside this bundle . In the first case is there particular setting in Prometheus to add ?

Recommend Projects

  • React photo React

    A declarative, efficient, and flexible JavaScript library for building user interfaces.

  • Vue.js photo Vue.js

    🖖 Vue.js is a progressive, incrementally-adoptable JavaScript framework for building UI on the web.

  • Typescript photo Typescript

    TypeScript is a superset of JavaScript that compiles to clean JavaScript output.

  • TensorFlow photo TensorFlow

    An Open Source Machine Learning Framework for Everyone

  • Django photo Django

    The Web framework for perfectionists with deadlines.

  • D3 photo D3

    Bring data to life with SVG, Canvas and HTML. 📊📈🎉

Recommend Topics

  • javascript

    JavaScript (JS) is a lightweight interpreted programming language with first-class functions.

  • web

    Some thing interesting about web. New door for the world.

  • server

    A server is a program made to process requests and deliver data to clients.

  • Machine learning

    Machine learning is a way of modeling and interpreting data that allows a piece of software to respond intelligently.

  • Game

    Some thing interesting about game, make everyone happy.

Recommend Org

  • Facebook photo Facebook

    We are working to build community through open source technology. NB: members must have two-factor auth.

  • Microsoft photo Microsoft

    Open source projects and samples from Microsoft.

  • Google photo Google

    Google ❤️ Open Source for everyone.

  • D3 photo D3

    Data-Driven Documents codes.