timelyportfolio / ebc_portal Goto Github PK
View Code? Open in Web Editor NEWThis project forked from scheng87/ebc_portal
Repo for data visualizations and framework for the Evidence for Nature and People Data Portal
This project forked from scheng87/ebc_portal
Repo for data visualizations and framework for the Evidence for Nature and People Data Portal


As @scheng87 mentioned in #22, the faceted bars can become quite small and difficult to read. While zoom is available, I am not sure I like this as a way to navigate/interact with the charts. I will try to propose other alternatives. Given deadlines however, I am starting to get very concerned with any new functionality.
As discussed, I increased the size of the graph titles. @scheng87, does this look ok?
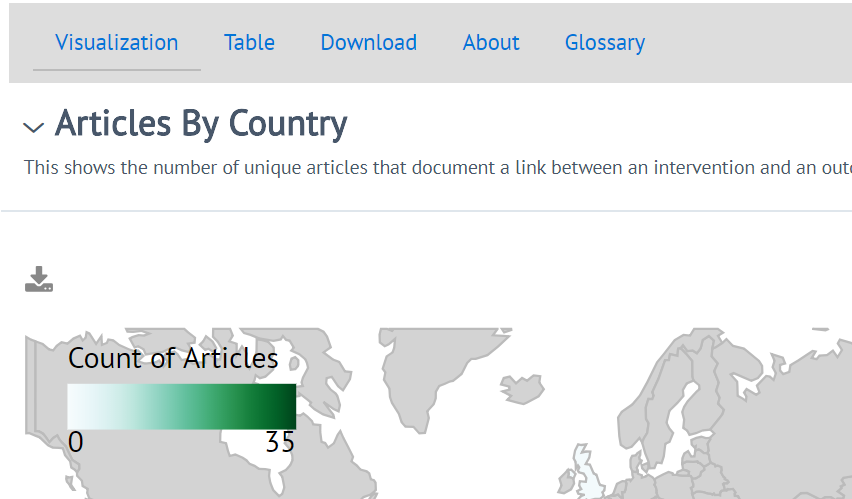
Could we add this somewhere on the visualizations page for each evidence map?
"This map illustrates the quantity of evidence existing for specific linkages and geographies, but does not illustrate direction of impact nor quality of evidence."
Trim map on visualizations to remove Antartica and Artic
Can we stretch the black background all the way across the window for the bottom banner?

Emilie cannot scroll to bottom for some reason?
Sorry, just noticed this - but the comparators in conservation/human well-being have lots of duplicates i think due to difference in syntax. How can i best facilitate that fix? Is it by fixing the original dataset and sending you that? If so, let me know which file and I can get on that ASAP
"Colours – switch around, so that the largest number is the darkest blue and the smallest number is yellow"
After talking to @scheng87, we agreed that reversing might confuse a user who is familiar with the normal order of viridis. We talked about another color scheme. Here are the options https://vega.github.io/vega/docs/schemes/#sequential-single-hue-schemes. @scheng87, please let me know which you think is best or ask Sofia/team. Thanks.
csv file format is much easier to produce than Excel and are fully supported by Excel, so for those that don't know csv add "Excel" to the csv download button
Two variables need to be removed from the outcome category in conservation/human well-being tab --> NA, env shouldn't be there! Apologies!
Remove NA caused by #7 in Intervention and order the filters in P-R-I-M-E.
@scheng87, also we will need content for

Fonts that were used for headers and dropdown menus was: Myriad Pro Condensed (e.g. About, Contact, Understand, Explore, Updates and content within, along with headers in text)
Body text was Helvetica Neue
Evidence for Nature and People Data Portal was Myriad Pro Regular
Can we set these?
@scheng87 What would you like to say in the download section? Should we use this space to describe the file formats instead or blend a discussion of formats with some text about proper usage and citation?

remembering that this is what the accepatance modal says

Did we decide on where this is going? in the About sections for each page?
Mechanism to easily update news and updates needed
Logic for NA is very deeply embedded into the design and data transforms. @scheng87, would it be possible to define NA in some other way and not change to "Unknown"?
@scheng87, please let me know what content you would like in the contact page

In the old version, we had http://natureandpeopleevidence.org/ebc-dataportal/.
row 55089 in map_data_final is blank. I can easily remove from the data, but since @scheng87 will most likely be the keeper of the data, I wanted to make sure this correction was passed through to the final source. For now, I will just remove from the json that I produce to feed the site.
I got this to work with vega but not vega-lite. Change spec to allow tooltip on axis label hover.
{
  "$schema": "https://vega.github.io/schema/vega/v3.0.json",
  "description": "A simple bar chart with embedded data.",
  "autosize": "pad",
  "padding": 5,
  "height": 200,
  "style": "cell",
  "data": [
    {
      "name": "source_0",
      "values": [
        {"a": "AAAAAAAAAAAAAAAAAAAAA", "b": 28},
        {"a": "B", "b": 55},
        {"a": "C", "b": 43},
        {"a": "D", "b": 91},
        {"a": "E", "b": 81},
        {"a": "F", "b": 53},
        {"a": "G", "b": 19},
        {"a": "H", "b": 87},
        {"a": "I", "b": 52}
      ]
    },
    {
      "name": "data_0",
      "source": "source_0",
      "transform": [
        {"type": "formula", "expr": "toNumber(datum[\"b\"])", "as": "b"},
        {
          "type": "filter",
          "expr": "datum[\"b\"] !== null && !isNaN(datum[\"b\"])"
        }
      ]
    }
  ],
  "signals": [
    {"name": "x_step", "value": 21},
    {
      "name": "width",
      "update": "bandspace(domain('x').length, 0.1, 0.05) * x_step"
    }
  ],
  "marks": [
    {
      "name": "marks",
      "type": "rect",
      "style": ["bar"],
      "from": {"data": "data_0"},
      "encode": {
        "update": {
          "fill": {"value": "#4c78a8"},
          "x": {"scale": "x", "field": "a"},
          "width": {"scale": "x", "band": true},
          "y": {"scale": "y", "field": "b"},
          "y2": {"scale": "y", "value": 0},
          "tooltip": {"field": "b", "type": "quantitative"}
        }
      }
    }
  ],
  "scales": [
    {
      "name": "x",
      "type": "band",
      "domain": {"data": "data_0", "field": "a", "sort": true},
      "range": {"step": {"signal": "x_step"}},
      "paddingInner": 0.1,
      "paddingOuter": 0.05
    },
    {
      "name": "y",
      "type": "linear",
      "domain": {"data": "data_0", "field": "b"},
      "range": [{"signal": "height"}, 0],
      "nice": true,
      "zero": true
    }
  ],
  "axes": [
    {
      "scale": "x",
      "orient": "bottom",
      "title": "a",
      "labelOverlap": true,
      "encode": {
        "labels": {
          "interactive": true,
          "update": {
            "angle": {"value": 270},
            "align": {"value": "right"},
            "baseline": {"value": "middle"},
            "tooltip": {"signal": "datum.label"}
          }
        }
      },
      "zindex": 1
    },
    {
      "scale": "y",
      "orient": "left",
      "title": "b",
      "labelOverlap": true,
      "tickCount": {"signal": "ceil(height/40)"},
      "zindex": 1
    },
    {
      "scale": "y",
      "orient": "left",
      "grid": true,
      "tickCount": {"signal": "ceil(height/40)"},
      "gridScale": "x",
      "domain": false,
      "labels": false,
      "maxExtent": 0,
      "minExtent": 0,
      "ticks": false,
      "zindex": 0
    }
  ],
  "config": {"axisX": {"labelLimit": 30}, "axisY": {"minExtent": 30}}
}
How easy would it be to eliminate an entire column from the data download? Realized that direction of outcome is still in there (I never removed it from the original dataset that feeds it) - is it better to remove it from the original data file or remove it from what is downloaded? It's columns called "Outcome.direction" and "Outcome.direction_notes"
Add at the bottom:
This work is supported by the World Bank’s Program for Forests (link: www.profor.info). Please contact Sofia Ahlroth ([email protected]) and Emilie Perge ([email protected]) for more information.
done in 9e0eb86
One on one between Sam and Kent to go over handover and walk through of code for future updates. Critical topics include:
could we add a box around the filters? Or a solid background to make it easier to see?
sort of like this:

If the map is zoomed, rotated, etc., changing filters will re-render the map and lose the transformation.
just noticed it says total number of articles is 222 but the number i have is 242? im trying to determine which is the last version of the datafile you have? i noticed some mistakes i made in the data and will need to fix - if i send new file (same columns, just adjusted data and added rows) will this cause any issues?
How much lift would be it to add text to each vis type? Is this something I can do?
E.g. For the countries --
"This shows the number of unique articles that document a link between an intervention and an outcome for each country studied."
For heatmap --
"This shows the number of unique articles that document specific intersections of an intervention and an outcome. Because articles can study more than one intervention or outcome type, articles may occur in more than linkage cell. Darker colors indicate greater volume of articles."
etc...
we need to add an about section for each explore by - link
options: add a tab to the row so it reads "visualization, table, download, about this evidence map"
For Conservation and Human Well-Being:
"This data was generated using a peer-reviewed systematic map protocol (Bottrill et al. 2014 (https://environmentalevidencejournal.biomedcentral.com/articles/10.1186/2047-2382-3-16)) and documented in McKinnon et al. 2016 (https://environmentalevidencejournal.biomedcentral.com/articles/10.1186/s13750-016-0058-7). This systematic map consists of articles that measure some impact of a nature-based conservation intervention (as defined by the IUCN-Conservation Measures Partnership (IUCN-CMP) Unified Classification of Conservation Actions) on aspects of human well-being. This map is limited to studies that examined these impacts in non-OECD countries.
For more information on specific inclusion and exclusion criteria and parameters of this search, please refer to the systematic map protocol in Environmental Evidence.
For metadata on data columns, please refer to the codebook from McKinnon et al. 2016."
For Forests and Poverty:
"This data was generated using a peer-reviewed systematic map protocol (Cheng et al. 2017 (https://environmentalevidencejournal.biomedcentral.com/articles/10.1186/s13750-016-0058-7). The completed systematic map article is currently in review. This systematic map consists of articles that measure links between forest-based productive activities categorized using the PRIME framework (Shyamsundar et al. 2017 https://www.profor.info/content/prime-pathways-toward-prosperity) on poverty alleviation. This map is global in scope.
For more information on specific inclusion and exclusion criteria and parameters of this search, please refer to the systematic map protocol in Environmental Evidence.
For metadata on data columns, please refer to the codebook from Cheng et al. 2016."
The panel with the filters on the left should be as long as the panel with map so you don’t have to scroll down when opening filter categories -- increase height using vh and add sticky top to filters 1cab6ba
The filters for interventions should be in the order of PRIME, with N/A last. N/A should also be last in all the sublists (under each PRIME category)
Need to explain what N/A includes - see #9
Habitat – maybe omit “terrestrial” as a heading, since it is all terrestrial? At least omit in the captions for tables
The map and filters are not aligned
@scheng87, what analytics would you like to add? If you own the Google Analytics account with the previous site, I am pretty sure we can port to the new site.
Add show all as option in data tables
@scheng87, will we buy a custom domain for this? I'll start working on a netlify deploy, and then we can add the custom domain easily.
A declarative, efficient, and flexible JavaScript library for building user interfaces.
🖖 Vue.js is a progressive, incrementally-adoptable JavaScript framework for building UI on the web.
TypeScript is a superset of JavaScript that compiles to clean JavaScript output.
An Open Source Machine Learning Framework for Everyone
The Web framework for perfectionists with deadlines.
A PHP framework for web artisans
Bring data to life with SVG, Canvas and HTML. 📊📈🎉
JavaScript (JS) is a lightweight interpreted programming language with first-class functions.
Some thing interesting about web. New door for the world.
A server is a program made to process requests and deliver data to clients.
Machine learning is a way of modeling and interpreting data that allows a piece of software to respond intelligently.
Some thing interesting about visualization, use data art
Some thing interesting about game, make everyone happy.
We are working to build community through open source technology. NB: members must have two-factor auth.
Open source projects and samples from Microsoft.
Google ❤️ Open Source for everyone.
Alibaba Open Source for everyone
Data-Driven Documents codes.
China tencent open source team.
