Bionexr: an R package for integrative network-based analysis of gene somatic mutation and gene expression data to identify cancer drivers
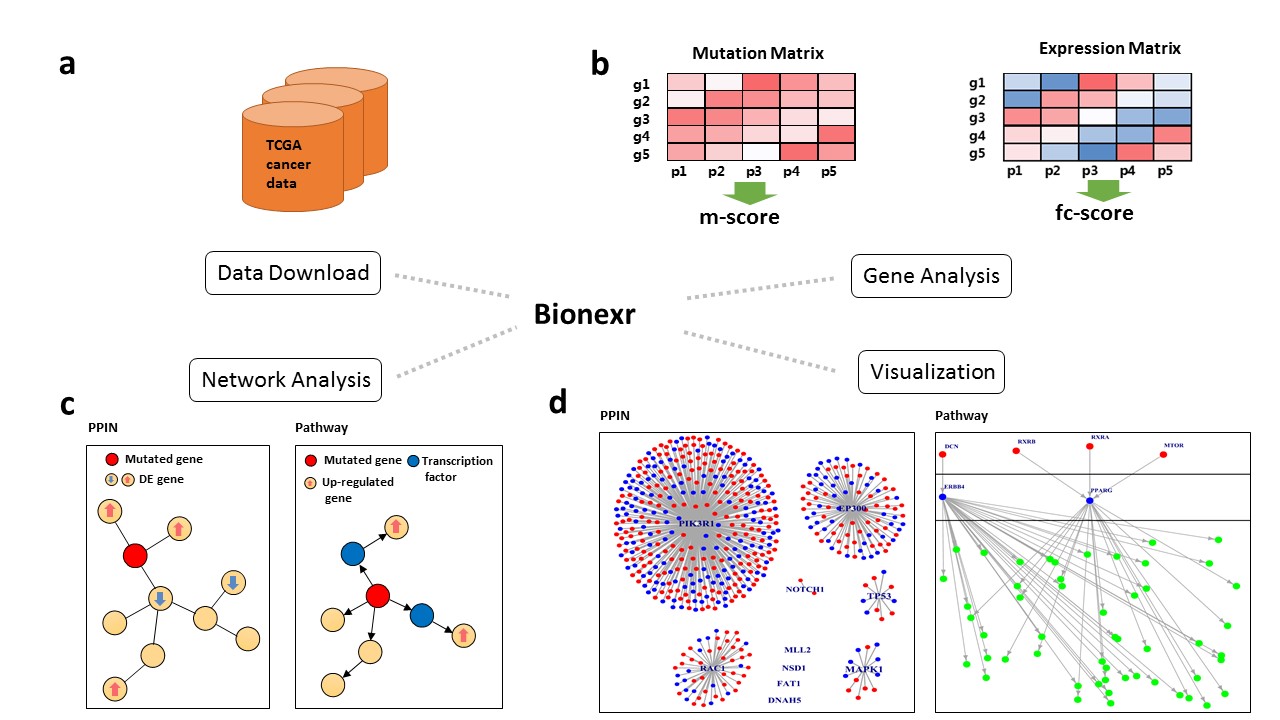
Cancer genome projects have generated massive genome and transcriptome sequencing data, which makes tumor-specific alterations such as somatic mutation and gene expression information easily available. To distinguish cancer drivers from passengers, we implement an R package “Bionexr” for integrative network-based analysis of gene somatic mutation and expression data. Bionexr provides these features:
- A protein-protein interaction (PPIN)-based approach
- A pathway-based appoach
- Visualization of the results
Bionexr is consisted of four main modules:
- Data Download
- Gene Analysis
- Network Analysis
- Visualization
Important: Read First
- PC with 8G RAM or above is recommended
- Passed test on Windows 8.1, Ubuntu 14.04, OS X 10.11.2
- Depends: R (>= 3.2.1)
- Suggests: doParallel, foreach, knitr
- Imports: RCurl, XML, reshape2, igraph, DESeq2
- VignetteBuilder: knitr
First, please install "DESeq2" package from BioConductor. To install "DESeq2", start R and enter:
source("https://bioconductor.org/biocLite.R")
biocLite("DESeq2")
Second, please install "devtools" package (see devtools github for more information). To install devtools from CRAN, please run:
install.packages("devtools")
Finnaly, follow the instructions below to download latest version of Bionexr:
devtools::install_github("ys-amms/bionexr", build_vignettes = TRUE)
Users can browse the vignette by running browseVignettes("bionexr")
-
First, run the following instructions. Note that if it is the first time to use Bionexr,
prepare_ma()will take some time to download the dataset used by gene module.library(bionexr) prepare_ma() -
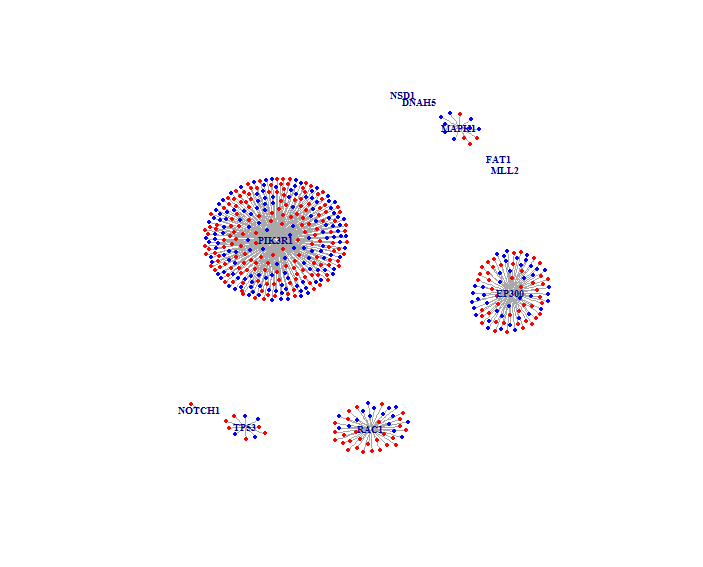
For PPIN-based approach, follow the instructions below:
  res.gene <- perform_gene_ppi(hnsc_mut_part, hnsc_exp_part)
  res.network <- perform_network_ppi(res.gene[[2]], res.gene[[3]])
  g <- network_from_ppi(res.network)
  plot_ppi(g)
And the result would look like below, note that your running result might have a different layout, that's OK. Mutated genes are labeled with their gene symbols, colored nodes denote differentially expressed genes, and edges represent neighbor relationship of protein-protein interaction network between genes.
-
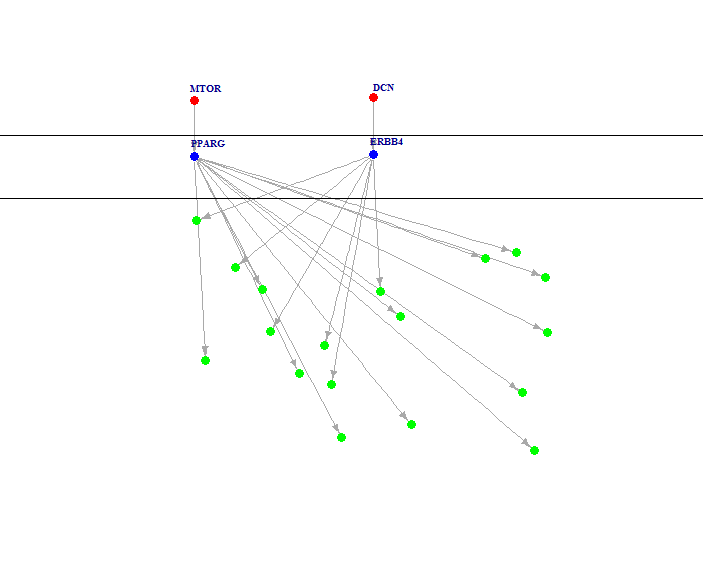
For pathway-based approach, follow the instructions below:
  res.gene <- perform_gene_pathway(hnsc_mut_part, hnsc_exp_part)
  res.network <- perform_network_pathway(res.gene[[2]], res.gene[[3]], hnsc_expressed_genes)
  g <- network_from_significant_branches(res.network)
  plot_pathway(g)
And the result would look like below, note that your running result might have a different layout, that's OK. The figure shows a hierarchical network, red nodes in top layer denote mutated genes, blue nodes in middle layer denote activated transcription factors, and green nodes in bottom layer denote up-regulated target genes.
firehose_get is the main command to download cancer genome data from firehose. Here we use firehose_get to download HNSC data.
mut_data <- firehose_get("HNSC", "mutation", run_date = "2015_08_21", run_type = "stddata")
mut_data <- mut_data[[1]]
mut_sample_ids <- unique(mut_data[[7]])
exp_data <- firehose_get("HNSC", "expression", run_date = "2015_08_21", run_type = "stddata")
exp_data <- exp_data[[1]]
exp_sample_ids <- colnames(exp_data)

common_case <- intersect(mut_sample_ids, exp_sample_ids)
exp_control <- grepl("-11$", exp_sample_ids)

hnsc_mut <- mut_data[mut_data[[7]] %in% common_case, ]
hnsc_exp <- exp_data[, (exp_sample_ids %in% common_case) | exp_control]
perform_gene_ppi and perform_gene_pathway are the two main commands for performing "Gene Analysis". As you can guess from the function name, perform_gene_ppi is for PPIN-based approach and perform_gene_pathway is for pathway-based approach.
See the instructions below, note that hnsc_mut and hnsc_exp are from "Data Download" module:
-
For PPIN-based approach
ppi.gene <- perform_gene_ppi(hnsc_mut, hnsc_exp) -
For pathway-based approach
pathway.gene <- perform_gene_pathway(hnsc_mut, hnsc_exp)
Note that before performing "Gene Analysis", run command prepare_ma() first. This module would take a few time to finish, drink some coffee happily.
perform_network_ppi and perform_network_pathway are the two main commands for performing "Network Analysis". As the same to "Gene Analysis" module, perform_network_ppi is for PPIN-based approach and perform_network_pathway is for pathway-based approach.
See the instructions below, note that hnsc_exp is from "Data Download" module, and ppi.gene and pathway.gene are from "Gene Analysis" module:
-
For PPIN-based approach
ppi.network <- perform_network_ppi(ppi.gene[[2]], ppi.gene[[3]]) -
For pathway-based approach
  expressed_genes <- identify_expressed_genes(hnsc_exp)
  pathway.network <- perform_network_pathway(pathway.gene[[2]], pathway.gene[[3]], expressed_genes)
plot_ppi and plot_pathway are the two main commands for performing "Visualization" module.plot_ppi is for PPIN-based approach's result and plot_pathway is for pathway-based approach's result.
See the instructions below, note that ppi.network and pathway.network are from "Network Analysis" module:
-
For PPIN-based approach's result
ppi.g <- network_from_ppi(ppi.network) plot_ppi(ppi.g) -
For pathway-based approach's result
  pathway.g <- network_from_significant_branches(pathway.network)
  plot_pathway(pathway.g)
The commands perform_main_ppi and perform_main_pathway can perform "Gene Analysis" and "Network Analysis", and the result can be visualized straightforward.
The example instructions are written below, note that hnsc_mut and hnsc_exp are from "Data Download" module:
-
For PPIN-based approach
prepare_ma() ppi.res <- perform_main_ppi(hnsc_mut, hnsc_exp, jobname = "HNSC", use_cache = TRUE) ppi.g <- network_from_ppi(ppi.res) plot_ppi(ppi.g) -
For pathway-based approach
  prepare_ma()
  pathway.res <- perform_main_pathway(hnsc_mut, hnsc_exp, jobname = "HNSC", test = TRUE)
  pathway.g <- network_from_significant_branches(pathway.res)
  plot_pathway(pathway.g)
Please send email to [email protected] if you have any questions.


