VS Code assembly and C language debugger for the 65C02 and 65816 microprocessors.
- Runs a program from reset vector, optionally stopping on entry
- Supports multi-file programs
- Can set launch arguments for program
- Follow along with execution directly in assembly and C source files
- Control program execution with continue/pause, single step, step-into, step-over, step-out and run-to-cursor
- Five types of breakpoints:
- Source: set directly in assembly and C source files; stops execution when that line is reached
- Function: set on function name or memory address; stops execution when the first address in the function or memory address is reached during program execution
- Data: set on
X,Y,K,BandDregister; stops execution when a write access to these registers is made - Instruction mnemonic or opcode (opcode allows a break even if there is no supporting source code)
- Logpoints: don't break when hit, but print a text message to the debug console. Can include expressions to be evaluated within curly braces,
{}.
- Set break condition and/or hit count on source and function breakpoints and logpoints
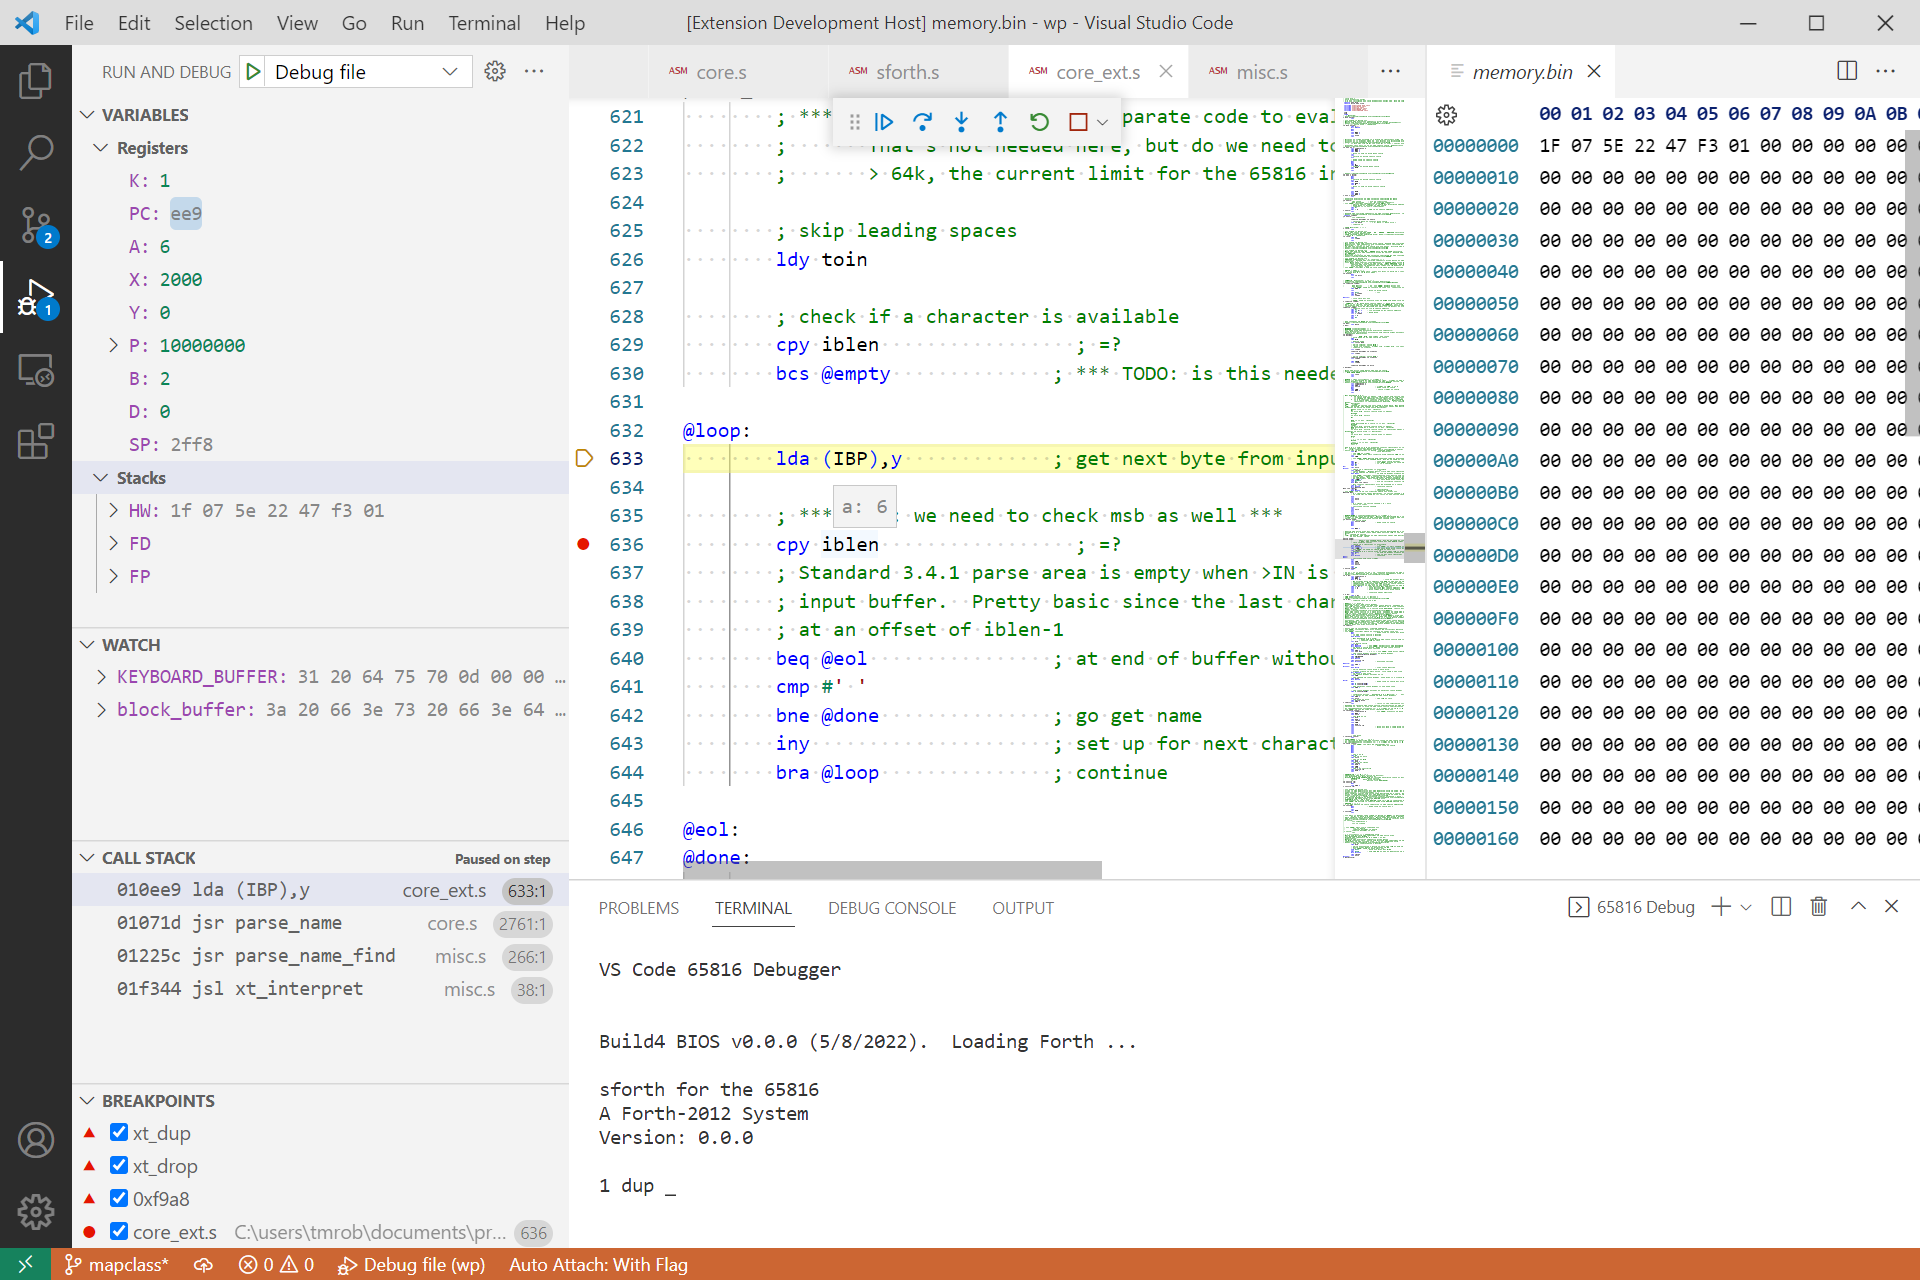
- Registers, hardware stack and local variables in C functions are displayed in the
Variablessection and can be modified when program is paused - Inspect symbols, memory ranges and expressions in the
Watchsection. Set the value of symbols and memory ranges when the program is paused. - Variable/watch changes highlighted after each step and on execution pause
- Drill down on variables/watches that represent a memory range (variable ranges can be opened in a separate hex editor window allowing modification of the memory range)
- Evaluate symbols, memory ranges and expressions and set symbol and memory range values in the Debug Console
- Symbol address and value displayed when hovering over a symbol in source code
- Call stack displayed when stepping through program. Clicking on an entry opens the source code in an editor at that line.
- Integrated terminal window for input/output with default read/write addresses at
$f004and$f001respectively. - Source files listed in Loaded Scripts Explorer
db65xx is a VS Code extension (under development) that simulates Western Design Center's 65C02 and 65C816 microprocessors. The extension implements Microsoft's Debug Adapter Protocol to communicate with the VS Code debugging frontend and translates UI commands to control an execution engine simulating the selected processor. The execution engine "runs" a binary file of the assembled code and can be used independently of the debugging extension.
The extension monitors the execution engine activity and translates its state into various elements to be displayed in the VS Code UI. To do so, it uses various debug files produced during source code assembly and compilation. The extension works with cc65 files to produce an address map between the assembly and C source files and the assembled binary. If not otherwise specified it assumes file extensions as follows:
- binary:
.bin - debug:
.dbg - listing:
.lst - map:
.map - symbol:
.sym - C source:
.c - assembly source:
same as debugged file, as referenced in debug file or '.s' otherwise
See the cc65 documentation on how to produce these files. It shouldn't be difficult to modify the extension to create a mapping for other extensions or 65xx assemblers.
Class DA65xx in the da65xx.ts module, implements Microsoft's Debug Adapter Protocol (DAP) to interface between the VS Code debugging UI and an execution engine. The debug adapter performs all other aspects of debugging from maintaining the current program location in a source file to examining simulated memory, providing the UI with symbol and expression values. The debug adapter also maintains information on all breakpoints and provides a method that the execution engine calls each step to check if a breakpoint has been hit.
Class EE65xx, in the ee65xx.ts module, is a 65xx execution engine with limited debugging support. It "executes" a 65xx binary instruction by instruction in "steps" and sends messages to the debug adapter informing it of certain events. The debug adapter "follows along" with a source file, simulating "running" through the source code line-by-line. It does this by preparing a mapping of the source code line to binary address using information from the debug files provided.
EE65xx exposes several methods allowing the debug adapter to control the simulation. EE65xx supports typical stepping functionality as the core of its "debugging support", but relies exclusively on the debug adapter for other debugging activities, such as maintaining breakpoints and responding to variable requests. To check if a breakpoint has been hit for example, the execution engine checks with the debug adapter each step. EE65xx is completely independent from VS Code and the Debug Adapter and can be run as a standalone simulator without debugging. It can also be run within VS Code without debugging.
The execution engine cores are Typescript ports of the cores from my py65816 Python simulator package. The Python versions have been tested with unit tests covering about 98% of the code (see the link for limitations). Similar tests have not been made on the Typescript cores. The 65816 core has successfully passed a significant set of higher-level functional tests. The 65C02 core has successfully passed functional tests (see link for status and limitations). It has also successfully run my Forth-based operating system, but I haven't extensively tested it. A 6502 core is also available but except that it forms a large part of the 65C02 has only be tested on a modified hello world program. I don't plan on porting the Python unit tests as its code base is significantly larger than just the cores alone. As always, use at your own risk.
These cores are based on Mike Naberezny's py65, a great 65C02 simulator. Check out ThirdPartyNotices for its license and those of others whose work made this VS Code extension possible.
The db65xx VS Code extension is available in the Visual Studio Marketplace and is the easiest way to add the extension to your system. If you'd like to see how the extension works or modify it, clone this repository and open it in VS Code. Open a terminal and type install npm. You should be then be ready to run the hello world example. To use the extension with your own files, add a default launch configuration with the Run - Add Configuration... menu item.
I've included a very simple "hello world" example project in the wp folder of my repository. To run it with the marketplace extension, copy the wp folder to your system, open it in VS Code, open hello_world.s and press F5. The program should pause at the start of the reset subroutine.
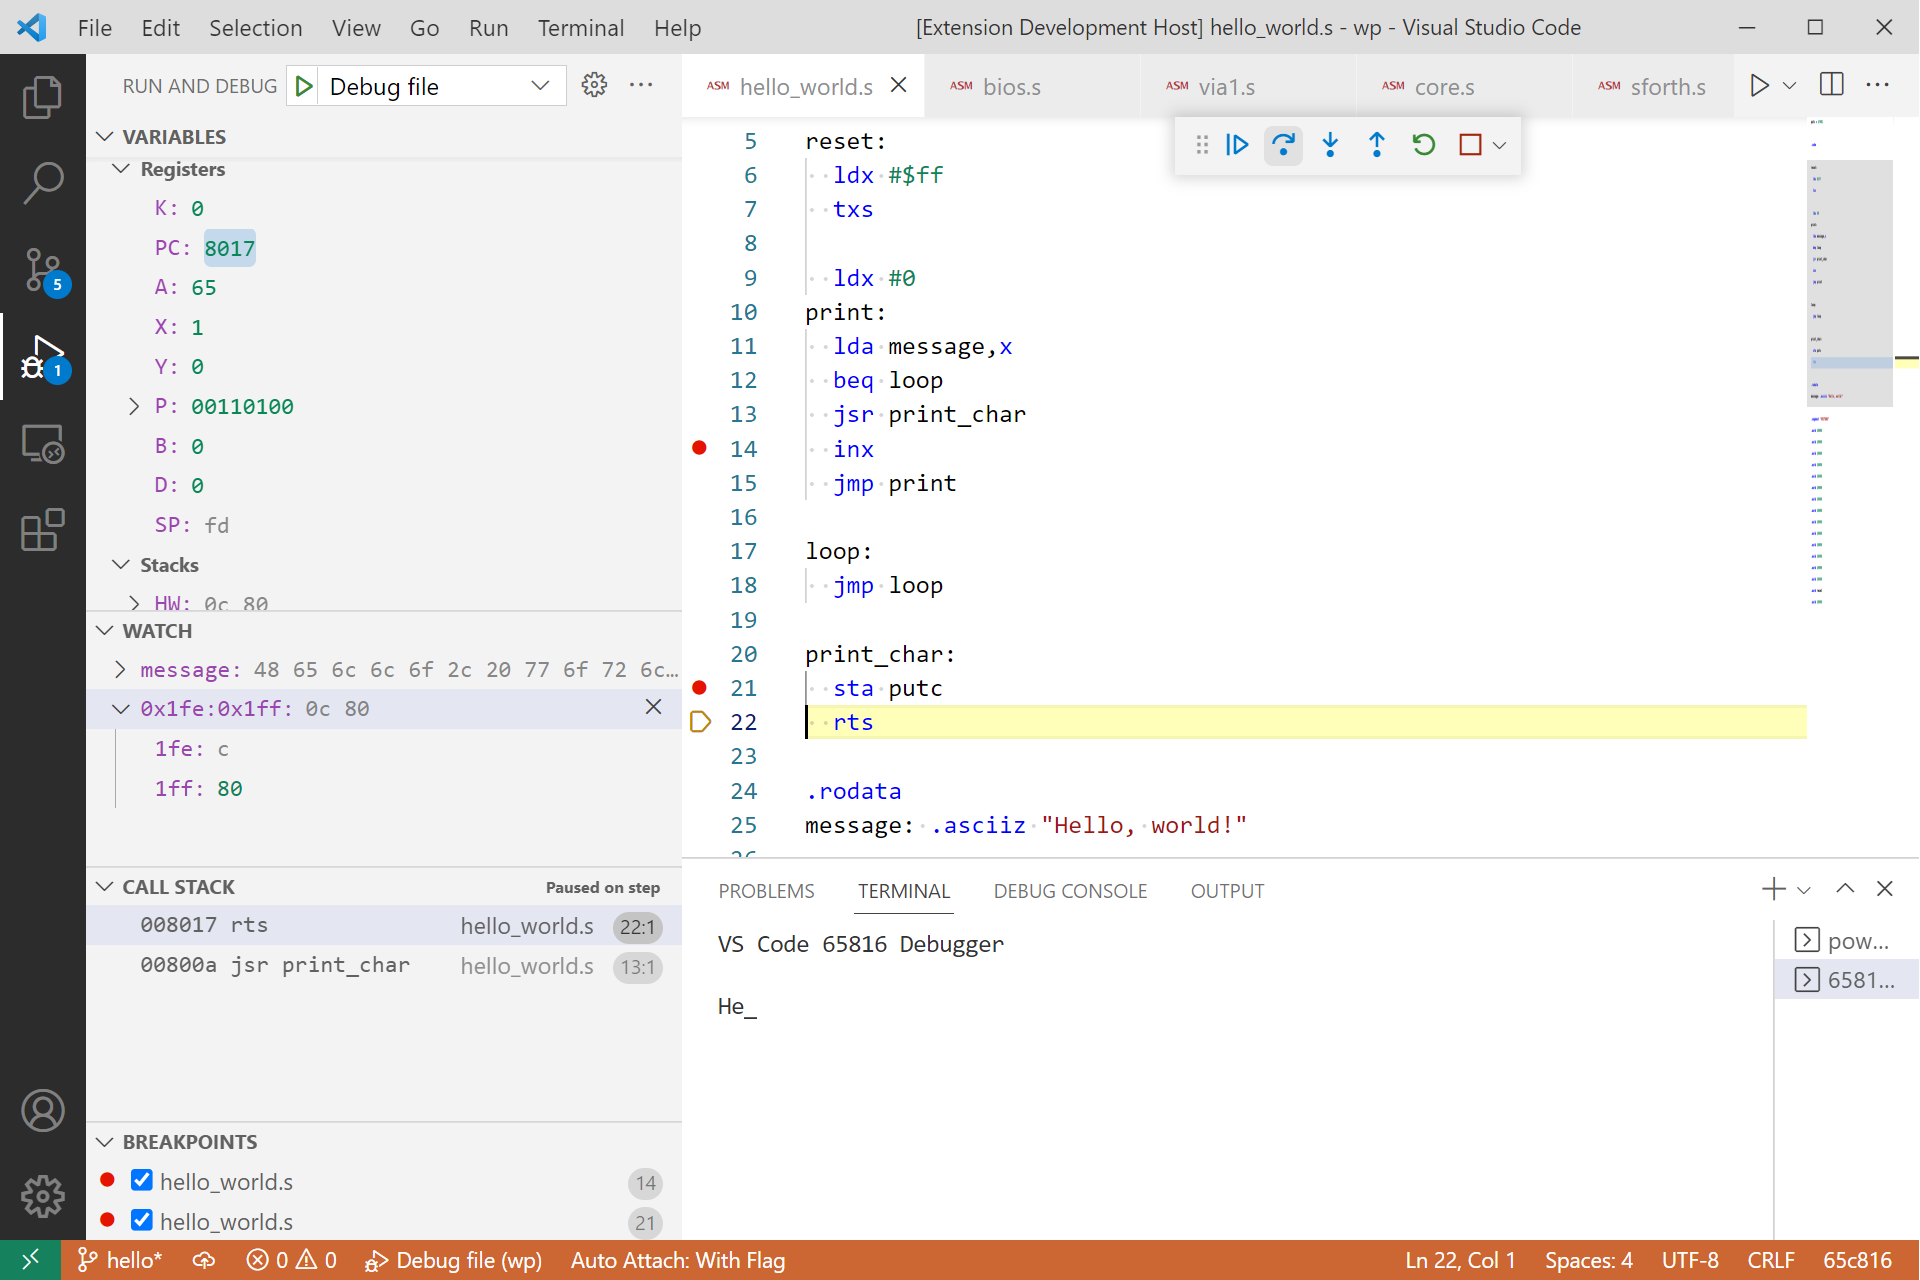
The "hello world" example includes a 256-character circular input buffer showing one way to process input from the integrated terminal.
To run the "hello world" example from a cloned repository, open the debug adapter extension project in VS Code and press F5 to start debugging the extension. VS Code will open a new window where you can run the hello world example. Open hello_world.s, make sure "Debug File" is selected in the VS Code Run and Debug view and press F5.
Check out my db65xx Projects repository for more example projects to try out with the db65xx debugging extension.
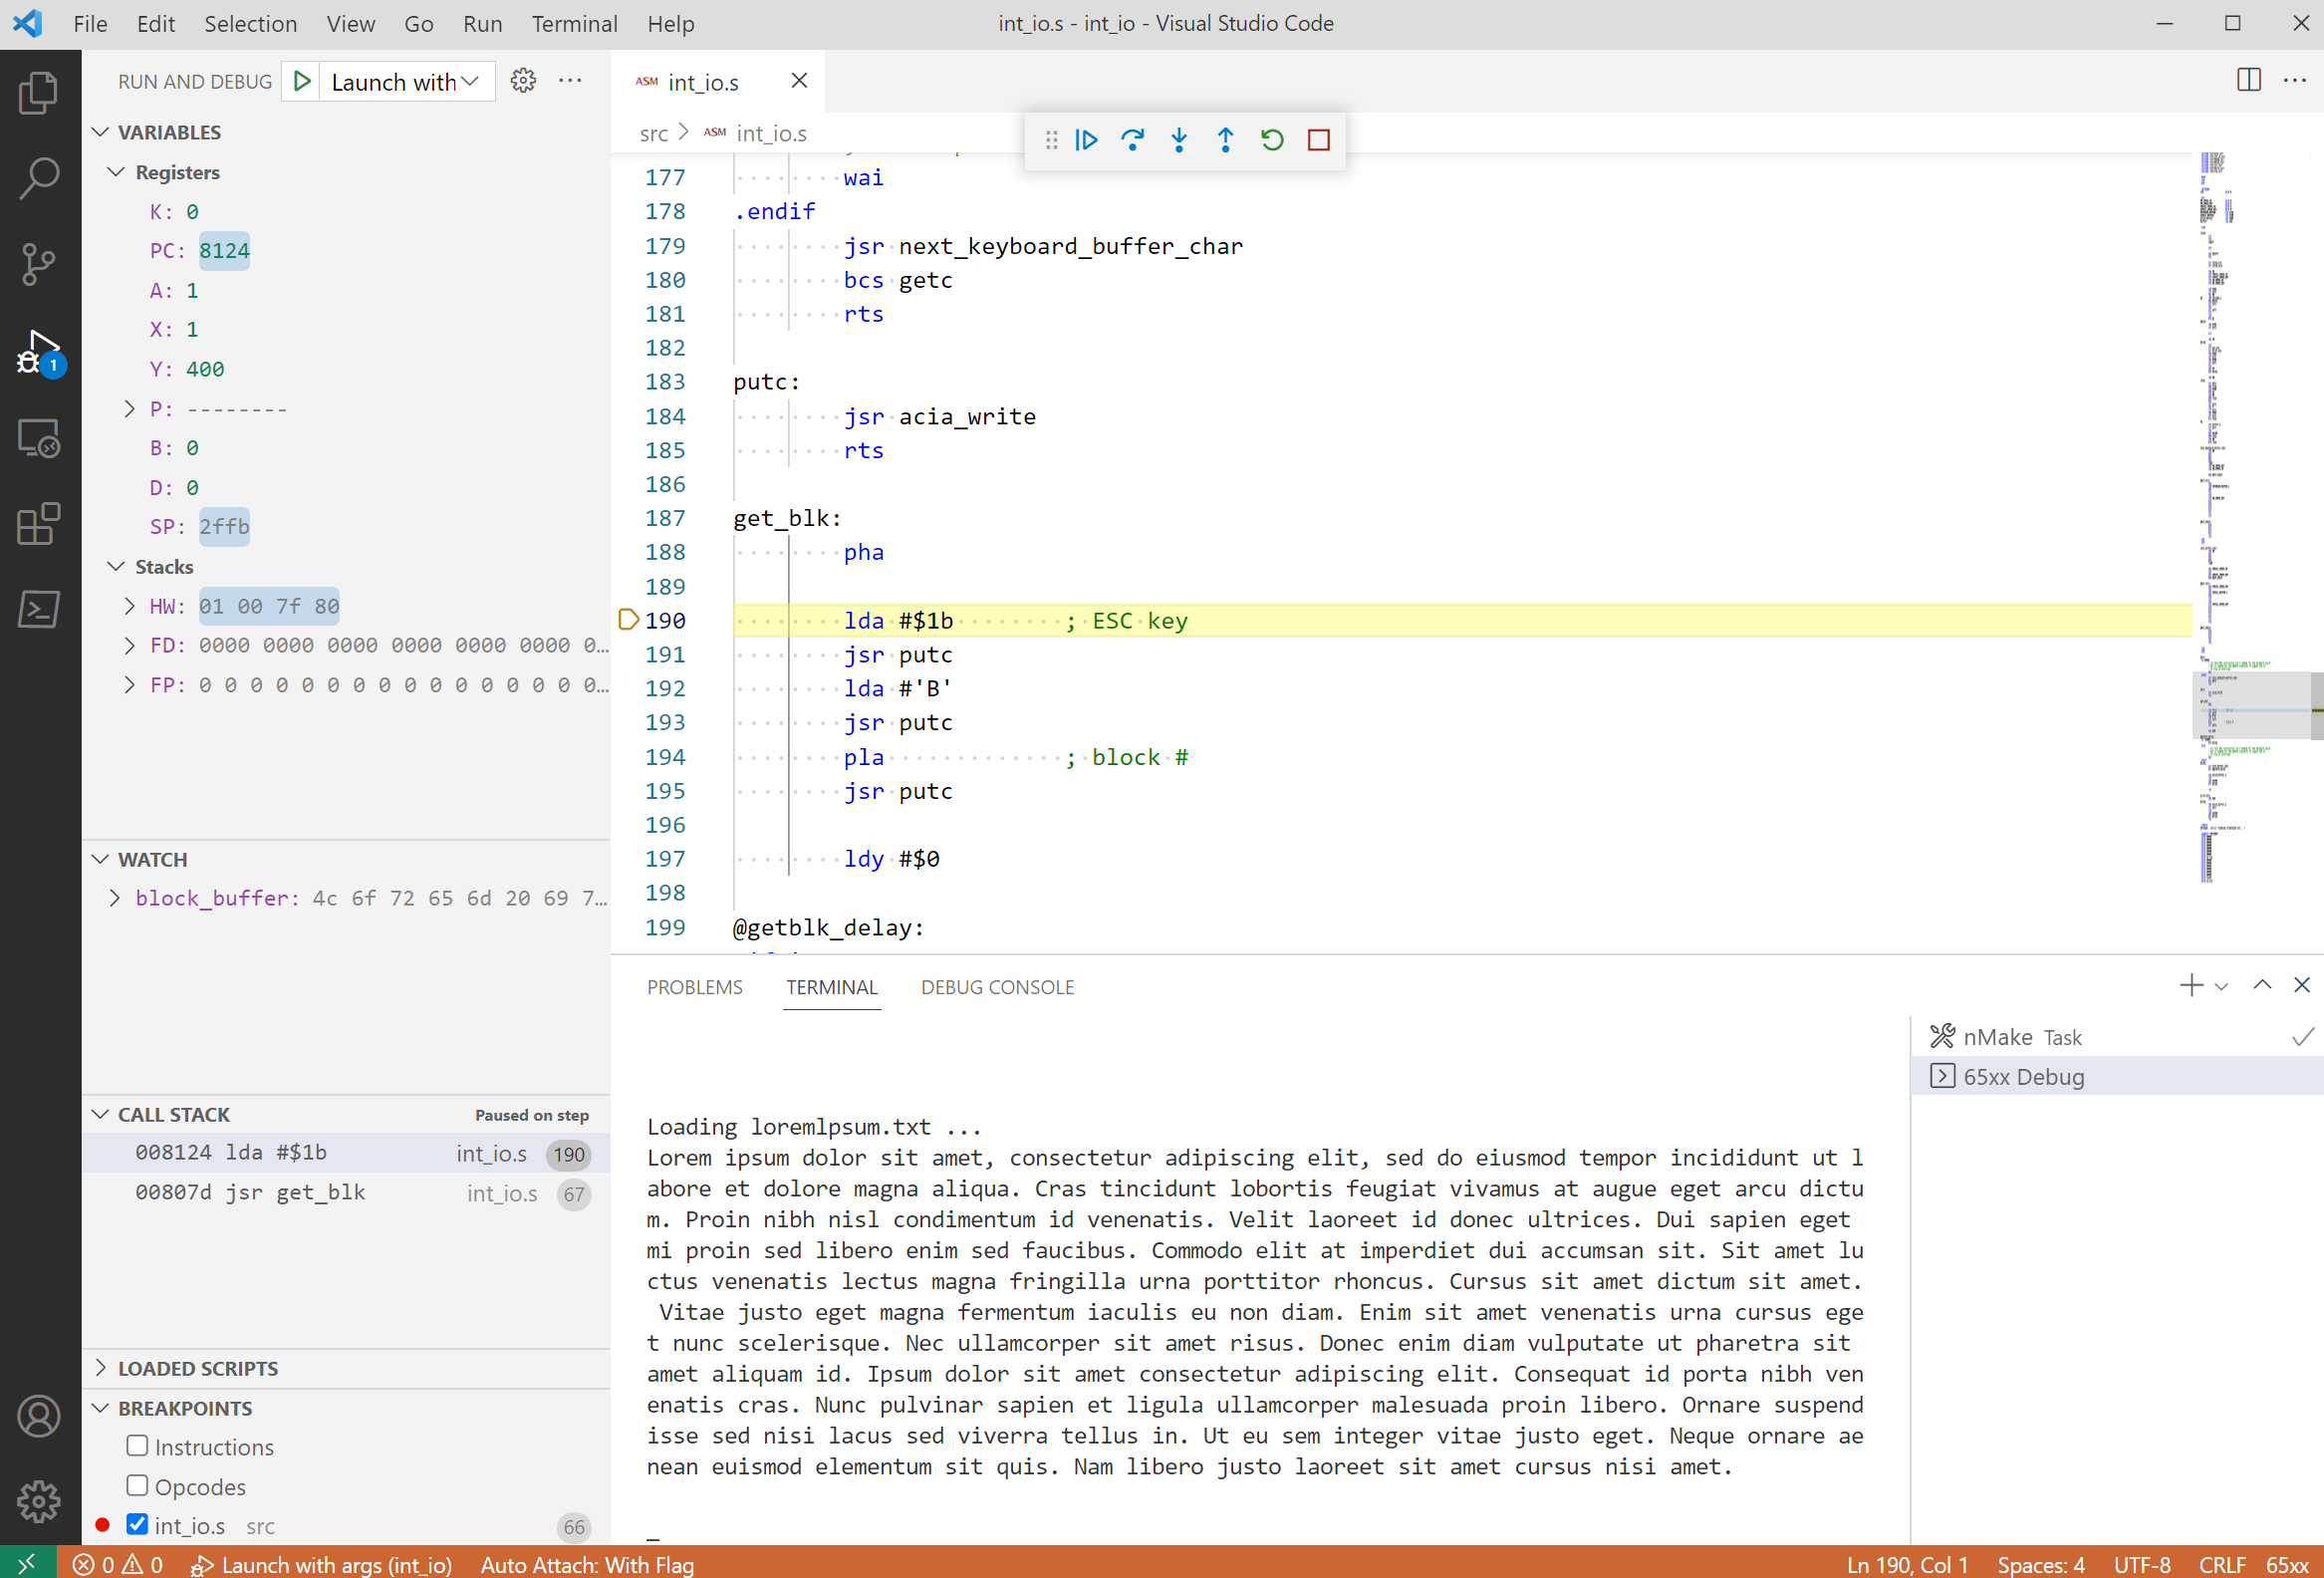
Example of interrupt driven I/O. Uses the 65C22 shift register for keyboard input and the 65C51 for terminal output and file input.
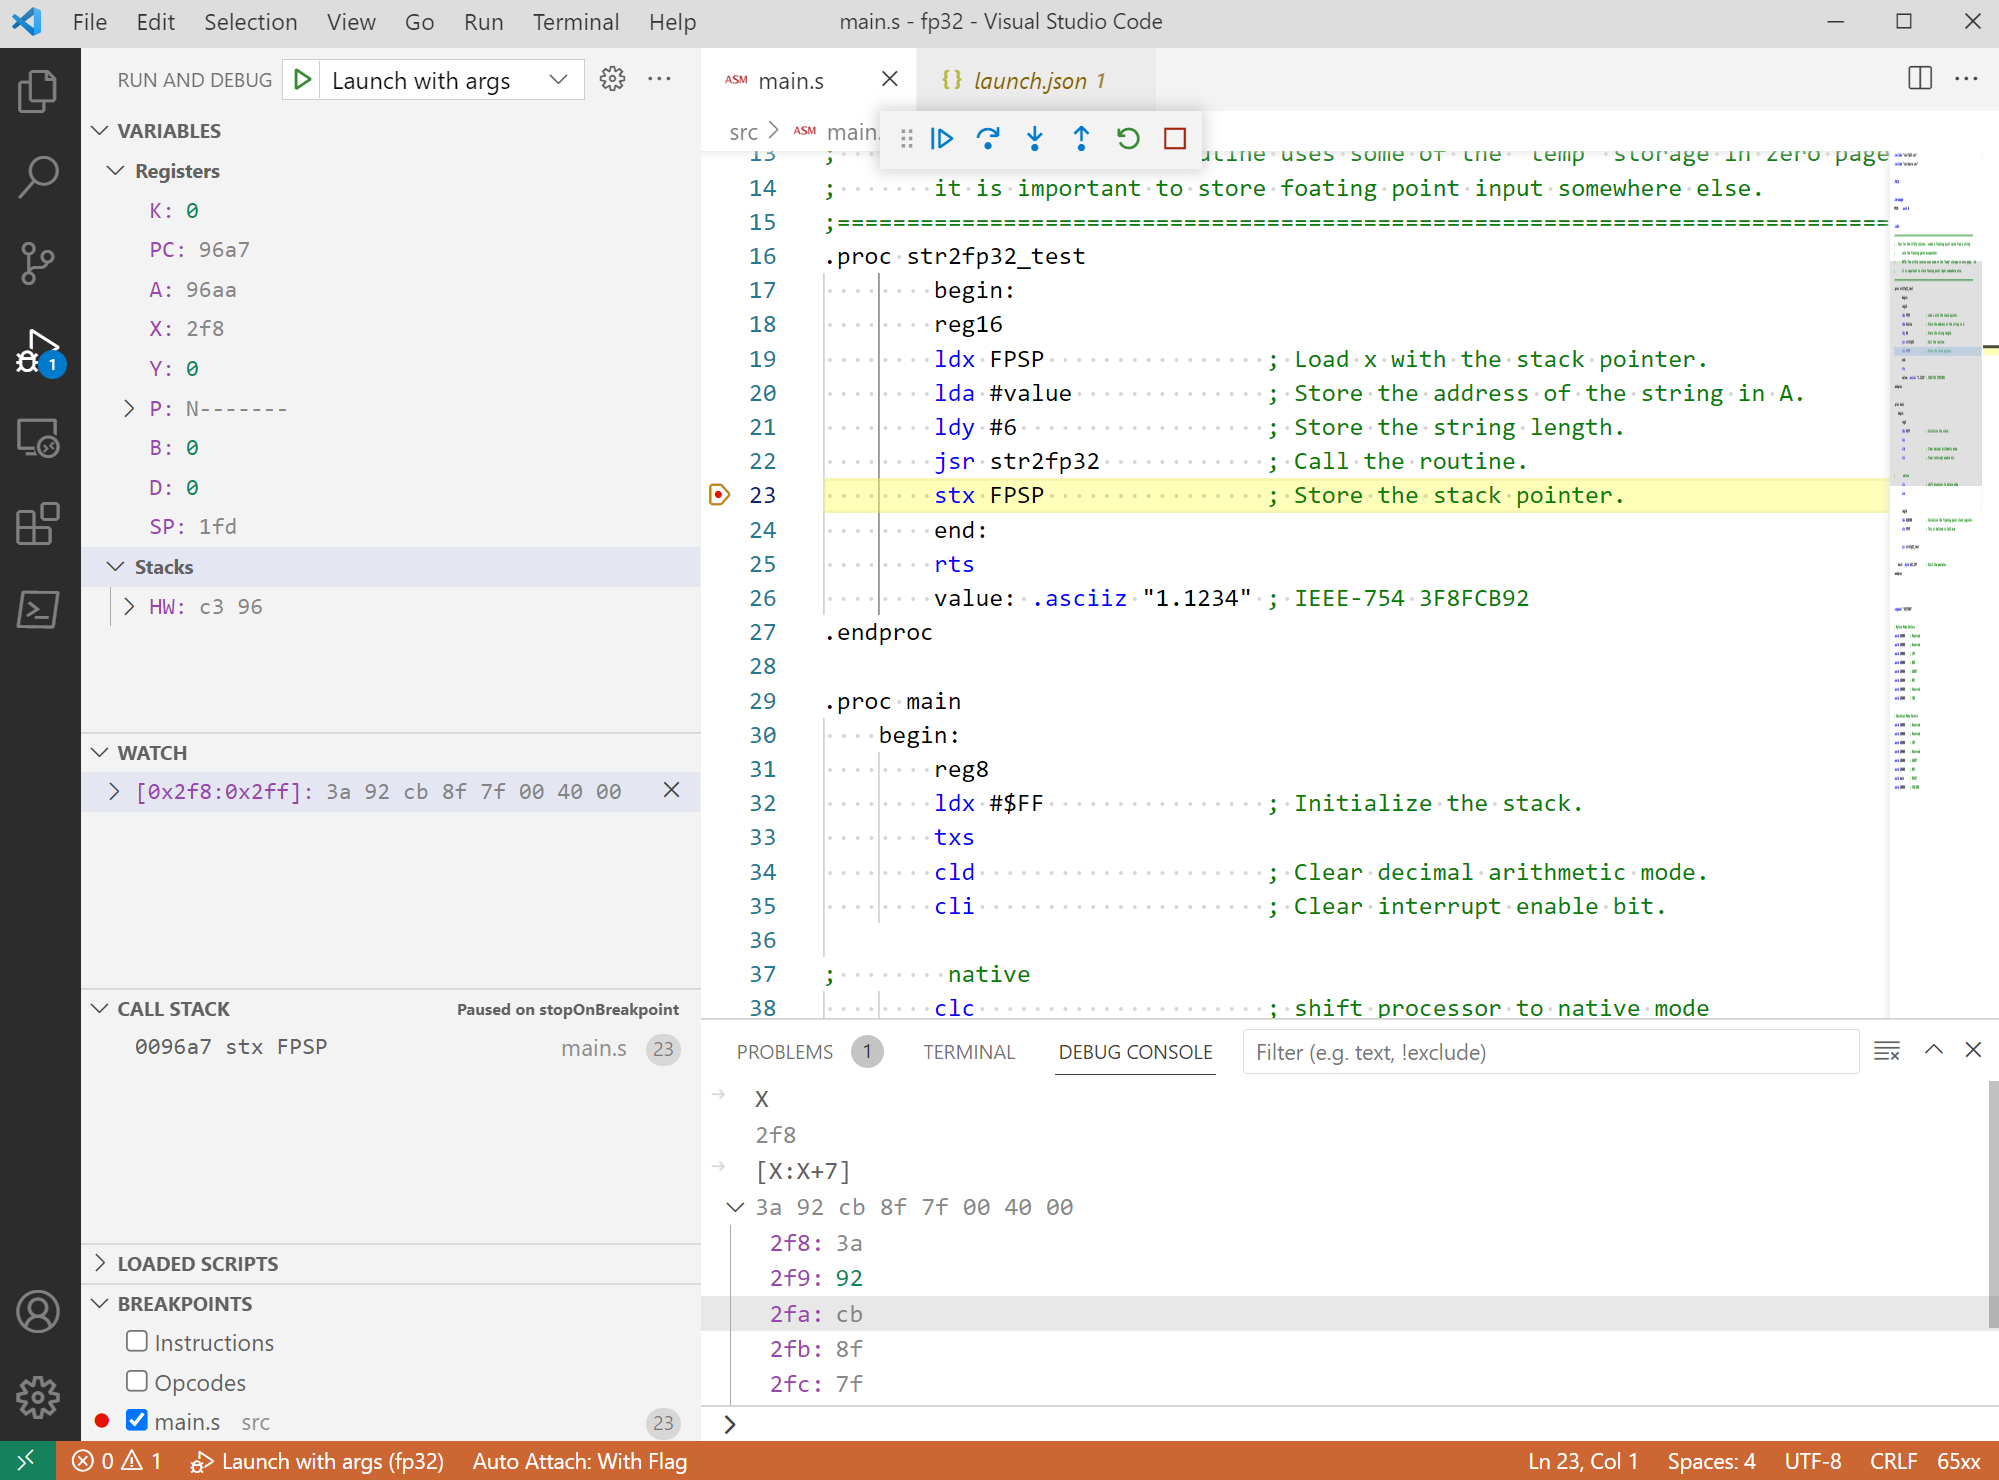
Example of using the 32-bit floating point package.
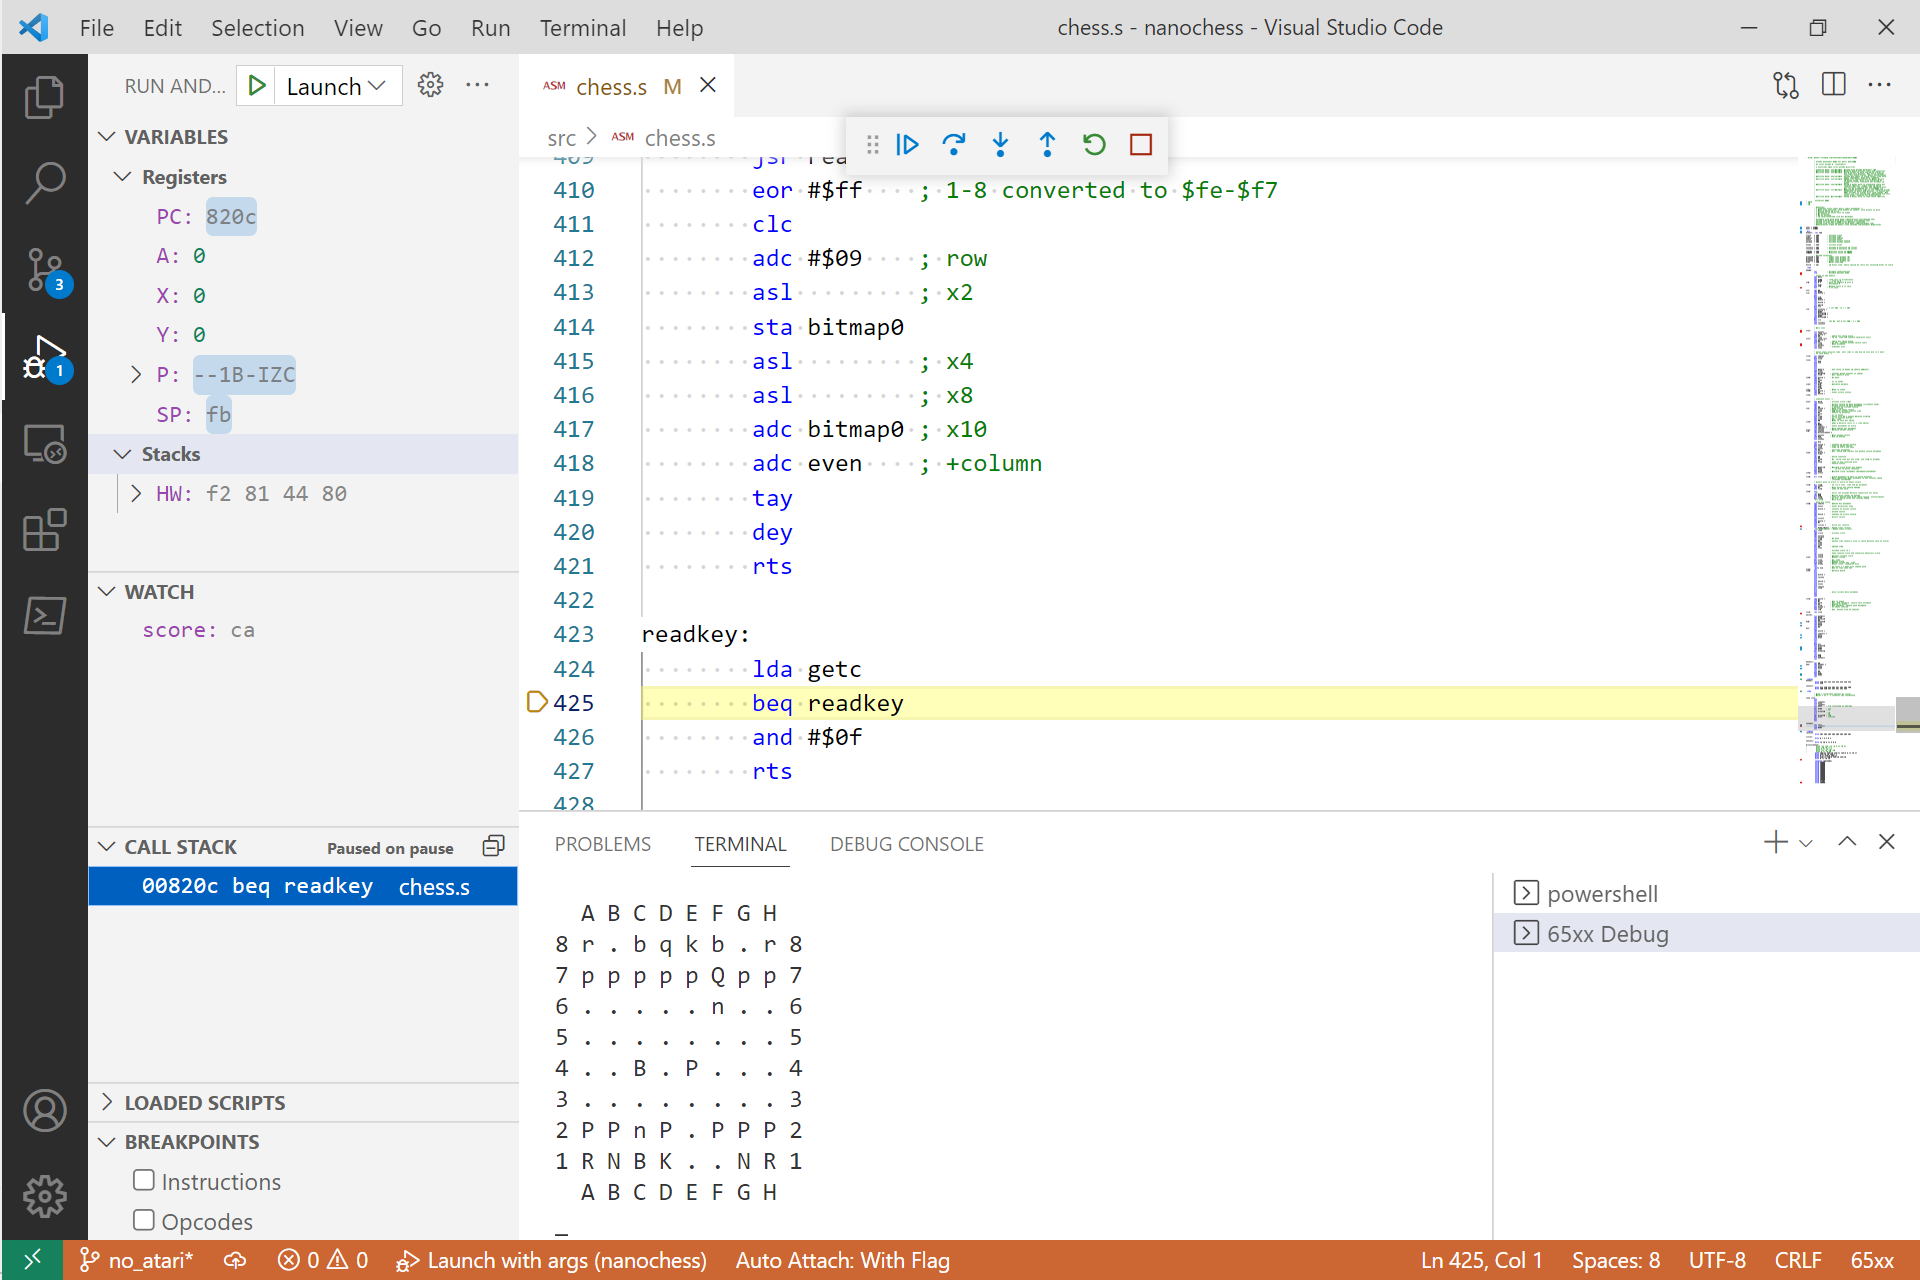
Playing chess with Toledo Atomchess 6502.
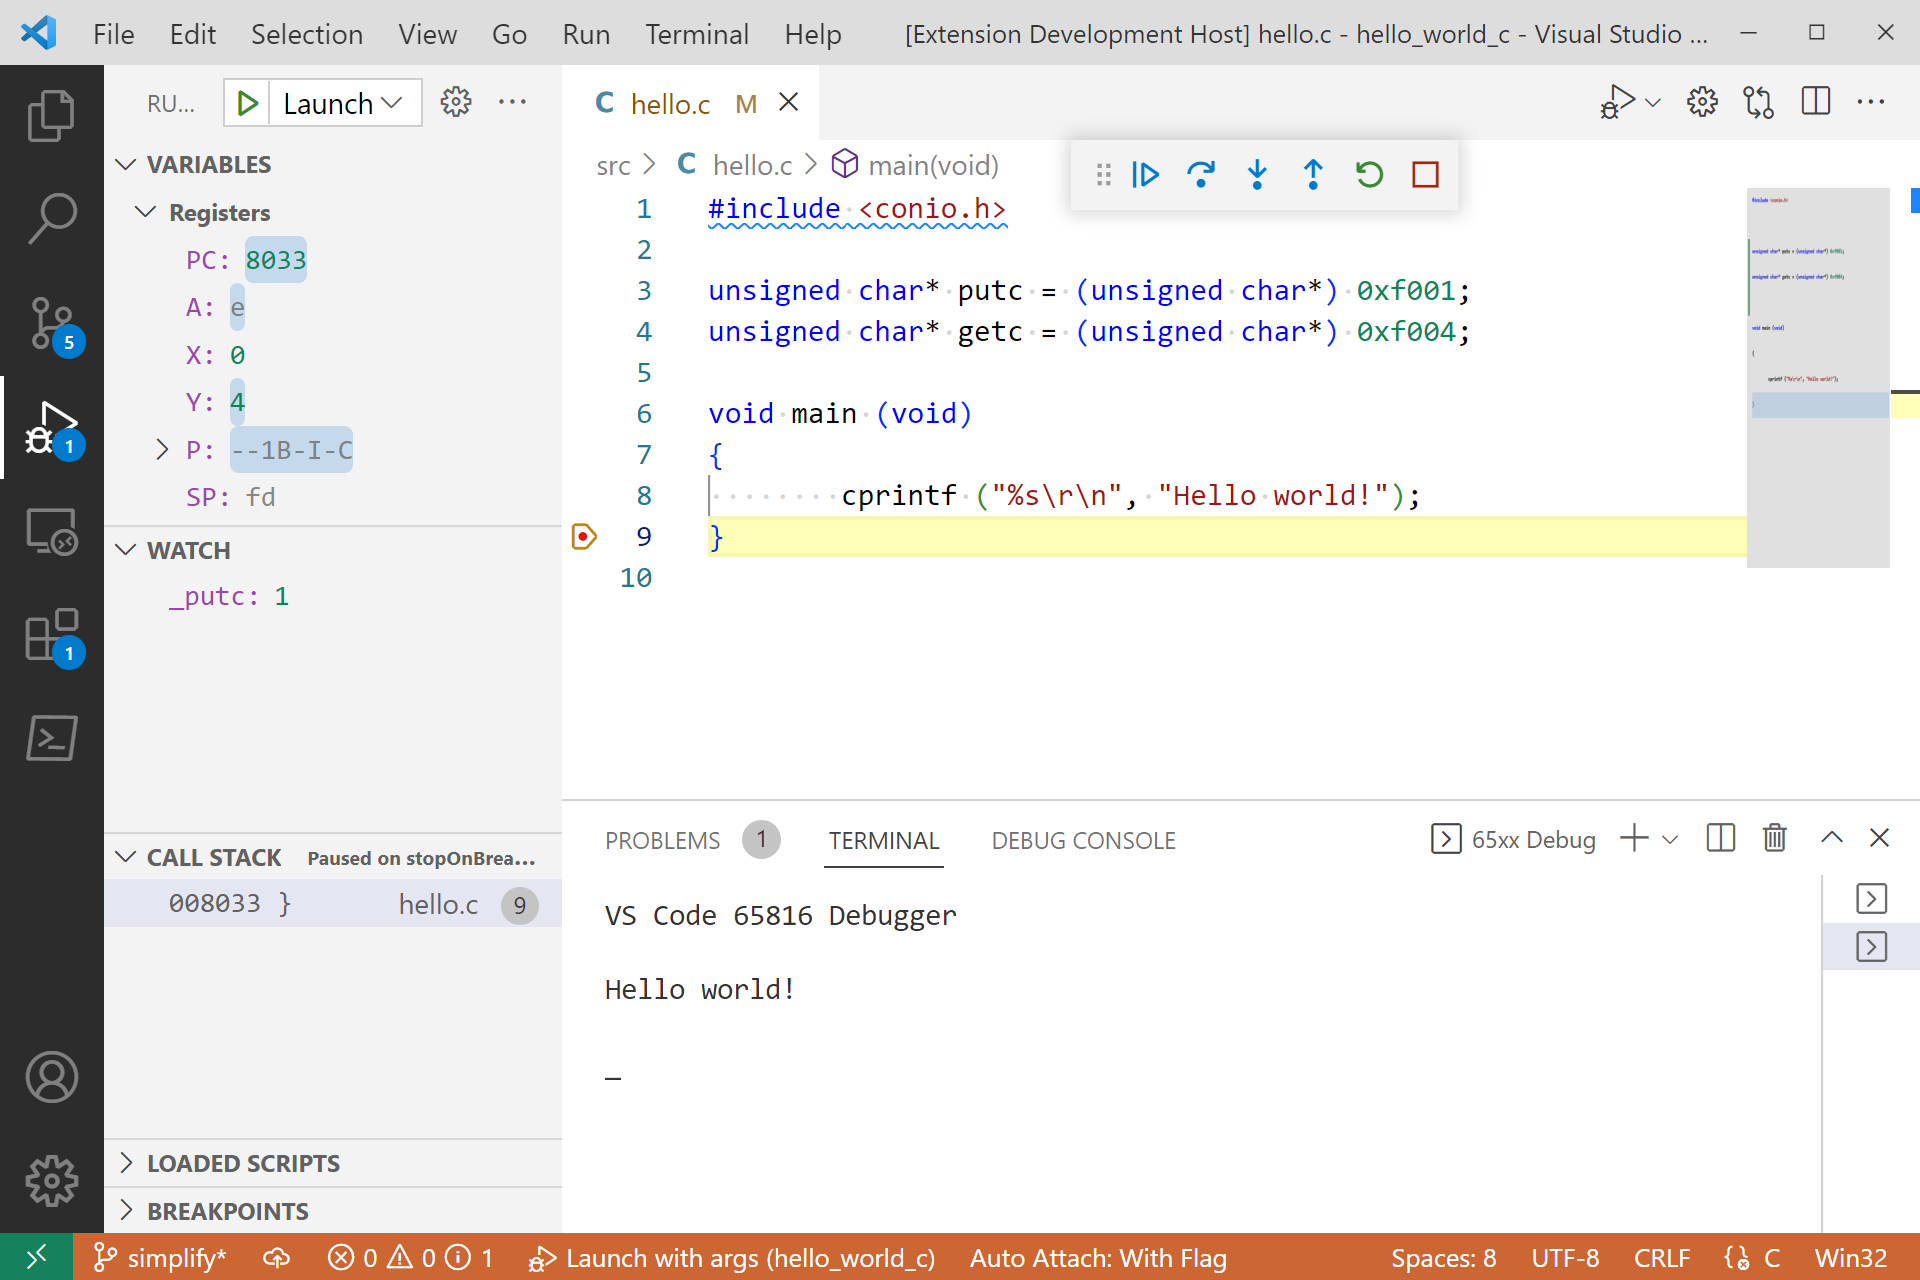
Example of C-based debugging with Hello World.
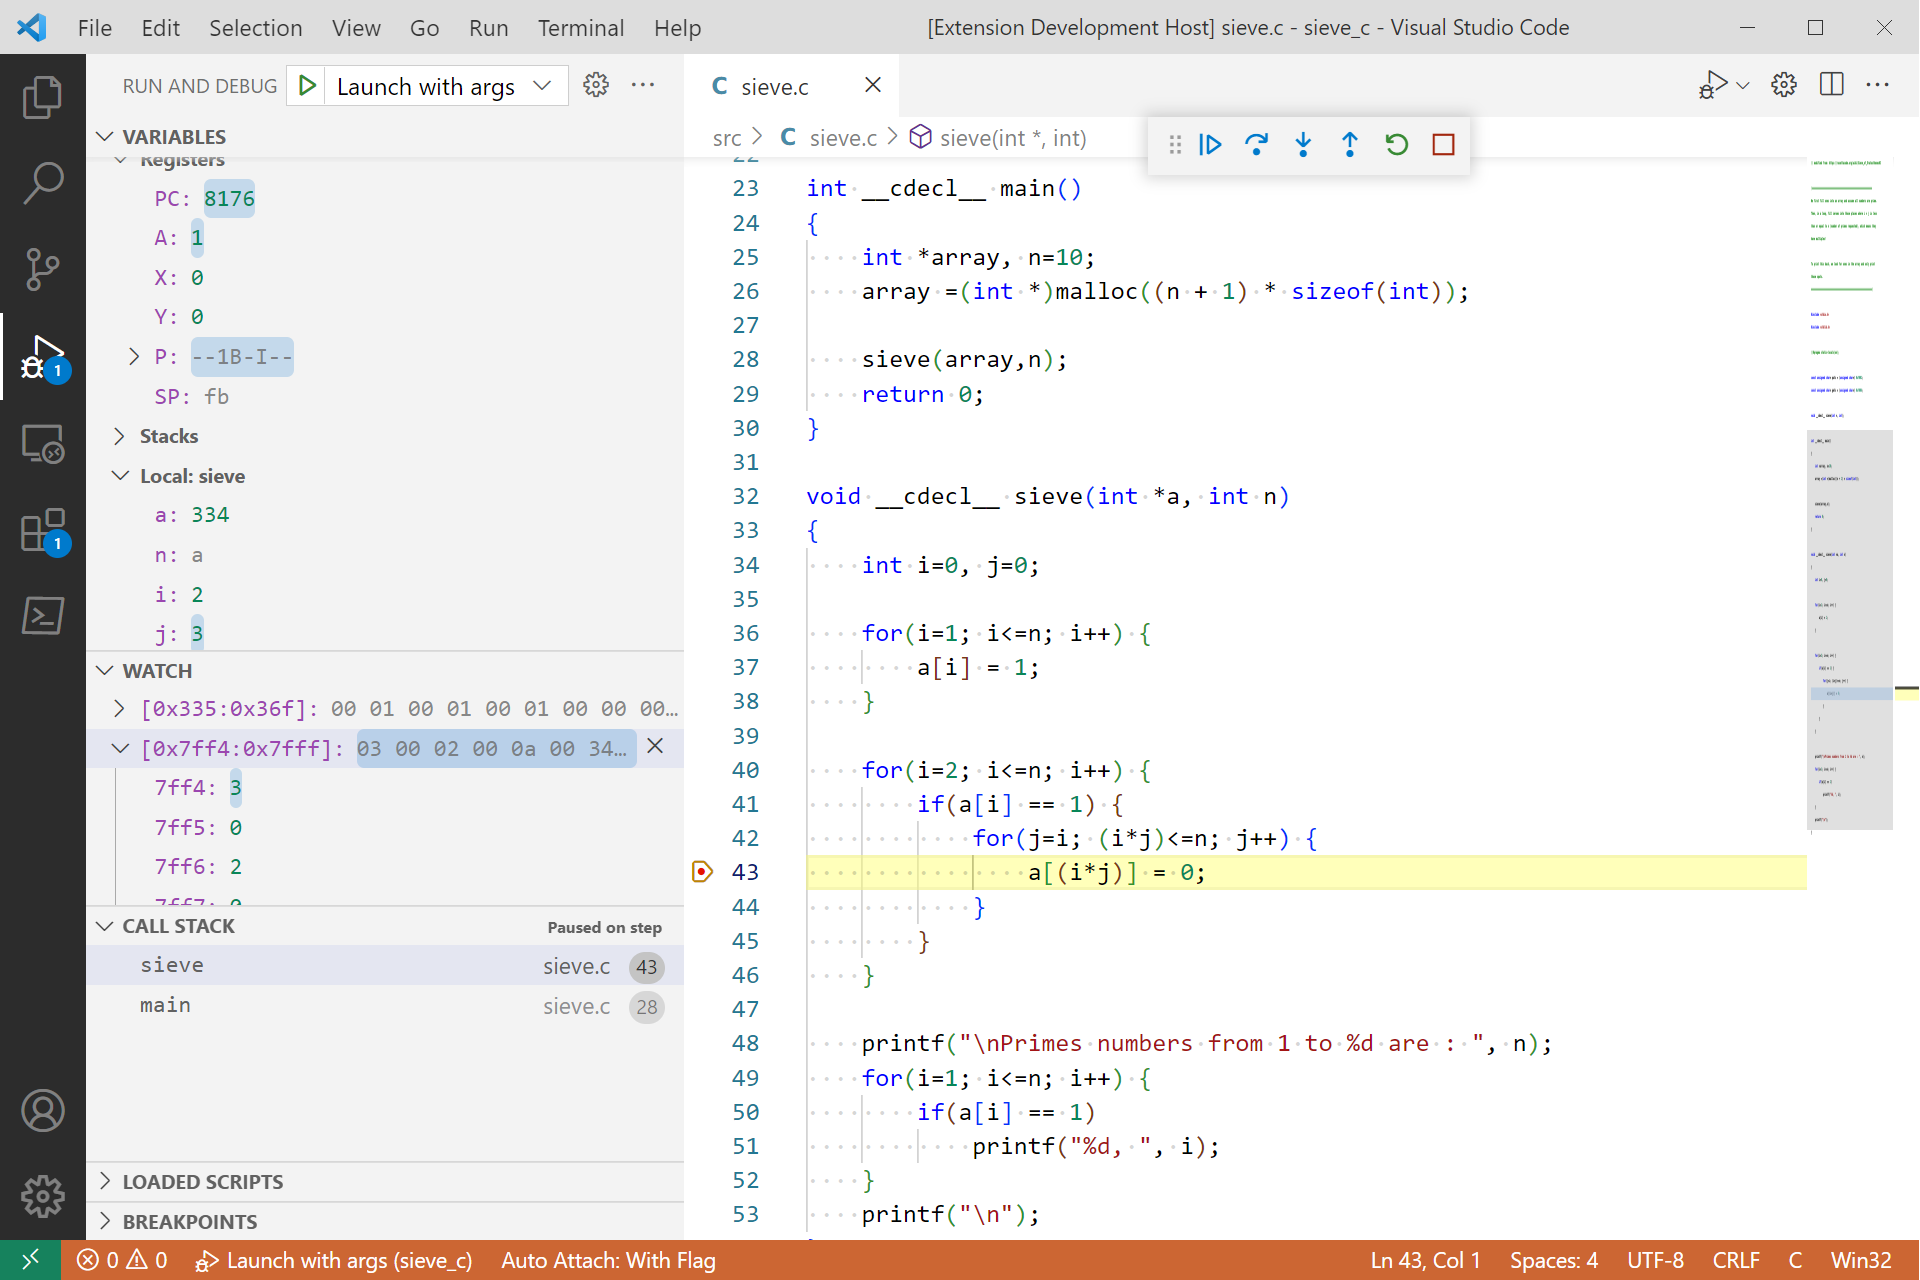
Example of C-based debugging with Sieve of Eratosthenes.
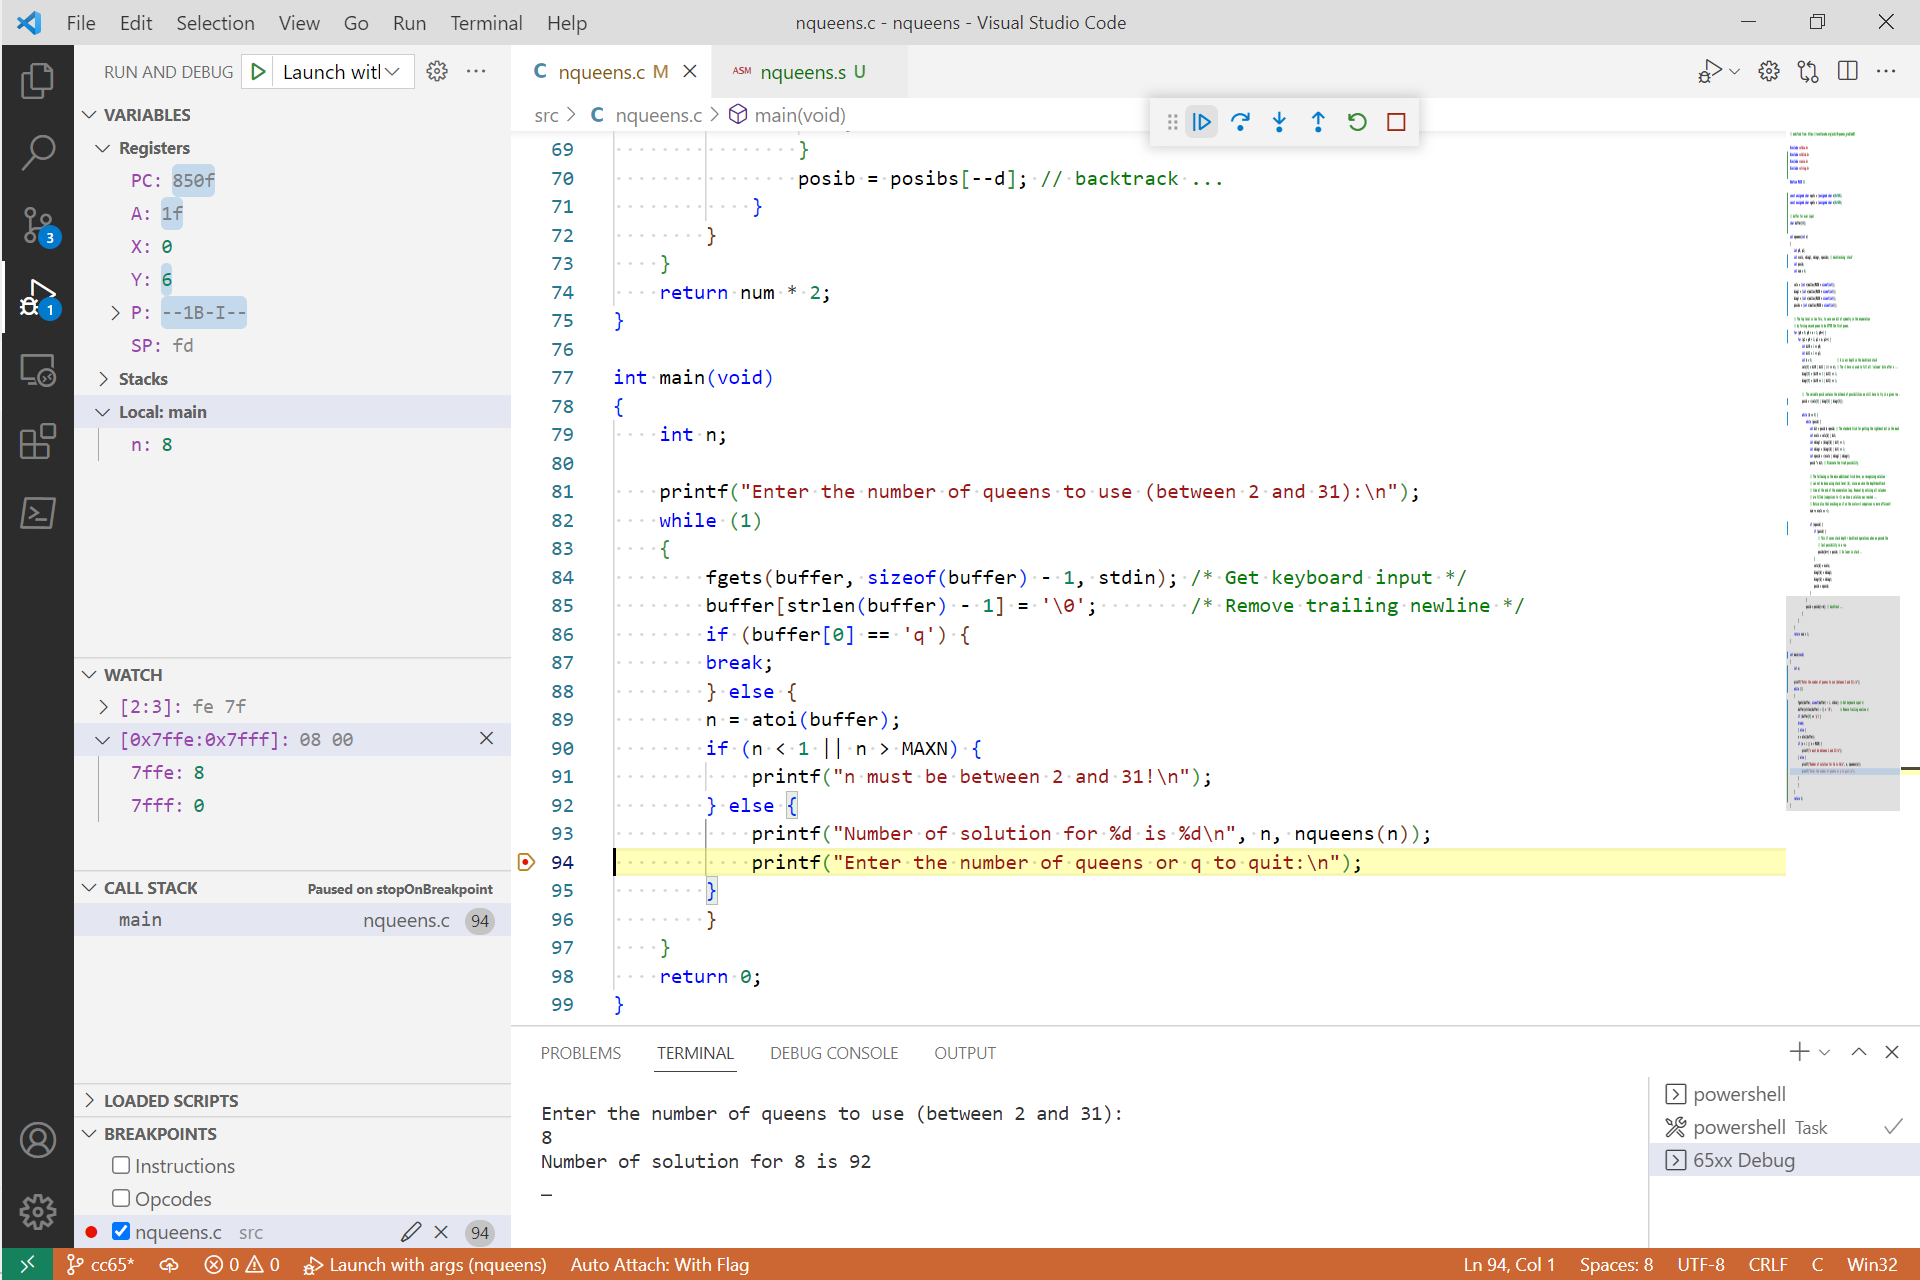
Example of C-based input with N-Queens. Interested in running the N-Queens project on a 65816? Check out my blog post that discusses getting it running from Bank 0 or this post that disusses the modifications needed to put most of the code and data in other banks.
I've created a project to run Klaus Dormann's 6502 functional tests from within the the db65xx extension. These are based on Adam Barnes' cc65 port of Klaus' tests. Follow the link to build and run the tests and for limitations.
The db65xx extension implements many of VS Code's debugging capabilities. See Debugging for an overview of using the VS Code debugging interface. In some cases, db65xx behaves slightly differently than standard:
-
In addition to named function breakpoints, you can add an address as a function breakpoint. This is especially useful to set a breakpoint at a location where a source file isn't available. The address can be entered as either a decimal or hexadecimal value (enter value with a
0xprefix). -
Data breakpoints can be set on the
X,Y,K,BandDregisters for write access only. Data breakpoints for the otherVariablessection items and for read access are not available. Execution will break at an instruction that will write to one of the supported registers. Note that unlike a normal data breakpoint, db65xx breaks at the instruction regardless if the value in the register will actually change. -
I use VS Code's exception breakpoint functionality to implement instruction mnemonic and opcode breakpoints. You can add multiple instructions or opcodes separated by commas. Instruction breakpoint entries are not case sensitive, so
CLCandclcwill match either one in the actual source code. In addition, you can break on macros by entering the macro name as an instruction breakpoint. -
Defined symbols and registers (labeled
K,PC,A,X,Y,P,B,Dand,SP) can be used in theWatchsection, the Debug Console and expressions. Individual status register flag labels are not recognized in expressions but they can be used to set the value the status register in theVariablessection. For example, to set the negative flag and the clear carry flag enterNCas the value of the status register,P, top-level line. Order and case don't matter sonc,cN,Cn, andcnare equivalent. -
The value of watched symbols and registers can be changed via the
Set Valuecontext menu item in theWatchsection or an assignment expression, such assymbol=expression, in the Debug Console. The value of more complex expressions cannot be changed. Trying to do so will raise a an error in theWatchsection or???in the Debug Console. Stacks can't be modified at the summary level with theSet Valuemenu item. Drill down to set the value of a specific location on a stack. -
Square brackets,
[], are treated as an array operator. The expressionsymbol[0]will return the byte referenced bysymbolwhilesymbol[8]will return the eighth byte aftersymbol. -
Square brackets without a preceeding symbol, such as
[0], return the value of memory at the indicated address. Inspecting a memory range is possible by specifying the starting and ending address of the range separated with a colon, such as[start:end]. Memory ranges can be drilled down and individual address values changed with theSet Valuecontext menu item. The same is possible in the Debug Console. A memory range cannot be assigned to a symbol. -
Check the context menu in each area of the debugger to see what options are available. This is the only way to access many of VS Code's debugging functions.
-
db65xx may be launched with arguments to customize the debug session. If launch arguments are not specified, db65xx assumes the binary file to run is in the same directory and has the same name as the file being debugged, but with a
.binextension. Maps are created to inform the UI of the line number in the source file corresponding to the current program counter and of symbol addresses. The ld65 debug file (with the same name as the file being debugged, but with a.dbgextension and in the same directory) is use, if available, to produce these maps. If the debug file or any of the source files it references are not available, the listing, symbol and mapping files produced by ca65 and ld65 are used. If these aren't available, your binary will still run but the VS Code UI will not be able to follow along, show or set variables, or set or stop at breakpoints. -
Available launch arguments:
- sbin: path to source binary file (required if launch arguments used)
- cpu:
65816(default),65C02or6502 - src: path to source folder (default sbin folder)
- list: path to listing folder (default sbin folder)
- input: getc character input address (default 0xF004)
- output: putc character output address (default 0xF001)
Special arguments (interrupt driven I/O):
- via: 65C22 via base address (shift register modeled as keyboard getc)
- acia: 65C51 acia base address (TX = putc, RX = block file getc)
- TX
<esc>Bxto activate 1k block load (x=0-255)
- TX
- fbin: path to block file
- This is a work in progress and will likely remain so. I use it in debugging my 65816 Forth operating system. I make no claims to its usability or suitability for your uses. Coding is just a hobby for me, so take care. Much of the code hasn't been rigorously tested, is without error checking and is likely inefficient. Still, hopefully it will help others get past the limited documentation regarding VS Code's implementation of Microsoft's DAP. Another good starting point for that is Microsoft's Mock-Debug which was the starting point for this project.
- The installation steps noted above are all that are needed for typical use. There may be other setup steps needed to run from the repository. In addition to installing VS Code and recommended extensions, the only other thing I had to install to run the hello world example from a cloned repository on a fairly clean PC was NodeJS.
- db65xx defaults to using the
65816core unless otherwise specified. To use the65C02core, launch db65xx with thecpuargument set to65C02. Similarly, launch db65xx with thecpuargument set to6502to use the6502core. - Execution of invalid opcodes on the 65C02 and 6502 throw an exception. Your program will not run correctly in db65xx if it depends on invalid opcodes. If you would like the ability to use invalid opcodes, consider submitting a pull request.
- The execution engine allocates a minimum of 4 banks (1 bank for the
65C02) of simulated memory for your code and data. If you need more, reserve it in ca65 to increase the size of your binary, which will increase the size of the simulated memory. - When setting the value of a symbol or register or entering an expression, values can be expressed in decimal or another base with the appropriate prefix (
0xfor hexadecimal,0ofor octal,0bfor binary, etc.). Symbol and register values and expression results displayed by the UI are in hexadecimal without any prefix. When setting a value, the UI will present this unprefixed value. You must add a0xprefix if you want to input a hexadecimal value, even to reenter the original value. - Expressions can be used in most places that accept a value. They are evaluated within the context of the 65xx and your program. If an expression doesn't make sense in the context of a 65xx it may not do what you expect. For example, while
(1+(1+1)*2+1)/2-0.5is a valid expression, it will truncate to2if you assign it to a symbol. Similarly, the size of a symbol can affect the value actually assigned to it. There are other limitations. A single character in single quotes, e.g.'x', is interpreted as its ascii equivalent, but using a string in an expression will raise an error. Similarly, using a memory reference, as in[0xf000], in an expression or assignment is valid, but using a memory range, as in[0xf000:0xf008], is not. And of course, the old saying garbage in, garbage out applies. For example, assume you setxequal to1, withx=1, in the Debug Console. If the memory reference[x]equals0, thenx[x]evaluates to10. You might expectx[x]to return the second byte in memory (the first byte afterx, which is1) but sincexwas defined in the Debug Console, it doesn't point to a memory location and simply evaluates to its static value. You'll likely notice other non-standard behavior if you play around with expressions in the Debug Console. Submit an issue if you find expressions that don't returning what you expect. - Symbol names
K,PC,A,X,Y,P,B,Dand,SPare reserved for registers. If you use any of these symbols in your program they will hide the respective register when used in expressions. This is probably the reason if you can't change a register value in theWatchsection or Debug Console. The register can still be changed in theVariablessection. - Symbol sizes are determined from the debug file if used. Otherwise, symbol sizes are set for symbols defined using the
.BYTE,.WORD,.DWORD,.RESand.ASCIIZcontrol commands when using the listing, map, symbol file startup method. Other symbols have the size of 1 byte. - In expressions, symbols are evaluated according to their size, if known, up to 4 bytes in length, otherwise they are evaluated as a single byte. When setting the value of a symbol, the set value is limited to the symbol's size, up to a
DWORD. Setting the value of a larger symbol only changes its least significant byte. - Generally, changing the value of a register has no other effect. For example, setting the
Aregister to0will not cause the zero flag to be set. If you want the zero flag set you'll have to set it yourself. You can't set a register in violation of the hardware. So, you can't change the memory and index register select bits of the status register when in emulation mode, but if you change these bits in native mode, the other registers will change to reflect the updated register size. Changing the program counter,PC, or the program bank register,K, will update the VS Code UI to reflect the updated location in the source code and program execution will continue from that point. - Conditional expressions are ignored on instruction and opcode breakpoints. I may add these within curly braces,
{}, as with logpoints. - All memory locations can be modified even if they are in a read-only segment.
- You can set breakpoints within multi-instruction macros (but not on a macro's first instruction, set a breakpoint at the macro invocation point for that).
- The UI steps into the source of multi-instruction macros after the macro's first instruction is executed at the point of it's invocation. You cannot step over macros but when single stepping, the UI doesn't switch to the source of single instruction macros to avoid a visually disruptive experience. If there is interest, I may make this user configurable to allow stepping into macros regardless of length, stepping out of a macro or stepping over macros entirely similar to the normal stepping behavior.
- Conditions can be set on breakpoints within a macro. The conditions apply to each instance where the macro is used and not to the macro in general. Thus a hit count of 5 on a macro breakpoint will break when a specific macro expansion has been hit 5 times.
- db65xx considers all symbols in assembly files as global, regardless of any defining scope. Thus duplicate symbols in different scopes or different assembly files are store internally in db65xx as the same symbol. The actual symbol referenced by db65xx will be the last one listed in the symbols section of the debug file. I haven't found this to be a problem in my debugging, but may change this in the future if it becomes a problem.
- db65xx supports debugging C-based code but is limited somewhat by cc65's methods and also the information it provides in it's debug file. As such, I'll likely focus more on adding assembly-based rather than C-based features to the debugger in the future. In any case, see cc65 coding hints for tips on how to get the most out of C-based coding in cc65.
- When debugging a C-based project, by defualt db65xx will execute any startup code and stop at the entry of the
mainfunction. I may make this configurable in the future. - Global C Variables:
- These variables are included in the debug file with an underscore, '_', prepended. As such they can be used within db65xx as any other symbol as long as you add the underscore when using the symbol. Note that db65xx accounts for this when hovering over a global C variable.
- These variables have the same scope as assembly symbols. Similarly named symbols (including the prepended underscore) in assembler files will be in conflict with these variables in db65xx. The symbol source that is ultimately referenced depends on the symbol's position in the debug file.
- These variables are not readily identifiable as C variables from the debug file alone. Also, the debug file does not include a C global variable's bank address if you place C-related data outside of Bank 0, when writing C code forg the 65816 for example (this isn't surprizing since cc65 and ld65 aren't designed for the 65816). In this case we need to add the data bank register to the symbol's address to properly dereference these symbols. db65xx assumes it needs to do this when (1) a global C variable begins with an underscore, (2) a C file is associated with the stack frame on the top of the call stack, and (3) the data bank register is greater than 0. A global C variable outside of Bank 0 may not be dereferenced properly if these conditions aren't true. For example, a global C variable outside of Bank 0 will not be dereference properly if you break within the auto-generated assembly code for that C module, because the file associated with the top stack frame is not a C file.
- Local C Variables:
- Function parameters and top level local variables in C-based functions within the currently selected stack frame in the
Call Stacksection are displayed in theLocaldropdown in theVariablessection. - Variables local to nested blocks within C functions are not included by ld65 in the debug file and thus are not available in db65xx. Declare these variables at the top of the fuction block if you want to observe them while debugging. (See hint #2 in the
cc65 coding hintslink above. Also, note that you can't mix code and declarations in cc65.) - To properly view local variables while debugging, use the
cdeclcalling convention as this passes all parameters on the C stack. You can either use thecdeclor__cdecl__keywords when declaring C functions or use the--all-cdeclcommand line option when running cc65. db65xx notes the C stack pointer for a function's stack frame on entry to the function. However, by default, cc65 uses thefastcallcalling convention for C functions, passing the rightmost parameter in registers and then pushing it to the stack after function entry. This changes the stack pointer, invalidating the one db65xx noted for the function's stack frame on entry. This results in somewhat smaller code when a function is called many times. However, with thefastcallcalling convention, db65xx will lookup the values of local variables from the wrong location on the stack. Using either calling convention is fine if you are not interested in local variables. - As a final complication, to view local variables, we need access to the C stack pointer,
sp, on the zero page. While this symbol is included in the map file, without specific consideration it's only listed as an import in the debug file which doesn't include its address. This happens when the module that reserves space for the stack pointer on the zero page is created without saving debug information. While I could just grabspfrom the map file, I'd rather not require the use of another file just to view local variables (especially considering that the map file doesn't include any other information relevant to local variables). As such, db65xx assumes thatspwill be defined with its address in the debug file. Local variables won't be listed if it's not. To force ld65 to includespin the debug file with its address, assemble the C library modulezeropage.swith debug information enabled by specifying.debuginfo +at the beginning of the file or assembling it with the-gcommand line option. I've made this change in the library I've included with the Sieve of Eratosthenes project. - As elsewhere in db65xx, local variables are displayed as hexadecimal values without a
0xprefix. The size of local variables (up to 4 bytes) is considered when displaying a value. However, the size of a function's first parameter cannot be determined from information in the debug file alone and for now is assumed to be an integer. It's value may be incorrect if it is some other type. - Register variables are not displayed but may be added in the future.
- Static local variables are not displayed (these are not referenced directly in the debug file as cc65 renames these variables internally making dereferencing them cumbersome).
- Local variables are not available in the
Watchsection,Debug Consoleor in expressions. This is mainly to avoid the coding for this only to create confusion when a same named variable is used in a nested block within the function. I may modify this and live with the possible confusion in the future.
- Function parameters and top level local variables in C-based functions within the currently selected stack frame in the
- When debugging assembly only projects, usually only the current instruction is displayed on the call stack. If you step into a subroutine with available source code an additional frame will be added to the call stack. At this point, step out is available to return to the calling routine. On continue, the call stack collapses to current instruction. The call stack for C only projects is more complete, however, the assembly portion of the call stack may truncated when debugging multi-language projects (assembly and C). This behavior is mainly to avoid producing an incorrect call stack when program flow is manually modified by adjusting the processor hardware stack.
- While the cc65 toolset doesn't explicitly support using C code with the 65816, it won't complain if you try. See my blog posts linked to the N-Queens project referenced above for information on how to write C code for the 65816 with the cc65 toolset.
- The db65xx extension comes with basic 65xx assembly language syntax highlighting. You can use it by selecting the
65xxlanguage mode. You might want to use another language extension for a more enhanced debugging experience. Search for 6502 in VS Code's extensions marketplace. - Depending on how your system is configured, assembly and C source code files might open in the
Plain textlanguage mode. You may not be able to set breakpoints in this mode. Change the language mode if you are having trouble setting breakpoints within a source file by selecting an appropriate mode, for example65xxfor assembly files orCfor C files (you may need to install an appropriate C extension if you haven't done so already). - more to come...


