GithubHelp home page GithubHelp logo

tusiimeallan / unity3d-globe Goto Github PK

View Code? Open in Web Editor NEW

This project forked from dandarawy/unity3d-globe

0.0 0.0 0.0 32.53 MB

Unity3D Implementation of Chrome Experiment WebGL Globe

Home Page: https://dandarawy.github.io/Unity3D-Globe/

License: MIT License

JavaScript 3.85% C# 67.20% CSS 1.08% HTML 1.88% HLSL 3.30% ShaderLab 22.70%

unity3d-globe's Introduction

Unity3D-Globe

Unity3D Implementation for Chrome Experiment WebGL Globe

Try a Live Demo

Unity3D Globe Screenshot

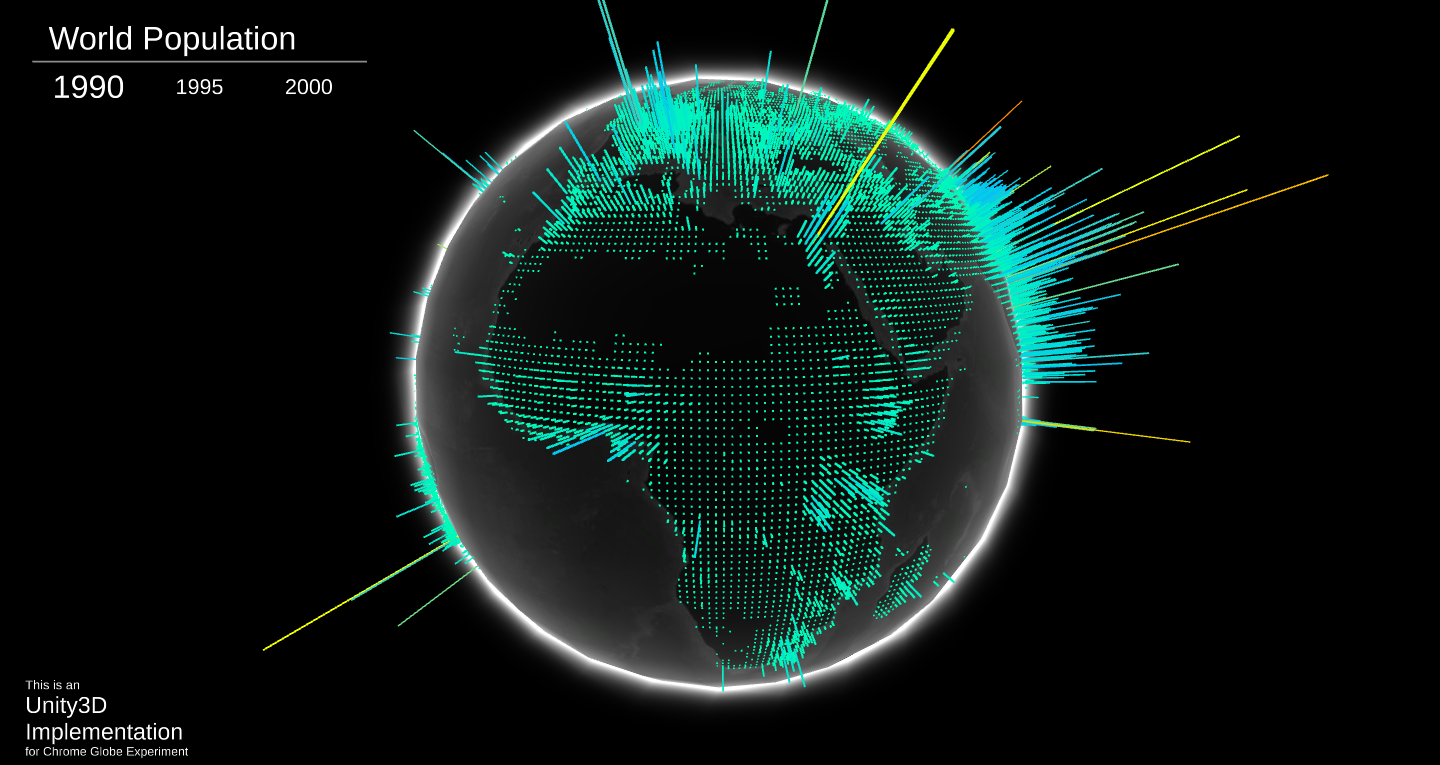
Unity3D-Globe is a complete project in which you can use to add your own data and create your globe.

Change Data Source

The default DataLoader loads a JSON file from Resources folder, the loader expect JSON in the following format:

{
  "AllData": [
    {
      "Year": "1990",
      "Data": latitude, longitude, magnitude, latitude, longitude, magnitude, ...]
    },
    {
      "Year": "2000",
      "Data": latitude, longitude, magnitude, latitude, longitude, magnitude, ...]
    }
  ]
}

You can change the structure of the JSON file or even the data source as required and implement your own DataLoader.

Visualize Your Data

  • To visualize your data you'll need to have a GameObject with DataVisualizer component attached to it
  • DataVisualizer needs a reference to the following elements:

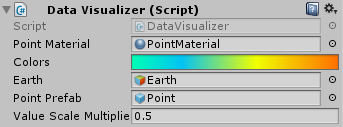
  1. PointMaterial: this is a material used for the points mesh, this material should be able to use the vertex color data to set the final color of the vertex, there is a material created for this purpose under the materials folder which use a custom shader written for this purpose
  2. Colors: a gradient to be used to assign each data point a color according to its value
  3. Earth: the earth object in the scene.
  4. Point Prefab: a prefab to the point which will be placed for each data value
  • After loading the data wrap it in array of SeriesData, the SeriesData is just a class that has a name and float array, the float array represent the series data in the following order [latitude, longitude, magnitude, latitude, longitude, magnitude, ...]
  • Call the CreateMeshes function from your DataVisualizer and send it the series array that you have just created
  • To switch the shown series just call ActivateSeries function on visualizer and send it the index of the series that you need to show.

unity3d-globe's People

Contributors

dandarawy avatar

Recommend Projects

  • React photo React

    A declarative, efficient, and flexible JavaScript library for building user interfaces.

  • Vue.js photo Vue.js

    ๐Ÿ–– Vue.js is a progressive, incrementally-adoptable JavaScript framework for building UI on the web.

  • Typescript photo Typescript

    TypeScript is a superset of JavaScript that compiles to clean JavaScript output.

  • TensorFlow photo TensorFlow

    An Open Source Machine Learning Framework for Everyone

  • Django photo Django

    The Web framework for perfectionists with deadlines.

  • D3 photo D3

    Bring data to life with SVG, Canvas and HTML. ๐Ÿ“Š๐Ÿ“ˆ๐ŸŽ‰

Recommend Topics

  • javascript

    JavaScript (JS) is a lightweight interpreted programming language with first-class functions.

  • web

    Some thing interesting about web. New door for the world.

  • server

    A server is a program made to process requests and deliver data to clients.

  • Machine learning

    Machine learning is a way of modeling and interpreting data that allows a piece of software to respond intelligently.

  • Game

    Some thing interesting about game, make everyone happy.

Recommend Org

  • Facebook photo Facebook

    We are working to build community through open source technology. NB: members must have two-factor auth.

  • Microsoft photo Microsoft

    Open source projects and samples from Microsoft.

  • Google photo Google

    Google โค๏ธ Open Source for everyone.

  • D3 photo D3

    Data-Driven Documents codes.