GithubHelp home page GithubHelp logo

vasturiano / circlepack-chart Goto Github PK

View Code? Open in Web Editor NEW
60.0 5.0 20.0 543 KB

A circle packing interactive chart web component for visualizing hierarchical data

Home Page: https://vasturiano.github.io/circlepack-chart/example/flare

License: MIT License

HTML 25.81% JavaScript 69.20% CSS 4.99%
circle-packing chart data-visualization d3js hierarchical-data

circlepack-chart's Introduction

circlepack-chart

NPM package Build Size NPM Downloads

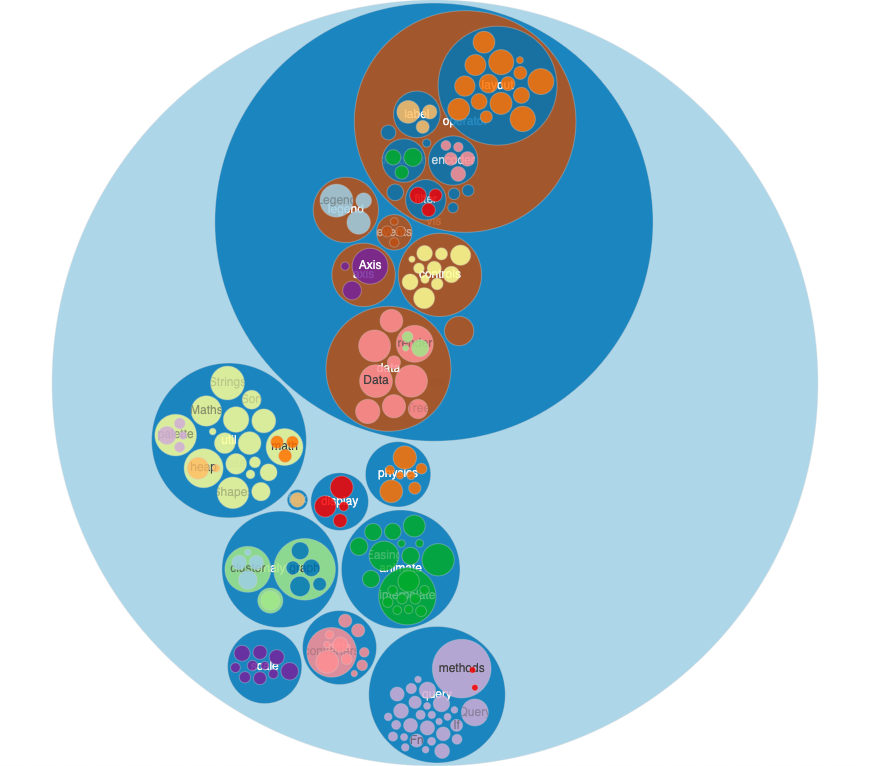
An interactive circle packing chart for visualizing proportions in hierarchical data, where nodes of a tree are represented as nested circles.

Supports zooming interactions via mouse-wheel events or by clicking on a node, which focuses the viewport on the associated sub-tree. Clicking in the chart's background resets the zoom to its initial position. The chart also responds to data changes by animating the dimensions of each of the nodes into their new positions.

For improved performance, circles with radius smaller than a given threshold (minCircleRadius) are excluded from the DOM, allowing for representation of large data sets while maintaining a smooth interaction. See here for an example of a randomly generated large data structure.

See also the Treemap, Icicle and Sunburst charts.

Quick start

import CirclePack from 'circlepack-chart';

or using a script tag

<script src="//unpkg.com/circlepack-chart"></script>

then

const myChart = CirclePack();
myChart
  .data(<myData>)
  (<myDOMElement>);

API reference

Method Description Default
data([object]) Getter/setter for chart data (see below for syntax details).
width([number]) Getter/setter for the chart width in px. <window width>
height([number]) Getter/setter for the chart height in px. <window height>
children([string or fn]) Getter/setter for a data node's children accessor, used to establish the hierarchical relationship between nodes. Supports either a string indicating the object's property name, or a function(node) which should return an array of nodes. children
label([string or fn]) Getter/setter for a node object label accessor, used to display labels on the circles and their tooltips. name
size([string or fn]) Getter/setter for a node object size accessor, used to compute the areas of the circles. value
padding([number]) Getter/setter for the amount of padding between adjacent circles, in px. 4
color([string or fn]) Getter/setter for a node object color accessor, used to color the circles. grey
borderWidth([number, string or fn]) Getter/setter for a node object border width accessor, used to set the stroke width of each circle. 1
nodeClassName([string or fn]) Getter/setter for a node object classname accessor. Determines the CSS class(es) to apply to each circle node.
minCircleRadius([number]) Getter/setter for the minimum radius of a circle (in px) required for it to be rendered in the DOM. 3
excludeRoot([boolean]) Getter/setter for whether to exclude the root node from the representation. false
sort([fn]) Getter/setter for the compare method used to sort sibling circles. A value of null (default) maintains the existing order found in the input data structure. This method is equivalent to d3-hierarchy's sort, it receives two arguments representing two sibling nodes and expects a numeric return value (-1, 0 or 1) indicating the order. Each element is an instance of d3-hierarchy node and has several useful properties to specify order: data (the corresponding data object), value (summed value of node and all its descendants) and depth (layer degree). For example, to order circles by size, use: (a, b) => b.value - a.value. <existing order>
showLabels([boolean]) Getter/setter for whether to show labels in the nodes. Regardless of this setting, labels too large to fit within a circle's diameter are automatically hidden. true
showTooltip([fn]) Getter/setter to specify a node object tooltip's visibility. If this function returns false for a particular node, that node's tooltip will not display at all. If unspecified, all nodes' tooltips will display. () => true
tooltipTitle([fn]) Getter/setter for a node object tooltip title. The function should return a string to be displayed in bold in the first line of the tooltip. If unspecified, the full hierarchical name will be displayed.
tooltipContent([fn]) Getter/setter for a node object tooltip content. Use this to specify extra content in each of the circle's tooltips in addition to the title set in tooltipTitle.
zoomToNode([node]) Programmatically zoom the chart to a particular node.
zoomBy([number]) Programmatically zoom the chart by a specific amount. 1 is unity, above one indicates a zoom-in and below a zoom-out.
zoomReset() Programmatically reset the zoom to the global view.
onHover([fn]) Callback function for mouse hover events. Includes the data node object (or null if hovering on background) as single argument.
onClick([fn]) Callback function for click events. Includes the data node object (or null if clicking on the background) as single argument. A falsy value (default) automatically zooms on clicked circles, equivalent to myChart.onClick(myChart.zoomToNode).
transitionDuration([number]) Getter/setter for the animation duration of transitions between states (opening, zoom in/out) in milliseconds. Enter 0 to disable animations. 800

Data syntax

{
  name: "root",
  children: [
    {
      name: "leafA",
      value: 3
    },
    {
      name: "nodeB",
      children: [
        {
          name: "leafBA",
          value: 5
        },
        {
          name: "leafBB",
          value: 1
        }
      ]
    }
  ]
}

Giving Back

paypal If this project has helped you and you'd like to contribute back, you can always buy me a โ˜•!

circlepack-chart's People

Contributors

vasturiano avatar

Stargazers

 avatar  avatar  avatar  avatar  avatar  avatar  avatar  avatar  avatar  avatar  avatar  avatar  avatar  avatar  avatar  avatar  avatar  avatar  avatar  avatar  avatar  avatar  avatar  avatar  avatar  avatar  avatar  avatar  avatar  avatar  avatar  avatar  avatar  avatar  avatar  avatar  avatar  avatar  avatar  avatar  avatar  avatar  avatar  avatar  avatar  avatar  avatar  avatar  avatar  avatar  avatar  avatar  avatar  avatar  avatar  avatar  avatar  avatar  avatar  avatar

Watchers

 avatar  avatar  avatar  avatar  avatar

circlepack-chart's Issues

Force z index on labels

When the chart is rendered the parent labels show underneath all the child circles - is there a way to have the label show on top?

Accessing the DomNode in the dataNode

Hello !
I've tested your librairy, and I'm really missing a feature to be able to do what I want with it: I'd like to have access to the DomNode in the DataNode object.

For example, when you click on a circle, I'd like to be able to add an attribute to it, so I'd need access to the tag for this circle.

I'd like to know if it's possible to add this tag to the content of the __dataNode.

If not, perhaps you already have a technique I don't know about for accessing the node?

Thanks in advance for your reply!

Grainy resolution when zooming in

Describe the bug
When zooming in the circles on Firefox have a blurry out of focus appearance. The focus seems to improve after moving the mouse slightly. Chrome works very well and Safari half works.

To Reproduce
Zoom in using the mousewheel or clicking a node when using the test provided : https://vasturiano.github.io/circlepack-chart/example/large-data

Expected behavior
Zoom in and be able to immediately see all elements in focus and read the elements labels on all common browsers

Desktop (please complete the following information):

  • OS: [e.g. iOS] : Mac Big Sur 11:3.1
  • Browser : Firefox, 101.0 (64-bit) : Circles have rings around them and are generally out of focus. At time the nodes show up looking like out of focus stars
  • Browser : Safari, Version 14.1 (16611.1.21.161.6) : Circles have rings around them but are generally in focus
  • Browser : Chrome, Version 102.0.5005.115 (Official Build) (x86_64) : All Circles show correctly and are in focus at all times

Smartphone (please complete the following information):

  • Device: iPhone6
  • OS: OS12.5.5
  • Browser : Safari : Circles have rings around them but are half in focus
  • Version : Unknown

In typescript has this error

Type '{ name: string; value: number; }' is not assignable to type 'Node'.
Object literal may only specify known properties, and 'value' does not exist in type 'Node'. TS2322

11 |           {
12 |             name: "leafA",

13 | value: 3
| ^
14 | },
15 | {
16 | name: "nodeB",

Problem with size of titles inside circle

Describe the bug
I have two problems with the size of the title in the circle, which are:
When the text is large:

  1. Part of the text is hidden inside the circle;
  2. The text is not displayed in the circle;

Expected behavior
I need the circles to fit the text size so they don't get clipped or hidden.

Screenshots
image
image

Additional context
I'm using size according to the documentation to orchestrate the size of the circle, but it doesn't work.

Code

  CirclePack()
      .data(nodes)
      .label('name')
      .size('size')
      .color('color')
      .minCircleRadius(50)
      .tooltipContent((d, node) => tooltipoContent({ size: node.value }))(containerRef.current);

Recommend Projects

  • React photo React

    A declarative, efficient, and flexible JavaScript library for building user interfaces.

  • Vue.js photo Vue.js

    ๐Ÿ–– Vue.js is a progressive, incrementally-adoptable JavaScript framework for building UI on the web.

  • Typescript photo Typescript

    TypeScript is a superset of JavaScript that compiles to clean JavaScript output.

  • TensorFlow photo TensorFlow

    An Open Source Machine Learning Framework for Everyone

  • Django photo Django

    The Web framework for perfectionists with deadlines.

  • D3 photo D3

    Bring data to life with SVG, Canvas and HTML. ๐Ÿ“Š๐Ÿ“ˆ๐ŸŽ‰

Recommend Topics

  • javascript

    JavaScript (JS) is a lightweight interpreted programming language with first-class functions.

  • web

    Some thing interesting about web. New door for the world.

  • server

    A server is a program made to process requests and deliver data to clients.

  • Machine learning

    Machine learning is a way of modeling and interpreting data that allows a piece of software to respond intelligently.

  • Game

    Some thing interesting about game, make everyone happy.

Recommend Org

  • Facebook photo Facebook

    We are working to build community through open source technology. NB: members must have two-factor auth.

  • Microsoft photo Microsoft

    Open source projects and samples from Microsoft.

  • Google photo Google

    Google โค๏ธ Open Source for everyone.

  • D3 photo D3

    Data-Driven Documents codes.