![]()


Business grade visualizations in seconds.
Depict is built on the top of Bokeh. It aims at providing one-line access to the most common types of graph by setting opinionated default and avoiding boilerplate code. Graphs are aesthetic, efficiently rendered, interactive and sharable.
It is made for data-{scientist, analyst, engineer, lead, etc} seeking to create beautiful plots while reducing the graph-tweaking time.
- Made simple
While Bokeh, Matplotlib, Dash and many others provide a tremendous flexibility, Depict will get you faster to the classical graphs by making choices for you. Scatter plots, histograms and other heat-maps are accessible in one line.
- Looking fresh
Graphs should be ready to share and pleasant to look at, for technical and non technical audience. Depict takes care of the freshness of your graphs to let you focus on the maths.
- Stay organized
Depict helps you save you graphs in html with textual metadata and share them around. Your plots are kept interactive, contextualized and readable in the browser.
- Infinitely customizable with Bokeh
You want to personalize you graph further? You can use Bokeh glyphs to interact with depict figure and get access to a fine level of granularity.
-
Install depict from PyPI (recommended):
pip install depict -
Install depict from GitHub sources:
Clone the git repository
git clone https://github.com/vboulanger/depict.gitInside the depict folder, install the package
cd depict
sudo python setup.py install
The documentation can be found at: https://depict.readthedocs.io.
import depict

depict.line([3, 1, 4, 1, 5, 9, 2, 6, 5, 3])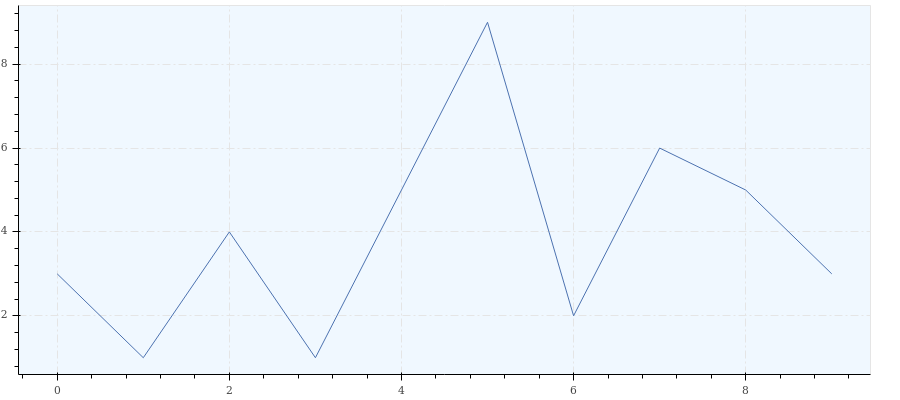
Common to all examples:
import depict
import numpy as np
import pandas as pdrandom_walk = np.cumsum(np.random.rand(1000) - 0.5)
depict.line(random_walk, title='Random walk', legend='Path', x_label='Step')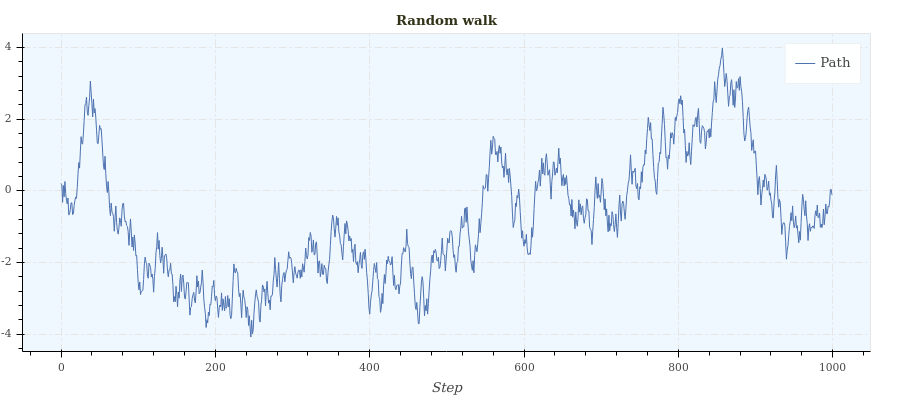
Your graph parameters are stored in a session to keep your graphs visually consistent and avoid boilerplate code.
depict.session(width=1000, grid_visible=True, palette_name='linear_blue')x = np.random.random(1000)
y = np.random.random(1000)
color = np.sin(x) + np.sin(y)
depict.point(x=x, y=y, color=color)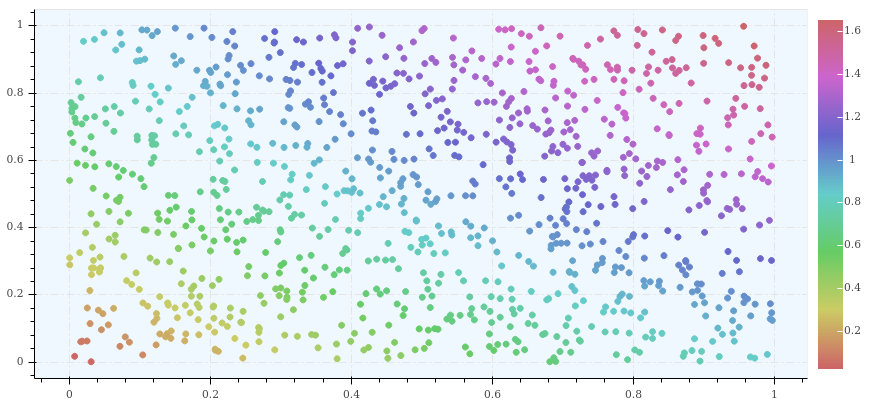
x = ['Jan 2018', 'Feb 2018', 'Mar 2018', 'Apr 2018']
y = [1.1, 2.2, 1.9, 2.8]
depict.histogram(x=x, y=y)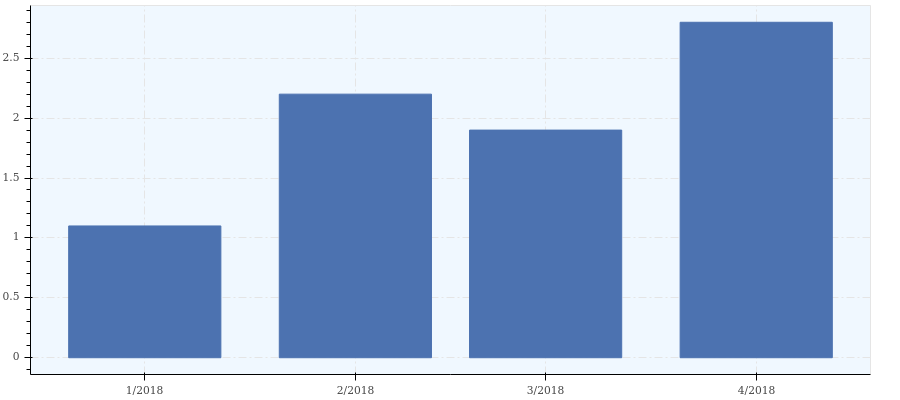
Native compatibility with numpy arrays and pandas dataframes as well as NaN and NaT handling.
random_walk = lambda : np.cumsum(np.random.rand(1000) - 0.5)
df = pd.DataFrame({'Col 1': random_walk(), 'Col 2': random_walk()})

depict.line(y=['Col 1', 'Col 2'], source_dataframe=df)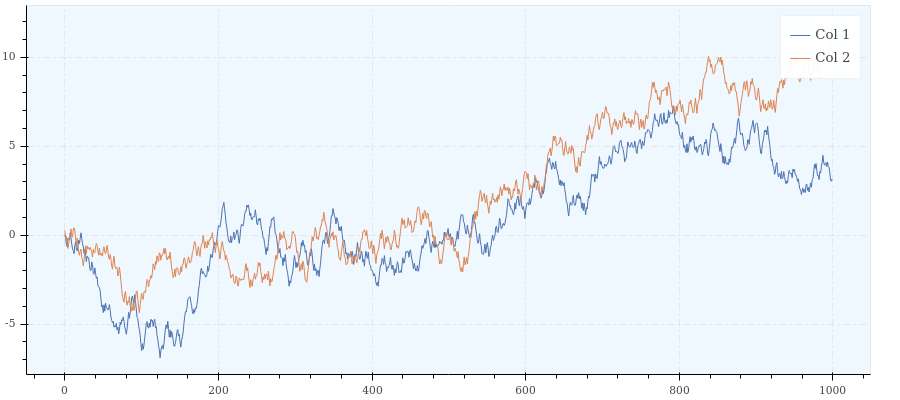
You plots can be rendered in line and column just like a matrix would be.
random_walk = lambda : np.cumsum(np.random.rand(1000) - 0.5)
plot_1 = depict.line(y=random_walk(), title='Walk 1', show_plot=False)
plot_2 = depict.line(y=random_walk(), title='Walk 2', show_plot=False)
plot_3 = depict.line(y=random_walk(), title='Walk 3', show_plot=False)

depict.show([[plot_1, plot_2], [plot_3]])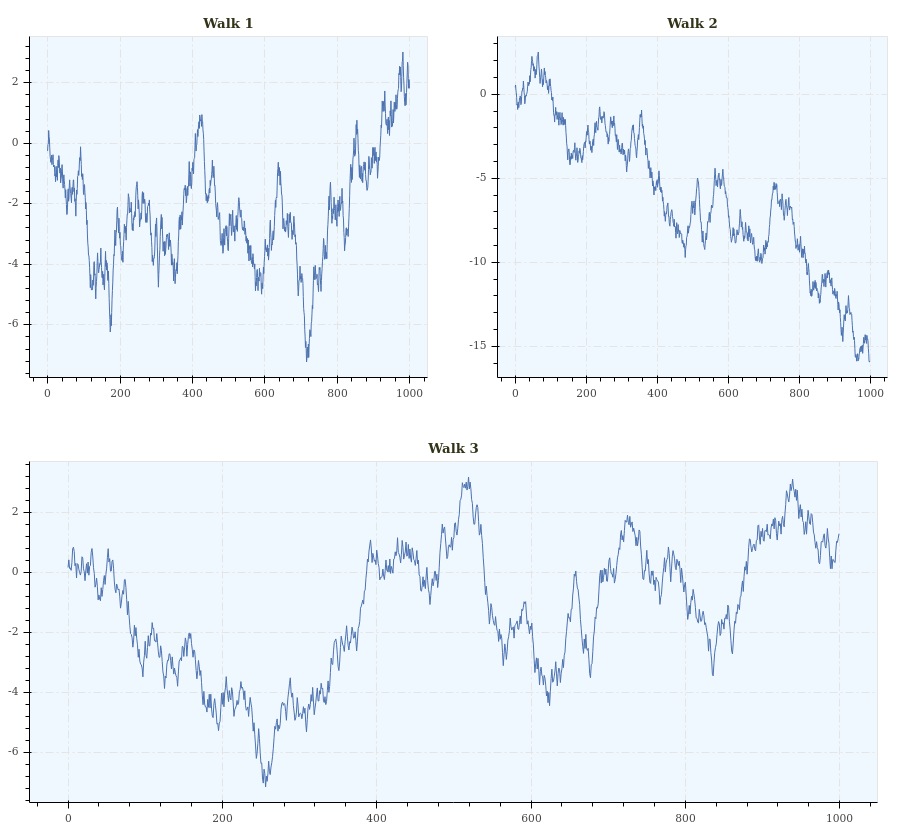
Plots sharing a consistent background space can be summed and their content will be superimposed.
p_1 = depict.point(x=np.arange(10), y=np.arange(10) + np.random.rand(10))
p_2 = depict.line(y=np.arange(10), color='purple')
p_sum = p_1 + p_2

depict.show([[p_1, p_2], p_sum])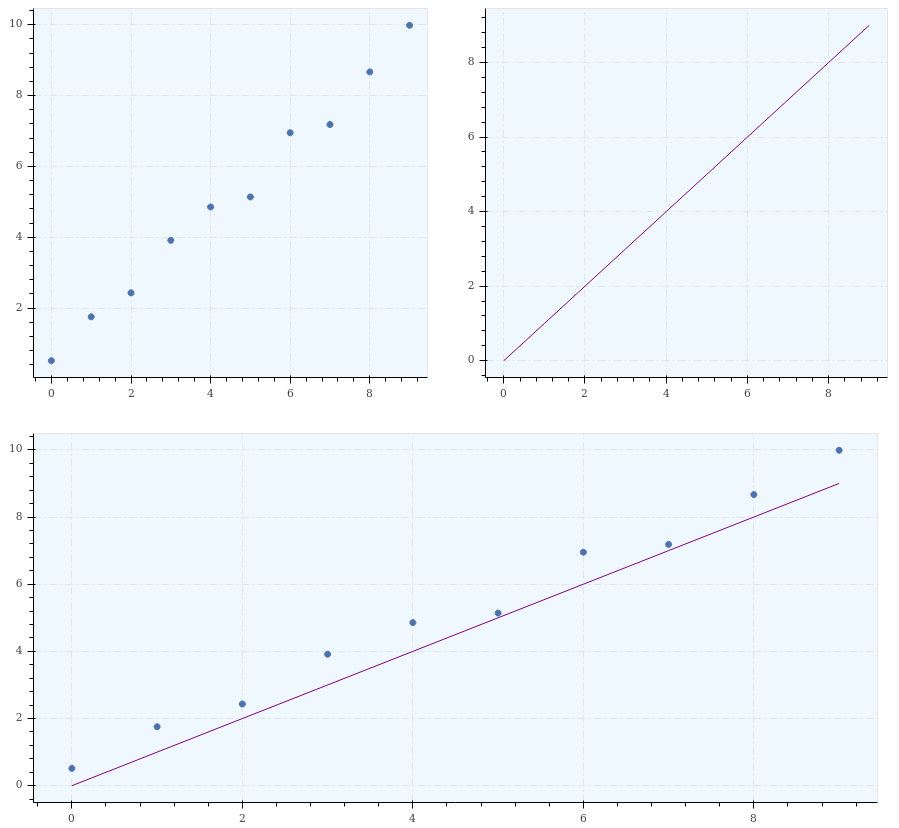
Graphs often come along with a context. For that reason you can add HTML-formatted text to be displayed below your graph.
description = """
<h2>Graph generated for the README</h2>
<br>
HTML code can be added here
"""
plot_1 = depict.histogram(np.random.rand(10), description=description)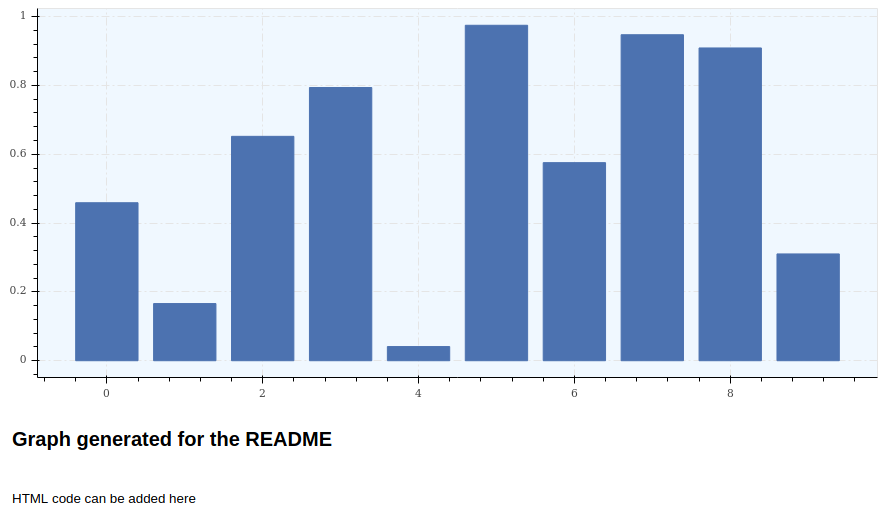
To access a finer level of customization, you can retrieve the Bokeh figure object easily and interact with it.
plot = depict.histogram(x=None, y=[1, 2, 3], show_plot=False)
plot.figure # This is a Bokeh figureGraphs as HTML files allow you to keep them fully interactive and readable without any specific software and on several platforms.
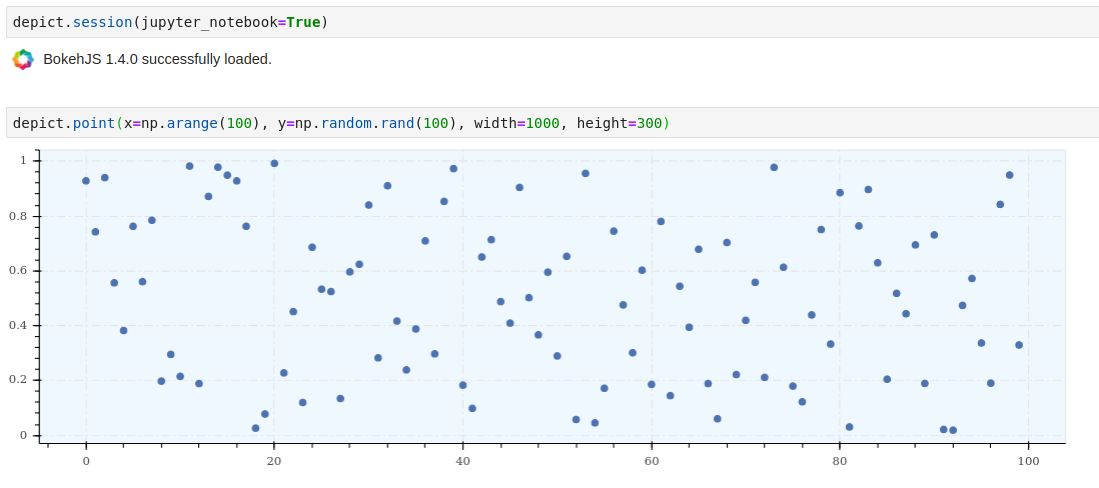
depict.point(x=[1, 2, 3], y=[4, 5, 2], save_path='my_plot.html')Bokeh is nicely integrated in Jupyter notebooks and so does Depict.
The development of Depict takes place on Github. Any contribution is welcome!


