GithubHelp home page GithubHelp logo

vegasbrianc / prometheus Goto Github PK

View Code? Open in Web Editor NEW
4.3K 94.0 1.5K 3.06 MB

A docker-compose stack for Prometheus monitoring

License: MIT License

docker prometheus stack dashboard-templates alert grafana-dashboard docker-swarm docker-compose grafana cadvisor

prometheus's Introduction

Contents

A Prometheus & Grafana docker-compose stack

Here's a quick start using Play-With-Docker (PWD) to start-up a Prometheus stack containing Prometheus, Grafana and Node scraper to monitor your Docker infrastructure. The Try in PWD below allows you to quickly deploy the entire Prometheus stack with a click of the button. This will allow you to quickly test the stack to see if it meets your needs.

Try in PWD

Pre-requisites

Before we get started installing the Prometheus stack. Ensure you install the latest version of docker and docker swarm on your Docker host machine. Docker Swarm is installed automatically when using Docker for Mac or Docker for Windows.

Installation & Configuration

Clone the project locally to your Docker host.

If you would like to change which targets should be monitored or make configuration changes edit the /prometheus/prometheus.yml file. The targets section is where you define what should be monitored by Prometheus. The names defined in this file are actually sourced from the service name in the docker-compose file. If you wish to change names of the services you can add the "container_name" parameter in the docker-compose.yml file.

Once configurations are done let's start it up. From the /prometheus project directory run the following command:

$ HOSTNAME=$(hostname) docker stack deploy -c docker-stack.yml prom

That's it the `docker stack deploy' command deploys the entire Grafana and Prometheus stack automagically to the Docker Swarm. By default cAdvisor and node-exporter are set to Global deployment which means they will propogate to every docker host attached to the Swarm.

The Grafana Dashboard is now accessible via: http://<Host IP Address>:3000 for example http://192.168.10.1:3000

username - admin
password - foobar (Password is stored in the `/grafana/config.monitoring` env file)

In order to check the status of the newly created stack:

$ docker stack ps prom

View running services:

$ docker service ls

View logs for a specific service

$ docker service logs prom_<service_name>

Add Datasources and Dashboards

Grafana version 5.0.0 has introduced the concept of provisioning. This allows us to automate the process of adding Datasources & Dashboards. The /grafana/provisioning/ directory contains the datasources and dashboards directories. These directories contain YAML files which allow us to specify which datasource or dashboards should be installed.

If you would like to automate the installation of additional dashboards just copy the Dashboard JSON file to /grafana/provisioning/dashboards and it will be provisioned next time you stop and start Grafana.

Install Dashboards the old way

I created a Dashboard template which is available on Grafana Docker Dashboard. Simply select Import from the Grafana menu -> Dashboards -> Import and provide the Dashboard ID #179

This dashboard is intended to help you get started with monitoring. If you have any changes you would like to see in the Dashboard let me know so I can update Grafana site as well.

Here's the Dashboard Template

Grafana Dashboard

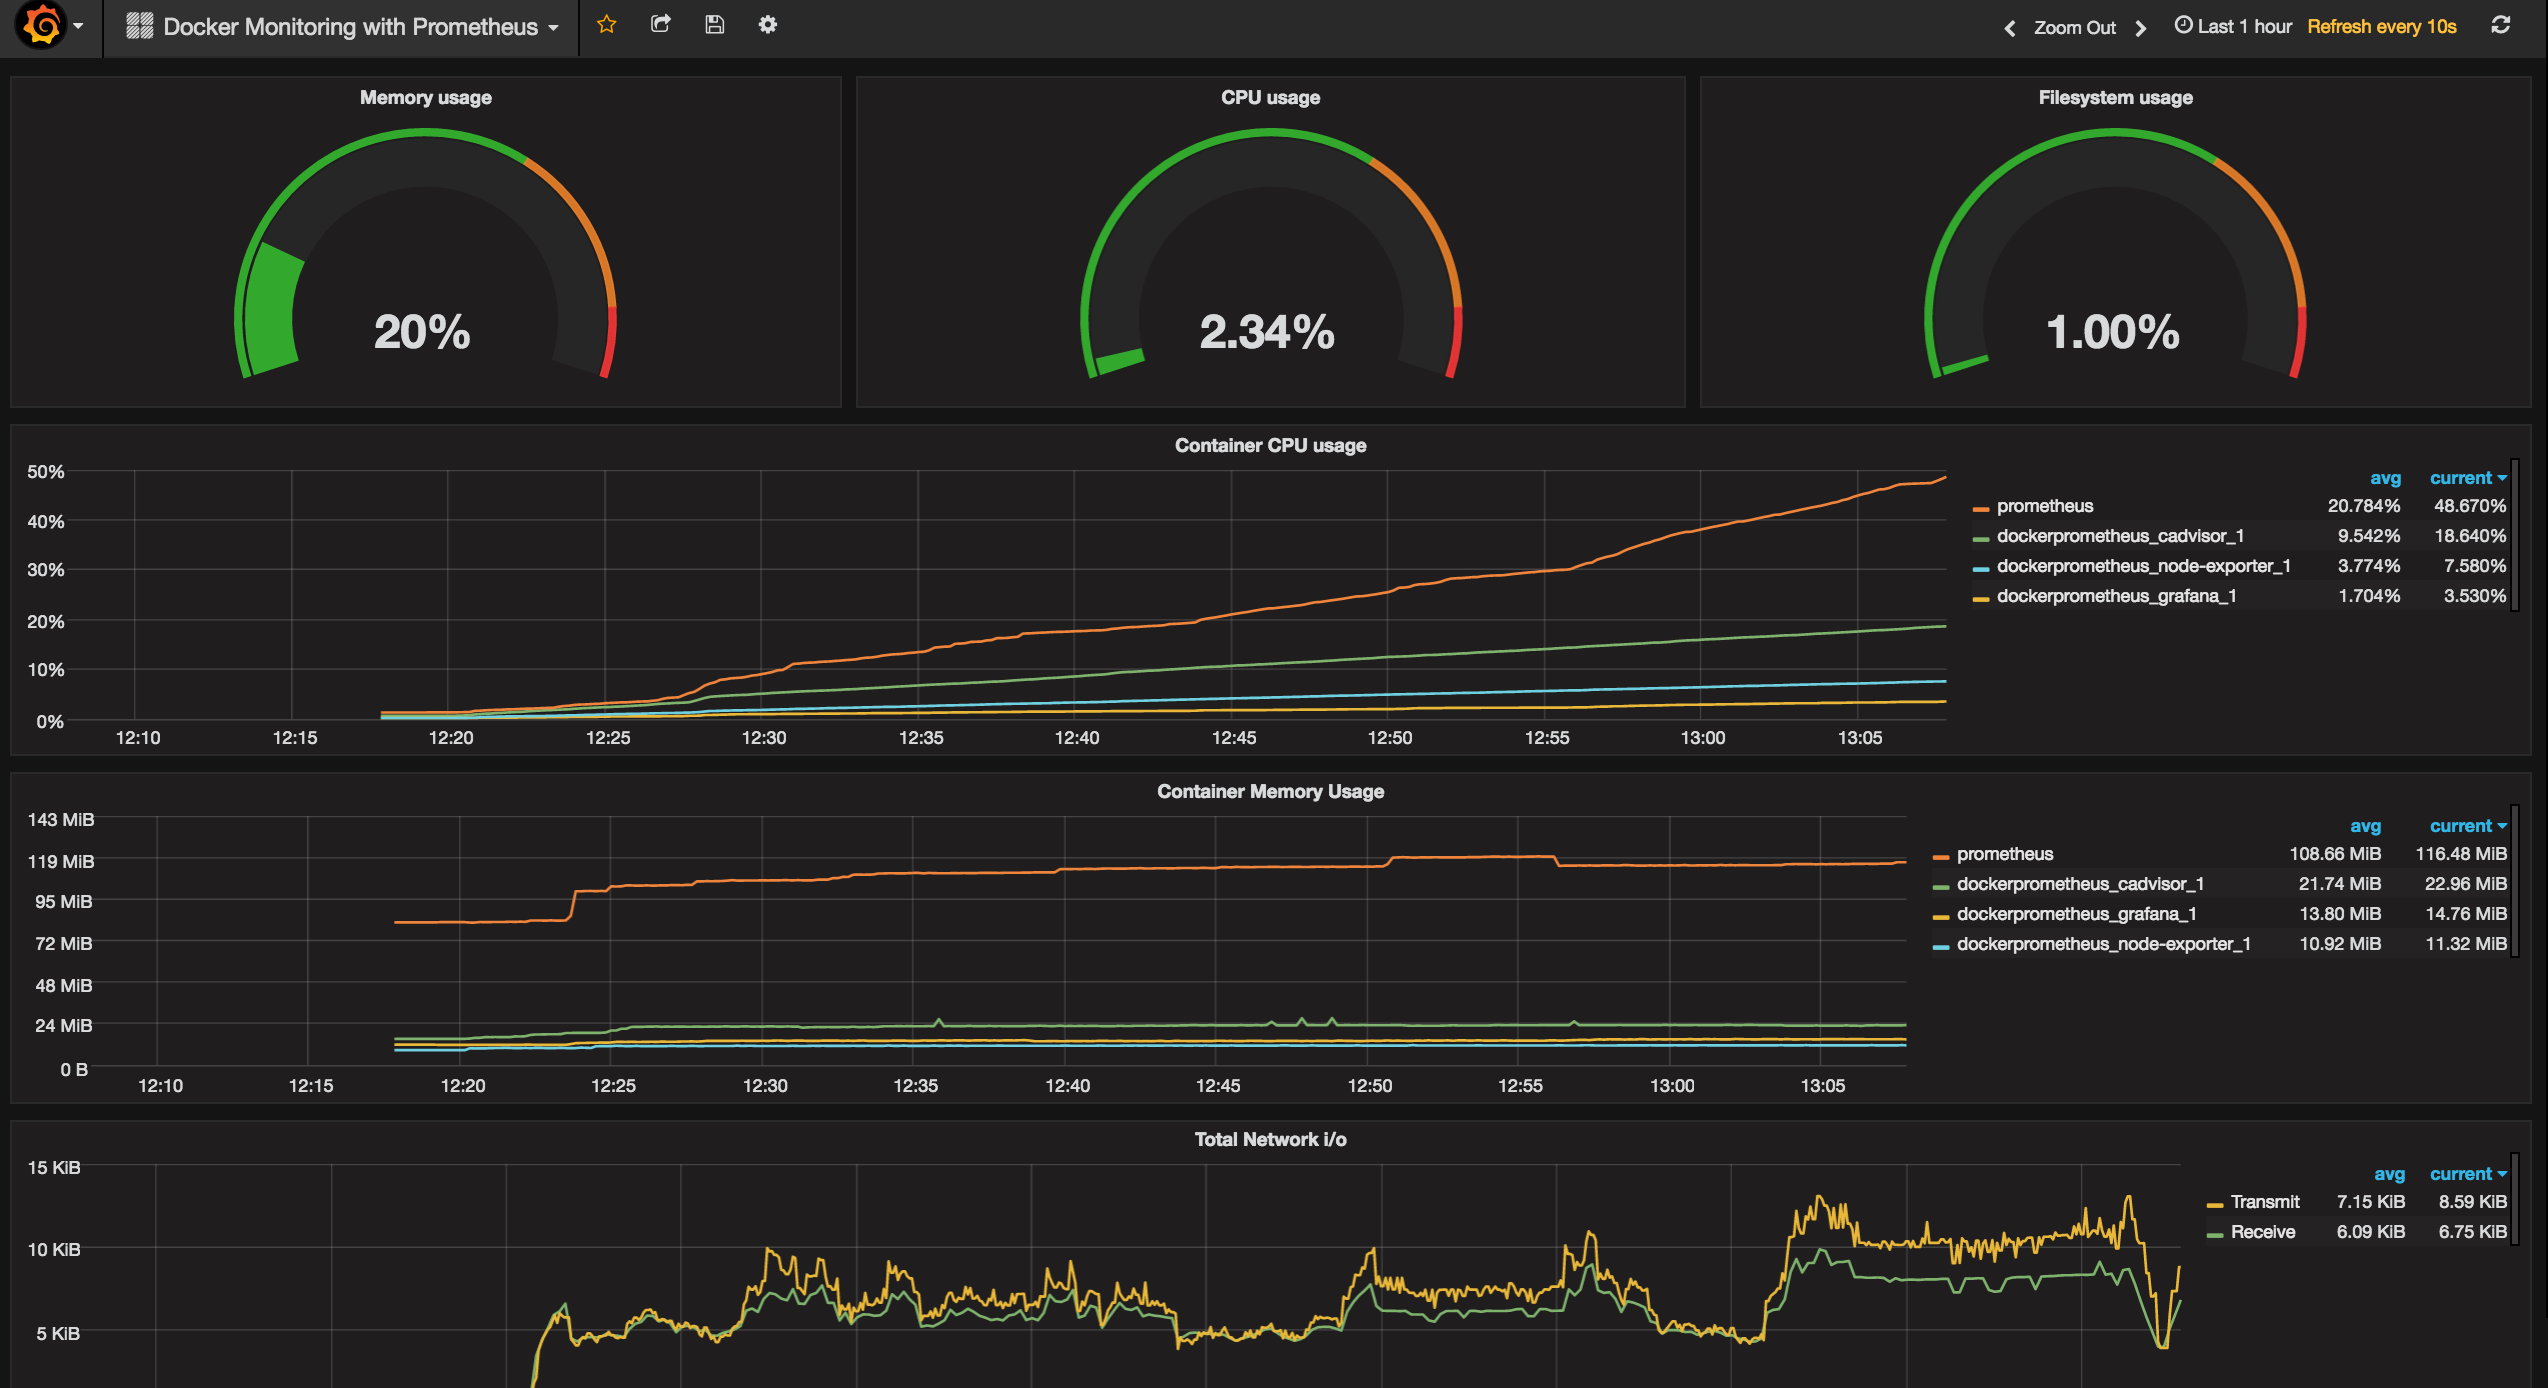
Grafana Dashboard - dashboards/Grafana_Dashboard.json Alerting Dashboard

Alerting

Alerting has been added to the stack with Slack integration. 2 Alerts have been added and are managed

Alerts - prometheus/alert.rules Slack configuration - alertmanager/config.yml

The Slack configuration requires to build a custom integration.

  • Open your slack team in your browser https://<your-slack-team>.slack.com/apps
  • Click build in the upper right corner
  • Choose Incoming Web Hooks link under Send Messages
  • Click on the "incoming webhook integration" link
  • Select which channel
  • Click on Add Incoming WebHooks integration
  • Copy the Webhook URL into the alertmanager/config.yml URL section
  • Fill in Slack username and channel

View Prometheus alerts http://<Host IP Address>:9090/alerts View Alert Manager http://<Host IP Address>:9093

Test Alerts

A quick test for your alerts is to stop a service. Stop the node_exporter container and you should notice shortly the alert arrive in Slack. Also check the alerts in both the Alert Manager and Prometheus Alerts just to understand how they flow through the system.

High load test alert - docker run --rm -it busybox sh -c "while true; do :; done"

Let this run for a few minutes and you will notice the load alert appear. Then Ctrl+C to stop this container.

Add Additional Datasources

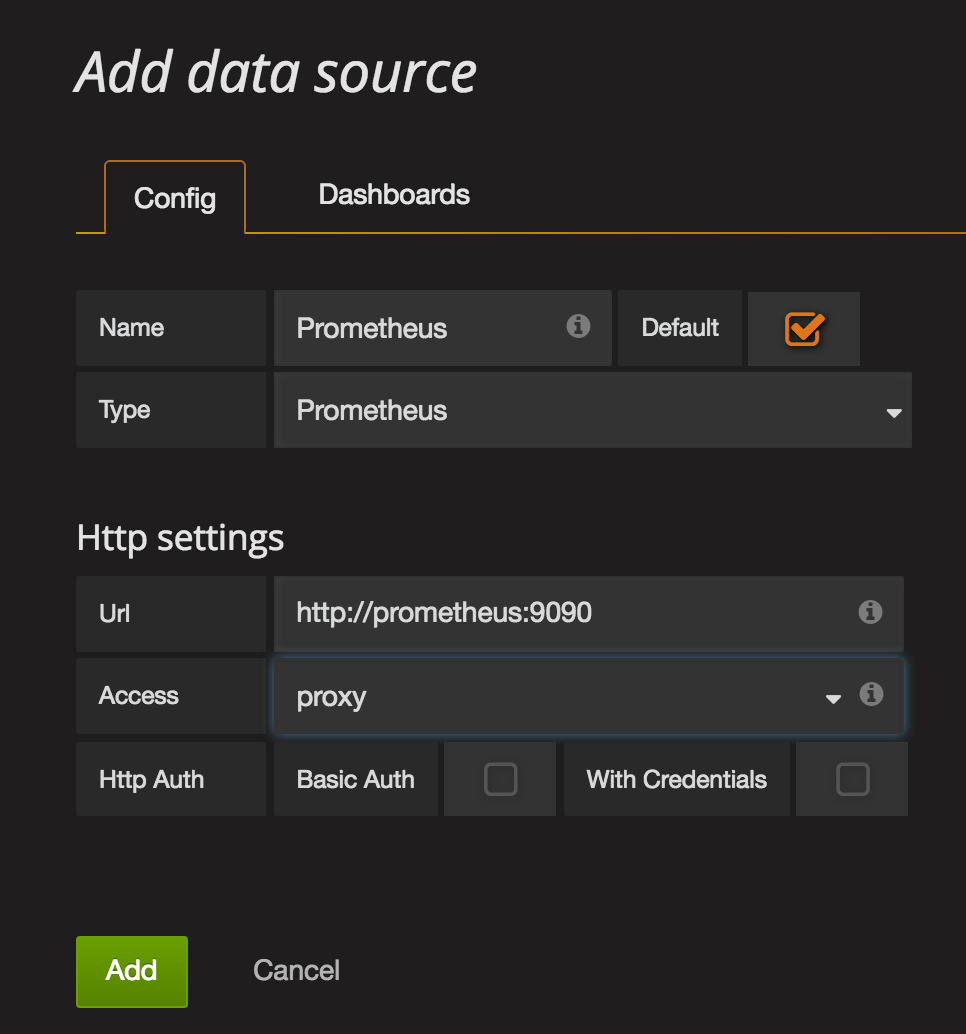
Now we need to create the Prometheus Datasource in order to connect Grafana to Prometheus

  • Click the Grafana Menu at the top left corner (looks like a fireball)
  • Click Data Sources
  • Click the green button Add Data Source.

Ensure the Datasource name Prometheusis using uppercase P

Security Considerations

This project is intended to be a quick-start to get up and running with Docker and Prometheus. Security has not been implemented in this project. It is the users responsability to implement Firewall/IpTables and SSL.

Since this is a template to get started Prometheus and Alerting services are exposing their ports to allow for easy troubleshooting and understanding of how the stack works.

Deploy Prometheus stack with Traefik

Same requirements as above. Swarm should be enabled and the Repo should be cloned to your Docker host.

In the docker-traefik-prometheusdirectory run the following:

docker stack deploy -c docker-traefik-stack.yml traefik

Verify all the services have been provisioned. The Replica count for each service should be 1/1 Note this can take a couple minutes

docker service ls

Prometheus & Grafana now have hostnames

Check the Metrics

Once all the services are up we can open the Traefik Dashboard. The dashboard should show us our frontend and backends configured for both Grafana and Prometheus.

http://localhost:8080

Take a look at the metrics which Traefik is now producing in Prometheus metrics format

http://localhost:8080/metrics

Login to Grafana and Visualize Metrics

Grafana is an Open Source visualization tool for the metrics collected with Prometheus. Next, open Grafana to view the Traefik Dashboards. Note: Firefox doesn't properly work with the below URLS please use Chrome

http://grafana.localhost

Username: admin Password: foobar

Open the Traefik Dashboard and select the different backends available

Note: Upper right-hand corner of Grafana switch the default 1 hour time range down to 5 minutes. Refresh a couple times and you should see data start flowing

Production Security:

Here are just a couple security considerations for this stack to help you get started.

  • Remove the published ports from Prometheus and Alerting servicesi and only allow Grafana to be accessed
  • Enable SSL for Grafana with a Proxy such as jwilder/nginx-proxy or Traefik with Let's Encrypt
  • Add user authentication via a Reverse Proxy jwilder/nginx-proxy or Traefik for services cAdvisor, Prometheus, & Alerting as they don't support user authenticaiton
  • Terminate all services/containers via HTTPS/SSL/TLS

Troubleshooting

It appears some people have reported no data appearing in Grafana. If this is happening to you be sure to check the time range being queried within Grafana to ensure it is using Today's date with current time.

Mac Users

  1. The node-exporter does not run the same as Mac and Linux. Node-Exporter is not designed to run on Mac and in fact cannot collect metrics from the Mac OS due to the differences between Mac and Linux OS's. I recommend you comment out the node-exporter section in the docker-compose.yml file and instead just use the cAdvisor.

  2. If you find after you deploy your project that the prometheus and alertmanager services are in pending status due to "no suitable node" this is due to file system permissions. Be sure to Open Docker for Mac Preferences -> File Sharing Menu and add the following:

Docker for Mac File Sharing Settings

Interesting Projects that use this Repo

Several projects utilize this Prometheus stack. Here's the list of projects:

Have an interesting Project which uses this Repo? Submit yours to the list

prometheus's People

Contributors

arun-gupta avatar bamarni avatar bcueto1 avatar benclapp avatar butlerx avatar chuegel avatar dennari avatar devinnorgarb avatar eduponte avatar elft3r avatar ganiziolek avatar leowinterde avatar llitfkitfk avatar mabouchacra avatar maxandersen avatar minac avatar moshe avatar olevett avatar pablocastellano avatar paul-wiz avatar philicious avatar phill-tornroth avatar rifi2k avatar sebastianrzk avatar sobolevn avatar stianlagstad avatar useername avatar vegasbrianc avatar wfhu avatar yayitswei avatar

Stargazers

 avatar  avatar  avatar  avatar  avatar  avatar  avatar  avatar  avatar  avatar  avatar  avatar  avatar  avatar  avatar  avatar  avatar  avatar  avatar  avatar  avatar  avatar  avatar  avatar  avatar  avatar  avatar  avatar  avatar  avatar  avatar  avatar  avatar  avatar  avatar  avatar  avatar  avatar  avatar  avatar  avatar  avatar  avatar  avatar  avatar  avatar  avatar  avatar  avatar  avatar  avatar  avatar  avatar  avatar  avatar  avatar  avatar  avatar  avatar  avatar  avatar  avatar  avatar  avatar  avatar  avatar  avatar  avatar  avatar  avatar  avatar  avatar  avatar  avatar  avatar  avatar  avatar  avatar  avatar  avatar  avatar  avatar  avatar  avatar  avatar  avatar  avatar  avatar  avatar  avatar  avatar  avatar  avatar  avatar  avatar  avatar  avatar  avatar  avatar  avatar

Watchers

 avatar  avatar  avatar  avatar  avatar  avatar  avatar  avatar  avatar  avatar  avatar  avatar  avatar  avatar  avatar  avatar  avatar  avatar  avatar  avatar  avatar  avatar  avatar  avatar  avatar  avatar  avatar  avatar  avatar  avatar  avatar  avatar  avatar  avatar  avatar  avatar  avatar  avatar  avatar  avatar  avatar  avatar  avatar  avatar  avatar  avatar  avatar  avatar  avatar  avatar  avatar  avatar  avatar  avatar  avatar  avatar  avatar  avatar  avatar  avatar  avatar  avatar  avatar  avatar  avatar  avatar  avatar  avatar  avatar  avatar  avatar  avatar  avatar  avatar  avatar  avatar  avatar  avatar  avatar  avatar  avatar  avatar  avatar  avatar  avatar  avatar  avatar  avatar  avatar  avatar  avatar  avatar  avatar  avatar

prometheus's Issues

no container data in grafana

The grafana page doesnt show any containers and their metrics, i see below in docker-compose logs, I think the cAdvisor isn't getting connected to Prometheus and Prometheus to alertmanager?

cAdvisor

cadvisor_1 | I0410 15:58:42.820865 1 manager.go:204] Version: {KernelVersion:3.10.0-327.22.2.el7.x86_64 ContainerOsVersion:Alpine Linux v3.4 DockerVersion:1.10.2 CadvisorVersion:v0.25.0 CadvisorRevision:17543be}
cadvisor_1 | E0410 15:58:42.981201 1 factory.go:305] devicemapper filesystem stats will not be reported: RHEL/Centos 7.x kernel version 3.10.0-366 or later is required to use thin_ls - you have "3.10.0-327.22.2.el7.x86_64"
cadvisor_1 | I0410 15:58:42.981217 1 factory.go:309] Registering Docker factory
cadvisor_1 | W0410 15:58:42.981232 1 manager.go:247] Registration of the rkt container factory failed: unable to communicate with Rkt api service: rkt: cannot tcp Dial rkt api service: dial tcp [::1]:15441: getsockopt: connection refused
cadvisor_1 | I0410 15:58:42.981238 1 factory.go:54] Registering systemd factory
cadvisor_1 | I0410 15:58:42.982490 1 factory.go:86] Registering Raw factory
cadvisor_1 | I0410 15:58:42.983724 1 manager.go:1106] Started watching for new ooms in manager
cadvisor_1 | W0410 15:58:42.988083 1 manager.go:275] Could not configure a source for OOM detection, disabling OOM events: unable to find any kernel log file available from our set: [/var/log/kern.log /var/log/messages /var/log/syslog]
cadvisor_1 | I0410 15:58:42.988568 1 manager.go:288] Starting recovery of all containers
cadvisor_1 | I0410 15:58:45.808465 1 manager.go:293] Recovery completed
cadvisor_1 | I0410 15:58:46.091781 1 cadvisor.go:157] Starting cAdvisor version: v0.25.0-17543be on port 8080

Prometheus

prometheus_1 | time="2017-04-10T17:58:43+02:00" level=info msg="Starting target manager..." source="targetmanager.go:61"
prometheus_1 | time="2017-04-10T17:58:52+02:00" level=error msg="Error sending alerts: Post http://127.0.0.1:9093/api/v1/alerts: dial tcp 127.0.0.1:9093: getsockopt: connection refused" alertmanager="http://127.0.0.1:9093/api/v1/alerts" count=2 source="notifier.go:335"

version: '2'

volumes:
    prometheus_data: {}
    grafana_data: {}

services:
  prometheus:
    image: my/prometheus-1.5:1.0
    container_name: prometheus_prometheus
    volumes:
      - ./prometheus/:/etc/prometheus/
      - prometheus_data:/prometheus
    command:
      - '-config.file=/etc/prometheus/prometheus.yml'
      - '-storage.local.path=/prometheus'
      - '-alertmanager.url=http://127.0.0.1:9093'
    expose:
      - 9090
    ports:
      - 9090:9090
    links:
      - cadvisor:cadvisor
      - alertmanager:alertmanager
    depends_on:
      - cadvisor
    environment:
      - TZ=Europe/Amsterdam

  node-exporter:
    image: my/nodeexporter-0.13:1.0
    expose:
      - 9100
    environment:
      - TZ=Europe/Amsterdam

  alertmanager:
    image: my/alertmanager-0.5:1.0
    ports:
      - 9093:9093
    volumes:
      - ./alertmanager/:/etc/alertmanager/
    environment:
      - TZ=Europe/Amsterdam
    command:
      - '-config.file=/etc/alertmanager/config.yml'
      - '-storage.path=/alertmanager'

  cadvisor:
    image: my/cadvisor-0.25:1.0
    volumes:
      - /:/rootfs:ro
      - /var/run:/var/run:rw
      - /sys:/sys:ro
      - /var/lib/docker/:/var/lib/docker:ro
    environment:
      - TZ=Europe/Amsterdam

  grafana:
    image: my/grafana-4.2:1.0
    depends_on:
      - prometheus
    ports:
      - 3000:3000
    volumes:
      - grafana_data:/var/lib/grafana
      - ./grafana/:/etc/grafana
    env_file:
      - config.monitoring
    environment:
      - TZ=Europe/Amsterdam

The Images are custom built but they are exactly the same as your Images.

docker ps
CONTAINER ID        IMAGE                       COMMAND                  CREATED             STATUS              PORTS                                         NAMES
62d9785ec8c8        my/grafana-4.2:1.0         "/run.sh"                9 minutes ago       Up 9 minutes        0.0.0.0:3000->3000/tcp                        prometheus_grafana_1
b78bb8fa657f        my/prometheus-1.5:1.0      "/bin/prometheus -con"   9 minutes ago       Up 9 minutes        0.0.0.0:9090->9090/tcp                        prometheus_prometheus
0985079d6cf6        my/cadvisor-0.25:1.0       "/usr/bin/cadvisor -l"   9 minutes ago       Up 9 minutes        8484/tcp                                      prometheus_cadvisor_1
4529aad6df65        my/nodeexporter-0.13:1.0   "/bin/node_exporter"     9 minutes ago       Up 9 minutes        9100/tcp                                      prometheus_node-exporter_1
15e918bb1c77        my/alertmanager-0.5:1.0    "/bin/alertmanager -c"   9 minutes ago       Up 9 minutes        0.0.0.0:9093->9093/tcp                        prometheus_alertmanager_1
uname -a
Linux LV24353 3.10.0-327.22.2.el7.x86_64 #1 SMP Thu Jun 9 10:09:10 EDT 2016 x86_64 x86_64 x86_64 GNU/Linux
Docker info
Containers: 23
 Running: 21
 Paused: 0
 Stopped: 2
Images: 24
Server Version: 1.10.2
Storage Driver: devicemapper
 Pool Name: docker-253:1-946996-pool
 Pool Blocksize: 65.54 kB
 Base Device Size: 10.74 GB
 Backing Filesystem: xfs
 Data file: /dev/vg-docker/data
 Metadata file: /dev/vg-docker/metadata
 Data Space Used: 6.647 GB
 Data Space Total: 96.64 GB
 Data Space Available: 89.99 GB
 Metadata Space Used: 12.82 MB
 Metadata Space Total: 4.295 GB
 Metadata Space Available: 4.282 GB
 Udev Sync Supported: true
 Deferred Removal Enabled: false
 Deferred Deletion Enabled: false
 Deferred Deleted Device Count: 0
 Library Version: 1.02.107-RHEL7 (2016-06-09)
Execution Driver: native-0.2
Logging Driver: json-file
Plugins:
 Volume: local
 Network: host bridge null
Kernel Version: 3.10.0-327.22.2.el7.x86_64
Operating System: Red Hat Enterprise Linux Server 7.2 (Maipo)
OSType: linux
Architecture: x86_64
CPUs: 4
Total Memory: 31.26 GiB
Name: slacrr088.th.oam.org
ID: 6UYW:X77S:APBC:IYB5:5ZIT:IK7G:YOZJ:5U4N:XUHH:IPNE:S4DX:36BB
WARNING: bridge-nf-call-iptables is disabled
WARNING: bridge-nf-call-ip6tables is disabled

appreciate your help!

Thanks!

Off topic : How do prometheus justify running so many containers?

Hey guys,

If there are 10 different services running on one of our server, then we need 10 different exporters to collect the metrics from.

Which means 20 container will run over there.

If we use collectd with influx then it's just one collectd running over client.

How prometheus justify running these many containers from resource utilization/security point of view ?

data retention

Hello

I'm new to all this, I was wondering how long the data retention is, and where can I change that?

btw Great project, works really well,

Thanks!

Monitoring local machine instead of container?

This is all a super nicely packaged Grafana/Prometheus setup which is up and running in no time. 👍

I was just wondering if you think it's possible to make this monitor the local machine's resources rather than the container's?

For example, perhaps running the node exporter container in privileged mode could enable something like this?
I personally would be interested in doing this on CentOS 7.

What do you think?

Finding nodes to scrape

Hi,
I was looking around at how to get prometheus and cadvisor going on swarm mode and came across your version-2 branch. Just wondering: how does prometheus know/fetch the list of nodes in the cluster in order to scrape them?

Edit:

Shortly after I came across this: https://grafana.com/dashboards/609
I guess I'd need to do the same in prometheus.yml:

...
scrape_configs:
  - job_name: 'cadvisor'
    dns_sd_configs:
    - names:
      - 'tasks.cadvisor'
      type: 'A'
      port: 8080

  - job_name: 'node-exporter'
    dns_sd_configs:
    - names:
      - 'tasks.node-exporter'
      type: 'A'
      port: 9100

prometheus query

Thanks for your share about docker monitoring.
Howerver when I use prometheus to monitor container.
I can't draw the beautiful dash in promdash.This need prometheus query,isn't it?
I just want to show the basic cpu, memory and harddisk consumem, but don't know how to write prom query .
Can you give me some examples?

Support for pushgateway

Hi guys,

Few of our servers are behind firewall.

So we are thinking of Push gateway.

Does this project include Pushgateway ??

Attach another nodes_exporters

I added more targets in prometheus.yml file, but however Grafana graph is still not show these nodes. The nodes that are running on those hosts are 'node_exporters'. They appears in "targets" but Grafana does not present their results (only shows the natives). I'm having the wrong approach?

Thanks

No data displayed for AWS ECS containers

Hi,

I set this up on AWS ECS container instance, but did not get any data for containers running in Grafana dashboard that you have shared.
Does this stack work with AWS ECS containers? i am looking at some way to monitor individual containers running in ECS.

Container is up, but prometheus dashboard is not loading

Hi all,

I executed docker-compose up -d

and containers are successfully running as below.

[root@puppet-master prometheus]# docker ps
CONTAINER ID IMAGE COMMAND CREATED STATUS PORTS NAMES
4adbf2bb8588 grafana/grafana "/run.sh" 13 hours ago Up 5 minutes 0.0.0.0:3000->3000/tcp prometheus_grafana_1
2a0b413923db prom/node-exporter "/bin/node_exporter -" 14 hours ago Up 5 minutes 9100/tcp node-exporter
af2ce4e63ca2 google/cadvisor "/usr/bin/cadvisor -l" 14 hours ago Up 5 minutes 8080/tcp prometheus_cadvisor_1

However when i tried to open page, http://localhost:9090 or http://localhost:9093 then page is not loading (refused to connect error is triggering).

Thanks for any help !!

Collaboration on the project

Hello @philicious @llitfkitfk @paul-wiz

I'm looking volunteers to help me manage this project. I would really appreciate any help you guys can offer and add you as maintainers to the project.

Since this project has gained quite some popularity it would be great to continue adding new features to the stack.

Please let me know.

Thanks Brian

Is node_filesystem possible

I would like to be able to see my entire file system not just the container usage. The following metric returns NA.

100 *(1 - (node_filesystem_free{ filesystem="/"} / node_filesystem_size{ filesystem="/"}) )

Is there a way to fix this?

Container memory usage 0B

Cloned your git, used docker-compose, added the source and imported the template and everything seems okay however:

every container has a memory usage of 0B,
the total network I/O seems.. incorrect (unless this is only docker network IO?)

cannot start prometheus and alertmanager

I followed the instruction, which is just docker-compose up -d. However, there are two components not starting correctly.

[root@142 prometheus]# docker ps
CONTAINER ID        IMAGE                COMMAND                  CREATED             STATUS              PORTS                    NAMES
64704c0d0952        grafana/grafana      "/run.sh"                15 minutes ago      Up 24 seconds       0.0.0.0:3000->3000/tcp   prometheus_grafana_1
12072d946e76        prom/node-exporter   "/bin/node_exporter -"   15 minutes ago      Up 26 seconds       9100/tcp                 node-exporter
034643c867fb        google/cadvisor      "/usr/bin/cadvisor -l"   15 minutes ago      Up 27 seconds       8080/tcp                 prometheus_cadvisor_1

Env:

Centos 7.3.1611

[root@142 prometheus]# docker version
Client:
Version: 1.12.6
API version: 1.24
Package version: docker-common-1.12.6-16.el7.centos.x86_64
Go version: go1.7.4
Git commit: 3a094bd/1.12.6
Built: Fri Apr 14 13:46:13 2017
OS/Arch: linux/amd64

Server:
Version: 1.12.6
API version: 1.24
Package version: docker-common-1.12.6-16.el7.centos.x86_64
Go version: go1.7.4
Git commit: 3a094bd/1.12.6
Built: Fri Apr 14 13:46:13 2017
OS/Arch: linux/amd64

[root@142 prometheus]# docker-compose -v
docker-compose version 1.13.0, build 1719ceb

Deprecated services

Hi,
while re-evaluating stacks, I also came across your repo.

You might already be aware but I wanted to mention it as your repo is the first and only one that turns up when googling for "prometheus docker-compose" and is therefore likely a source for quite some people I guess:

If you are interested, I could PR changes to it as I have them.

Cheers :)

Filtering docker containers to be monitored

Hello.

TASK: Monitor docker_container built from several images

Query for monitoring particular container:
sort_desc(sum by (name) (rate(container_network_receive_bytes_total{name="node-exporter"}[1m] ) ))
It works as expected, showing data of particular container.
image

Same goes for query that filters all containers built from particular image:
sort_desc(sum by (name) (rate(container_network_receive_bytes_total{image="ubuntu"}[1m] ) ))
In my case it returned metrics of 3 parallel running ubuntu containers derived from one image.

PROBLEM START HERE
I want to build metrics for "prometheus" and "node-exporter" container, the query does not show any error, yet there are no visualization.
sort_desc(sum by (name) (rate(container_network_receive_bytes_total{name="node-exporter", name="prometheus"}[1m] ) ))
image

does this make sense?

The observation system takes the bulk of the resources - see screenshot 1. I'm afraid it does not make sense in my setting with 1 GB RAM.

prom2

Things may look differently on bigger machines with more load, though.

Also, the insight I got from prometheus isn't reflected in grafana (screenshot 2). How come?

prom1

cAdvisor problem with CentOS7

First of all: Great Project. Thanks.

Running on my server lead to following issue:
cadvisor_1 | F0929 08:57:13.605754 1 cadvisor.go:151] Failed to start container manager: inotify_add_watch /sys/fs/cgroup/cpuacct,cpu: no such file or directory

This seems to be a known problem with CentOS7 and cAdvisor: google/cadvisor#1444.

i will try to get the fix (newer version of cAdvisor if possible) and comment here.

Is this possible to use CollectD as exporter

Hey,

Is it possible to use CollectD as exporter ?

I mean, CollectD only collects the data from remote server and push that to Prometheus server.

This way we have implement Push concept without using push gateway

Best practice for "swarm mode"

Thanks for this bundle.
following up on #4 , what would be the best way to set this stack up on the swarm mode in docker 1.12?
should all services be duplicated on all nodes?
or
should only cAdvisor be duplicatied on all nodes,
i.e make cAdvisor the only "global" service in docker 1.12 term words.

getsockopt: connection refused

I'm getting below error on Linux VM, but it works fine on my Docker toolbox, any idea what I'm missing here?

getsockopt: connection refused" alertmanager="http://localhost:9093/api/v1/alerts" count=1 source="notifier.go:335"

docker-compose.yml (have built the images with Docker official images, to avoid CVE)

version: '2'

volumes:
    prometheus_data: {}
    grafana_data: {}

services:
  prometheus:
    image: my/prometheus:0.1
    container_name: prometheus
    volumes:
      - ./prometheus/:/etc/prometheus/
      - prometheus_data:/prometheus
    command:
      - '-config.file=/etc/prometheus/prometheus.yml'
      - '-storage.local.path=/prometheus'
      - '-alertmanager.url=http://localhost:9093'
    expose:
      - 9090
    ports:
      - 9090:9090
    links:
      - cadvisor:cadvisor
      - alertmanager:alertmanager
    depends_on:
      - cadvisor
    networks:
      - head-end

  node-exporter:
    image: my/nodeexporter:0.1
    expose:
      - 9100
    networks:
      - head-end
  alertmanager:
    image: my/alertmanager:0.1
    ports:
      - 9093:9093
    volumes:
      - ./alertmanager/:/etc/alertmanager/
    networks:
      - head-end
    command:
      - '-config.file=/etc/alertmanager/config.yml'
      - '-storage.path=/alertmanager'

  cadvisor:
    image: my/cadvisor:0.1
    volumes:
      - /:/rootfs:ro
      - /var/run:/var/run:rw
      - /sys:/sys:ro
      - /var/lib/docker/:/var/lib/docker:ro
    expose:
      - 8080
    networks:
      - head-end

  grafana:
    image: my/grafana:0.1
    depends_on:
      - prometheus
    ports:
      - 3000:3000
    volumes:
      - grafana_data:/var/lib/grafana
    env_file:
      - config.monitoring
    networks:
      - head-end

networks:
  head-end:
    external: true

uname -a

Linux my_VM_1 3.10.0-327.28.3.el7.x86_64 #1 SMP Fri Aug 12 13:21:05 EDT 2016 x86_64 x86_64 x86_64 GNU/Linux

docker info

$ docker info
Containers: 51
 Running: 0
 Paused: 0
 Stopped: 51
Images: 43
Server Version: 1.12.3
Storage Driver: aufs
 Root Dir: /mnt/sda1/var/lib/docker/aufs
 Backing Filesystem: extfs
 Dirs: 214
 Dirperm1 Supported: true
Logging Driver: json-file
Cgroup Driver: cgroupfs
Plugins:
 Volume: local
 Network: bridge null host overlay
Kernel Version: 4.4.27-boot2docker
Operating System: Boot2Docker 1.12.3 (TCL 7.2); HEAD : 7fc7575 - Thu Oct 27 17:23:17 UTC 2016
OSType: linux
Architecture: x86_64
CPUs: 1
Total Memory: 995.8 MiB
Name: default
ID: JKBA:5AR4:KNKG:WG53:O7FX:2JWF:AHWT:UGZZ:2GE3:VKUG:IO7Z:3KWO
Docker Root Dir: /mnt/sda1/var/lib/docker
Debug mode (client): false
Debug mode (server): true
 File Descriptors: 13
 Goroutines: 23
 System Time: 2017-02-06T11:10:21.423187477Z
 EventsListeners: 0
Registry: https://index.docker.io/v1/
Labels:
 provider=virtualbox

appreciate the help!

Thanks,
Mahesh

No data issue: Due to dashboard config

Hey,

Ran into the issue that I couldn't see any data. How about you update the JSON file with the time settings adjusted to:

      "time": {
            "from": "now/d",
            "to": "now"
      },

Prometheus taking too much disk space

Hi guys,

We have been using Prometheus from past 2 weeks.

Total 100 hosts we are monitoring.

But prometheus_data file is consuming nearly 200 GB already.

Is there any way to compress the data ?

Prometheus doesn't resolve proper ips

Two of the three targets fail. Any idea why this might happen?
Get http://cadvisor:8080/metrics: dial tcp 192.64.119.254:8080: getsockopt: connection refused
Get http://node-exporter:9100/metrics: dial tcp 192.64.119.254:9100: getsockopt: connection refused

Consoles not accessible

I´m trying to access /consoles/node.html but it seems those files are missing in the container

open consoles/node.html: no such file or directory

Any idea how to fix this? Thx

Permission denied on statfs()

When I start docker-composer on log output I see a bunch of error every time metrics was called from prometeus. The error was permissions denied:

node-exporter_1 | time="2017-10-17T10:40:38Z" level=error msg="Error on statfs() system call for \"/rootfs/run/docker/netns/default\": permission denied" source="filesystem_linux.go:57"

node-exporter_1 | time="2017-10-17T10:40:38Z" level=error msg="Error on statfs() system call for \"/rootfs/var/lib/docker/overlay2/38801ac617091d009b3767fffd86acf3c3a8bd676065ed13ee04826cd2294a5e/merged\": permission denied" source="filesystem_linux.go:57"
There is a solution for this? I run docker-compose on debian 9

No data displayed... because of timezone mismatch between grafana and cAdvisor

Hi guys,

I have encountered the same symptom as a few earlier: no data displayed in my grafana dashboard.

When looking closer, I found out that grafana was using the timezone of my Mac (UTC) whereas cAdvisor was pushing its metrics with a 9:30 hours shift...

Therefore, data appears on Grafana... but in the past.. :)

Do you know any way to fix this ?

I have post a question on cAdvisor (google/cadvisor#1562) but may be you know faster ^^

Cheers
Manu

Incompatible with prom/prometheus:latest

Expected Behaviour

docker swarm deploy -c docker-compose.yml prom should deploy and start up everything.

Current Behaviour

The prometheus container fails to start with Error parsing commandline arguments: unknown short flag '-c'

Possible Solution

It looks like a new prometheus image was pushed very recently that includes many breaking changes w.r.t. command line flags and config file formats.

  1. Lock the prom/prometheus image to :v1.8.2 in docker-compose.yml
  2. Update docker-compose.yml as well as all the config files to work with prometheus 2

Steps to Reproduce (for bugs)

Provide a link to a live example, or steps to reproduce this bug. Include code to reproduce, if relevant:

  1. docker swarm deploy -c docker-compose.yml prom
  2. Observe errors in the prometheus container

Your Environment

Include as many relevant details about the environment you experienced the bug in

  • Docker version docker version (e.g. Docker 17.0.05 ): Docker 17.09.0-ce

  • Operating System and version (e.g. Linux, Windows, MacOS): Ubuntu 16.04

docker-compose up -d not working

Hi,

I cloned this project and commented "alertmanager everywhere" and ran docker-compose command.

But this is not working.

[root@server prometheus]# docker-compose up -d
Removing prometheus
node-exporter is up-to-date
Starting prometheus_cadvisor_1
Recreating b835cf9227e5_b835cf9227e5_b835cf9227e5_b835cf9227e5_b835cf9227e5_b835cf9227e5_b835cf9227e5_prometheus

ERROR: for prometheus Cannot start service prometheus: driver failed programming external connectivity on endpoint prometheus (c2f016e1a5694a7b57bdff244e0e5355b5d1f569887d4b4ae4d3368b553a92ab): Error starting userland proxy: listen tcp 0.0.0.0:9090: bind: address already in use
ERROR: Encountered errors while bringing up the project.

Thanks for any help !!

Grafana taking too much time to load

Hi guys,

I'm currently maintaining 100 servers.

When we tried to load graph, its taking too much time to load.

Do we need to change any configuration to improve the performance

Thanks,

Comprehension question: how to define the targets

Installation worked like a breeze, thank you very much. My Amazon EC2 instance shows an impressive dashboard -- with no data.

My naïve idea was that I could see what was happening on this instance, at best right away.

On this Ubuntu instance are running quite a number of docker containers which provide a service accessible via browser: in this case for example Apache + PHP and MySQL-replication with load-balancing via HAProxy. How do I get the data from these into my dashboard?

I changed the line

- targets: ['localhost:9090','cadvisor:8080','node-exporter:9100']

in prometheus/prometheus.yml in several ways, to no avail, like adding 'localhost:80' or 'my_ip:80'.

I also tried to copy from templates found elsewhere, adding the respecting sections and adjusting accordingly, but I had no luck either.

What am I missing here? Of course, the other containers run in a different network. Is this the culprit?

Using this with docker-cloud

Hi Brian

Loving the software, worked like a dream in my local docker.

I'm now attempting to port your docker-compose.yml file over to a docker-cloud stack file, and also add the files needed to my node on AWS so I can use this software.

https://docs.docker.com/docker-cloud/apps/stack-yaml-reference/

I think I'm nearly there.

I'll attach what I've got so far for the stack file.

I can browse to the grafana URL, and add the prometheus data source on http://prometheus-stage:9090

The problem I am getting however is that after adding a docker dashboard, I'm not seeing any containers like I did locally.

I'm pretty sure it's something daft I've done.

The cadvisor-stage container is throwing alot of errors, I'll paste them into another file and upload that.

It looks like I've done something wrong with the paths in the stack file, as it can't find things, or is having a problem with printf.

Here's an excerpt of the error file attached as cadvisor_error.txt

cmd [find /rootfs/var/lib/docker/aufs/diff/090768c0a2bedd4953e63397683794b40f0fa08ab2653b0dc50f7d1923e9a047 -xdev -printf .] failed. stderr: find: unrecognized: -printf

that /rootfs/ at the start of the line is wrong

makes me think I've done something wrong in the volumes section of the cadvisor-stage service

cadvisor-stage:
image: google/cadvisor
volumes:
- /:/rootfs:ro
- /var/run:/var/run:rw
- /sys:/sys:ro
- /var/lib/docker/:/var/lib/docker:ro

prom-dockercloud-stack.txt

cadvisor_error.txt

I know your busy, but if there's any chance you could take a peak at this for me, I'll be very grateful.

I'd have no qualms in adding the docker-cloud version of your stack file to your repo, once we sort it out, for others to use in the future.

Speak soon

Matt

Does not work in a docker swarm

I installed this on my docker-swarm test installation.
This ends in docker-compose up hanging, and port 9090 not being available:

MacBook-Air:prometheus raarts$ docker-compose up
Starting prometheus_promdash_1
Starting prometheus_sqlite3_1
Starting prometheus_cadvisor_1
Starting prometheus_exporter_1
Creating prometheus_prometheus_1

ERROR: for prometheus  Unable to find a node that satisfies the following conditions
[port 9090 (Bridge mode)]
[available container slots]

end a little bit further down:

cadvisor_1    | I0505 16:13:54.868093       1 manager.go:277] Starting recovery of all containers
cadvisor_1    | I0505 16:13:54.881033       1 manager.go:282] Recovery completed
cadvisor_1    | I0505 16:13:54.889681       1 cadvisor.go:148] Starting cAdvisor version: 0.23.0-750f18e on port 8080
prometheus_sqlite3_1 exited with code 0
Exception in thread Thread-10:
Traceback (most recent call last):
  File "threading.py", line 810, in __bootstrap_inner
  File "threading.py", line 763, in run
  File "compose/cli/log_printer.py", line 190, in watch_events
  File "compose/project.py", line 345, in events
KeyError: u'status'

and here docker-compose up just hangs forever. ^C and then starting results in an incomplete install.
BTW, all containers ended up on separate hosts.. that may have something to do with it.

Can not select the host statistics container

  After checking the node host, but can not display the node host resources and the host running the container. I would like to achieve by checking the host to show the host running the container, and the consumption of resources.
  Finally thank you for your contribution!

cannot display data

System environment:
cat /etc/system-release
CentOS Linux release 7.2.1511 (Core)

docker -v
Docker version 1.12.0, build 8eab29e

/usr/local/bin/docker-compose -v
docker-compose version 1.8.0, build f3628c7

40845239408f        grafana/grafana        "/run.sh"                25 minutes ago      Up 25 minutes       0.0.0.0:3000->3000/tcp   prometheus_grafana_1
f8b7d6239ffd        prom/prometheus        "/bin/prometheus -con"   25 minutes ago      Up 25 minutes       0.0.0.0:9090->9090/tcp   prometheus
84e34bb4be8e        prom/alertmanager      "/bin/alertmanager -c"   25 minutes ago      Up 25 minutes       0.0.0.0:9093->9093/tcp   prometheus_alertmanager_1
05fee485589d        prom/node-exporter     "/bin/node_exporter"     25 minutes ago      Up 25 minutes       9100/tcp                 prometheus_node-exporter_1
f45b2c6806b0        google/cadvisor        "/usr/bin/cadvisor -l"   25 minutes ago      Up 25 minutes       8080/tcp                 prometheus_cadvisor_1

import Grafana_Dashboard.json

but,cannot display data!

Uneeded dependency on node_collector for System Memory and CPU usage?

I don't have any node applications so decided to try and come up with metrics queries to pull system usage with only cAdvisor and came up with the following.

For memory:

sum (container_memory_usage_bytes{id="/"}) / sum (machine_memory_bytes) * 100

For CPU:

sum ( rate(container_cpu_usage_seconds_total{id="/"}[1m] ) ) / sum (machine_cpu_cores) * 100

I'm new to all of this though (cAdvisor, Prometheus, Grafana) so not sure if this is wrong for some reason I'm not aware of yet.

Recommend Projects

  • React photo React

    A declarative, efficient, and flexible JavaScript library for building user interfaces.

  • Vue.js photo Vue.js

    🖖 Vue.js is a progressive, incrementally-adoptable JavaScript framework for building UI on the web.

  • Typescript photo Typescript

    TypeScript is a superset of JavaScript that compiles to clean JavaScript output.

  • TensorFlow photo TensorFlow

    An Open Source Machine Learning Framework for Everyone

  • Django photo Django

    The Web framework for perfectionists with deadlines.

  • D3 photo D3

    Bring data to life with SVG, Canvas and HTML. 📊📈🎉

Recommend Topics

  • javascript

    JavaScript (JS) is a lightweight interpreted programming language with first-class functions.

  • web

    Some thing interesting about web. New door for the world.

  • server

    A server is a program made to process requests and deliver data to clients.

  • Machine learning

    Machine learning is a way of modeling and interpreting data that allows a piece of software to respond intelligently.

  • Game

    Some thing interesting about game, make everyone happy.

Recommend Org

  • Facebook photo Facebook

    We are working to build community through open source technology. NB: members must have two-factor auth.

  • Microsoft photo Microsoft

    Open source projects and samples from Microsoft.

  • Google photo Google

    Google ❤️ Open Source for everyone.

  • D3 photo D3

    Data-Driven Documents codes.