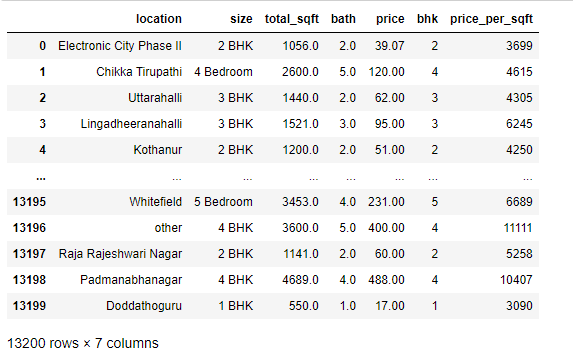
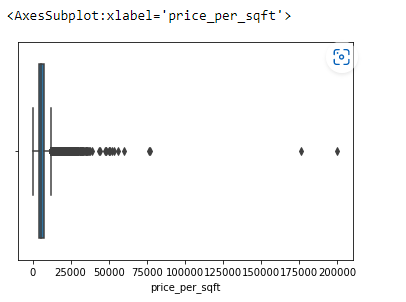
You are given bhp.csv which contains property prices in the city of banglore, India. You need to examine price_per_sqft column and do following,
(1) Remove outliers using IQR
(2) After removing outliers in step 1, you get a new dataframe.
(3) use zscore of 3 to remove outliers. This is quite similar to IQR and you will get exact same result
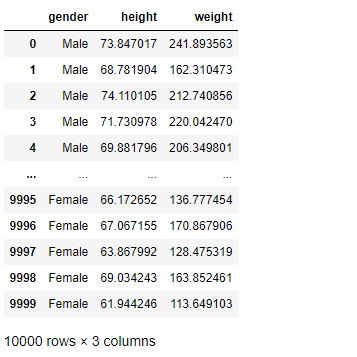
(4) for the data set height_weight.csv find the following
(i) Using IQR detect weight outliers and print them
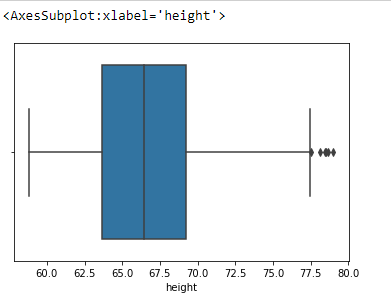
(ii) Using IQR, detect height outliers and print them
An Outlier is an observation in a given dataset that lies far from the rest of the observations. That means an outlier is vastly larger or smaller than the remaining values in the set. An outlier is an observation of a data point that lies an abnormal distance from other values in a given population. (odd man out).Outliers badly affect mean and standard deviation of the dataset. These may statistically give erroneous results.Most machine learning algorithms do not work well in the presence of outlier. So it is desirable to detect and remove outliers.Outliers are highly useful in anomaly detection like fraud detection where the fraud transactions are very different from normal transactions.
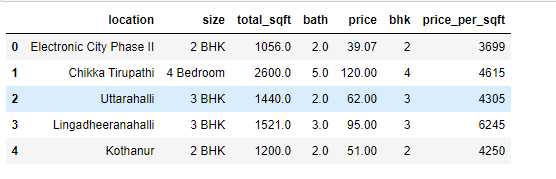
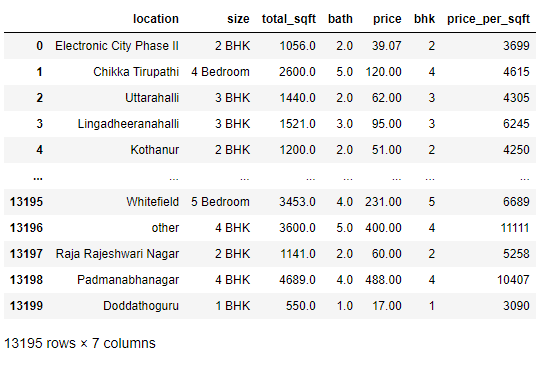
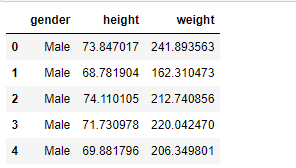
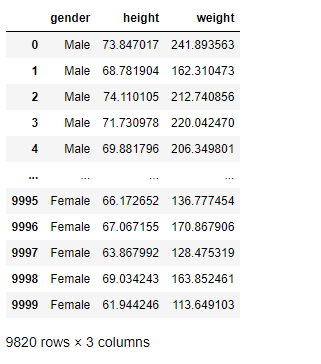
Read the given Data.
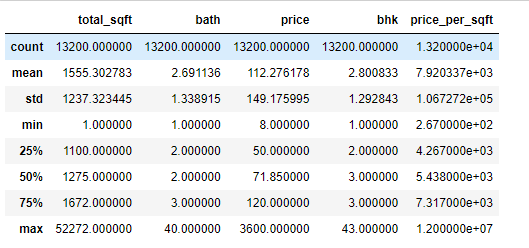
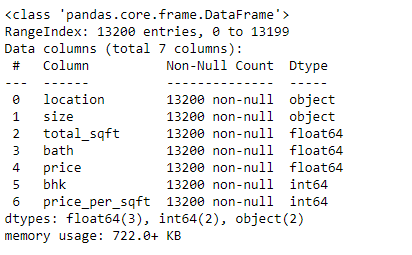
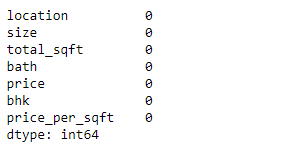
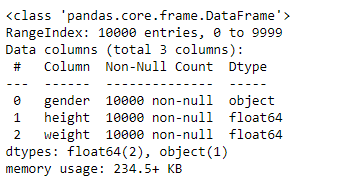
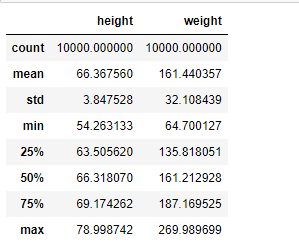
Get the information about the data.
Detect the Outliers using IQR method and Z score.
Remove the outliers.
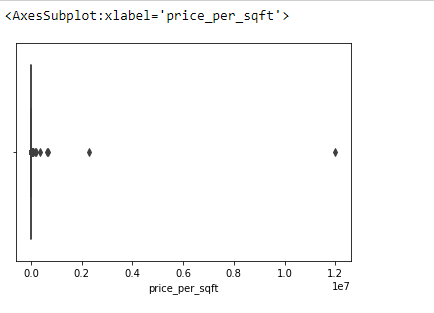
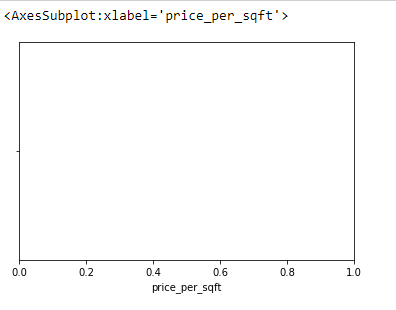
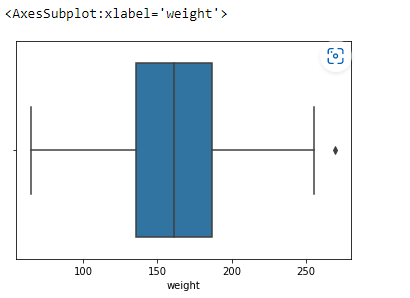
Plot the datas using Box Plot.
Developed by : THAMARAISELVAN V Registration Number : 212221230115
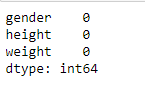
import pandas as ps import numpy as np import seaborn as sns df=ps.read_csv("bhp.csv") df df.head() df.describe() df.info() df.isnull().sum() df.shape sns.boxplot(x="price_per_sqft",data=df) q1=df['price_per_sqft'].quantile(0.35) q3=df['price_per_sqft'].quantile(0.65) print("First Quantile =",q1,"Second quantile =",q3) IQR=q3-q1 #INTERQUARTILE RANGE u1=q3+1.5IQR l1=q1-1.5IQR df1=df[((df['price_per_sqft']<=l1)&(df['price_per_sqft']>u1))] df1 df1.shape sns.boxplot(x='price_per_sqft',data=df1) from scipy import stats z=np.abs(stats.zscore(df['price_per_sqft'])) df2=df[(z<3)] df2 print(df2.shape) sns.boxplot(x='price_per_sqft',data=df2) df3=ps.read_csv('height_weight.csv') df3 df3.head() df3.info() df3.describe() df3.isnull().sum() df3.shape sns.boxplot(x='weight',data=df3) q1=df3['weight'].quantile(0.25) q3=df3['weight'].quantile(0.75) print('First Quantile =',q1,'Second Quantile =',q3) IQR=q3-q1 u1=q3+1.5IQR l1=q1-1.5IQR df4 =df3[((df3['height']>=l1)&(df3['height']<=u1))] df4 df4.shape sns.boxplot(x='height',data=df4)


The given datasets are read and outliers are detected and are removed using IQR and z-score methods.