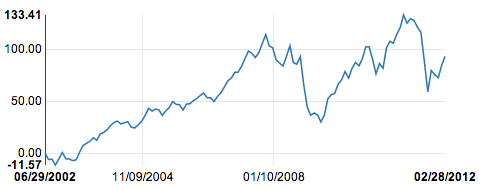
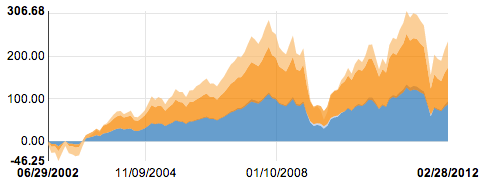
##Angular.js Directives for nvd3.js, d3.js charts
<nvd3-line-chart
    data="exampleData"
    width="600"
    height="350"
    showXAxis="true"
    showYAxis="true"
    xAxisTickFormat="xAxisTickFormat_Date_Format()"
    yAxisTickFormat="yAxisFormatFunction()">
</nvd3-line-chart><nvd3-stacked-area-chart
data="exampleData"
width="600"
height="350"
showXAxis="true"
showYAxis="true"
xAxisTickFormat="xAxisTickFormat()">
</nvd3-stacked-area-chart>1. Install Dependencies with bower
Install these if you don't already have it.
bower install angular --save
bower install d3 --save
bower install nvd3 --save
bower install angularjs-nvd3-directives --save
2. Create basic Angular.js application
Create a html page and start with the following code. For d3.js it is important the the page include <meta charset="utf-8">, otherwise you will get error messages about special characters.
<!DOCTYPE html>
<meta charset="utf-8">
<html>
<head>
Include the downloaded dependencies in the <head> section of the html.
<script src="bower_components/angular/angular.js"></script>
<script src="bower_components/d3/d3.js"></script>
<script src="bower_components/nvd3/nv.d3.js"></script>
<script src="bower_components/angularjs-nvd3-directives/dist/angularjs-nvd3-directives.js"></script>
<link rel="stylesheet" href="bower_components/nvd3/nv.d3.css"/>
Create a <script> block for the angular application
    <script>
        var app = angular.module("nvd3TestApp", ['nvd3ChartDirectives']);

        function ExampleCtrl($scope){
            $scope.exampleData = [
                {
                    "key": "Series 1",
                    "values": [ [ 1025409600000 , 0] , [ 1028088000000 , -6.3382185140371] , [ 1030766400000 , -5.9507873460847] , [ 1033358400000 , -11.569146943813] , [ 1036040400000 , -5.4767332317425] , [ 1038632400000 , 0.50794682203014] , [ 1041310800000 , -5.5310285460542] , [ 1043989200000 , -5.7838296963382] , [ 1046408400000 , -7.3249341615649] , [ 1049086800000 , -6.7078630712489] , [ 1051675200000 , 0.44227126150934] , [ 1054353600000 , 7.2481659343222] , [ 1056945600000 , 9.2512381306992] , [ 1059624000000 , 11.341210982529] , [ 1062302400000 , 14.734820409020] , [ 1064894400000 , 12.387148007542] , [ 1067576400000 , 18.436471461827] , [ 1070168400000 , 19.830742266977] , [ 1072846800000 , 22.643205829887] , [ 1075525200000 , 26.743156781239] , [ 1078030800000 , 29.597478802228] , [ 1080709200000 , 30.831697585341] , [ 1083297600000 , 28.054068024708] , [ 1085976000000 , 29.294079423832] , [ 1088568000000 , 30.269264061274] , [ 1091246400000 , 24.934526898906] , [ 1093924800000 , 24.265982759406] , [ 1096516800000 , 27.217794897473] , [ 1099195200000 , 30.802601992077] , [ 1101790800000 , 36.331003758254] , [ 1104469200000 , 43.142498700060] , [ 1107147600000 , 40.558263931958] , [ 1109566800000 , 42.543622385800] , [ 1112245200000 , 41.683584710331] , [ 1114833600000 , 36.375367302328] , [ 1117512000000 , 40.719688980730] , [ 1120104000000 , 43.897963036919] , [ 1122782400000 , 49.797033975368] , [ 1125460800000 , 47.085993935989] , [ 1128052800000 , 46.601972859745] , [ 1130734800000 , 41.567784572762] , [ 1133326800000 , 47.296923737245] , [ 1136005200000 , 47.642969612080] , [ 1138683600000 , 50.781515820954] , [ 1141102800000 , 52.600229204305] , [ 1143781200000 , 55.599684490628] , [ 1146369600000 , 57.920388436633] , [ 1149048000000 , 53.503593218971] , [ 1151640000000 , 53.522973979964] , [ 1154318400000 , 49.846822298548] , [ 1156996800000 , 54.721341614650] , [ 1159588800000 , 58.186236223191] , [ 1162270800000 , 63.908065540997] , [ 1164862800000 , 69.767285129367] , [ 1167541200000 , 72.534013373592] , [ 1170219600000 , 77.991819436573] , [ 1172638800000 , 78.143584404990] , [ 1175313600000 , 83.702398665233] , [ 1177905600000 , 91.140859312418] , [ 1180584000000 , 98.590960607028] , [ 1183176000000 , 96.245634754228] , [ 1185854400000 , 92.326364432615] , [ 1188532800000 , 97.068765332230] , [ 1191124800000 , 105.81025556260] , [ 1193803200000 , 114.38348777791] , [ 1196398800000 , 103.59604949810] , [ 1199077200000 , 101.72488429307] , [ 1201755600000 , 89.840147735028] , [ 1204261200000 , 86.963597532664] , [ 1206936000000 , 84.075505208491] , [ 1209528000000 , 93.170105645831] , [ 1212206400000 , 103.62838083121] , [ 1214798400000 , 87.458241365091] , [ 1217476800000 , 85.808374141319] , [ 1220155200000 , 93.158054469193] , [ 1222747200000 , 65.973252382360] , [ 1225425600000 , 44.580686638224] , [ 1228021200000 , 36.418977140128] , [ 1230699600000 , 38.727678144761] , [ 1233378000000 , 36.692674173387] , [ 1235797200000 , 30.033022809480] , [ 1238472000000 , 36.707532162718] , [ 1241064000000 , 52.191457688389] , [ 1243742400000 , 56.357883979735] , [ 1246334400000 , 57.629002180305] , [ 1249012800000 , 66.650985790166] , [ 1251691200000 , 70.839243432186] , [ 1254283200000 , 78.731998491499] , [ 1256961600000 , 72.375528540349] , [ 1259557200000 , 81.738387881630] , [ 1262235600000 , 87.539792394232] , [ 1264914000000 , 84.320762662273] , [ 1267333200000 , 90.621278391889] , [ 1270008000000 , 102.47144881651] , [ 1272600000000 , 102.79320353429] , [ 1275278400000 , 90.529736050479] , [ 1277870400000 , 76.580859994531] , [ 1280548800000 , 86.548979376972] , [ 1283227200000 , 81.879653334089] , [ 1285819200000 , 101.72550015956] , [ 1288497600000 , 107.97964852260] , [ 1291093200000 , 106.16240630785] , [ 1293771600000 , 114.84268599533] , [ 1296450000000 , 121.60793322282] , [ 1298869200000 , 133.41437346605] , [ 1301544000000 , 125.46646042904] , [ 1304136000000 , 129.76784954301] , [ 1306814400000 , 128.15798861044] , [ 1309406400000 , 121.92388706072] , [ 1312084800000 , 116.70036100870] , [ 1314763200000 , 88.367701837033] , [ 1317355200000 , 59.159665765725] , [ 1320033600000 , 79.793568139753] , [ 1322629200000 , 75.903834028417] , [ 1325307600000 , 72.704218209157] , [ 1327986000000 , 84.936990804097] , [ 1330491600000 , 93.388148670744]]
                }];

        }
    </script>
For this example we are hardcoding the data to make it easer to quickly create a chart. In the wild, this would obviously not be ideal, but it is more involved than a basic quick start can accomplish.
Close out the head
</head>Setup the <body> and the rest of the angular application
<body ng-app='nvd3TestApp'>The add the ng-app attribute to the <body> element, and set the value to nvd3TestApp, which is the same value used in the script block above angular.module('nvd3TestApp', ...).
Add the Directive to the body of the application
<div ng-controller="ExampleCtrl">
    <nvd3-line-chart
        data="exampleData"
        showXAxis="true"
        showYAxis="true"
        tooltips="true"
        interactive="true">
    </nvd3-line-chart>

</div>
The directive is wrapped inside of a <div> that has a ng-controller attribute that has the same value as the name of the function created in the <script> block above.
Close out the body and html elements.
</body>
</html>If everything is setup correctly, you should be able to open the page and see a basic line chart.


