GithubHelp home page GithubHelp logo

wjm41 / molplotly Goto Github PK

View Code? Open in Web Editor NEW
234.0 2.0 25.0 17.42 MB

add-on to plotly which show molecule images on mouseover!

License: Apache License 2.0

Python 100.00%
plotly-dash data-visualization rdkit cheminformatics molecule-viewer

molplotly's Introduction

molplotly

Powered by RDKit PyPI version PyPI Downloads This project supports Python 3.8+

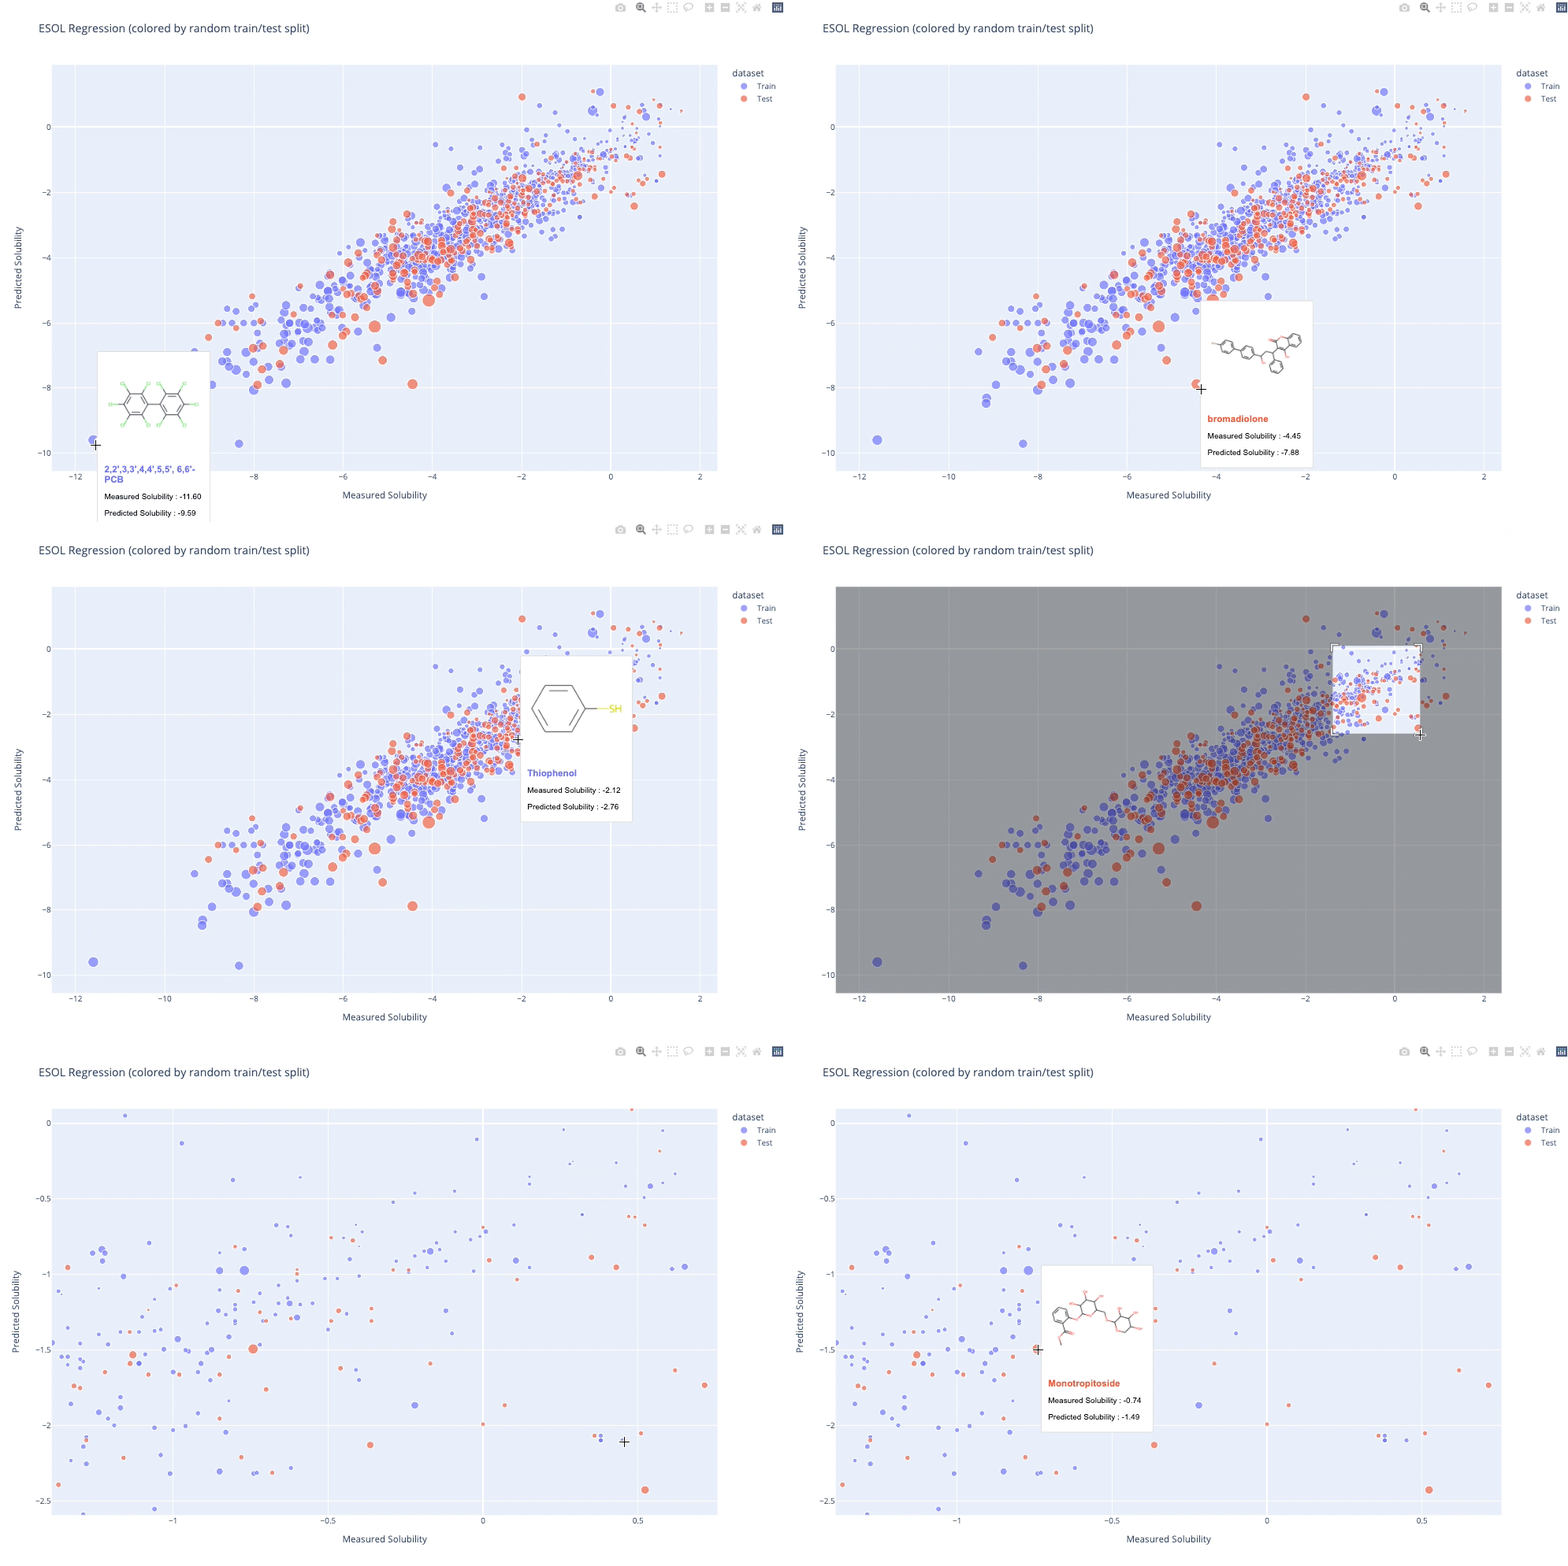
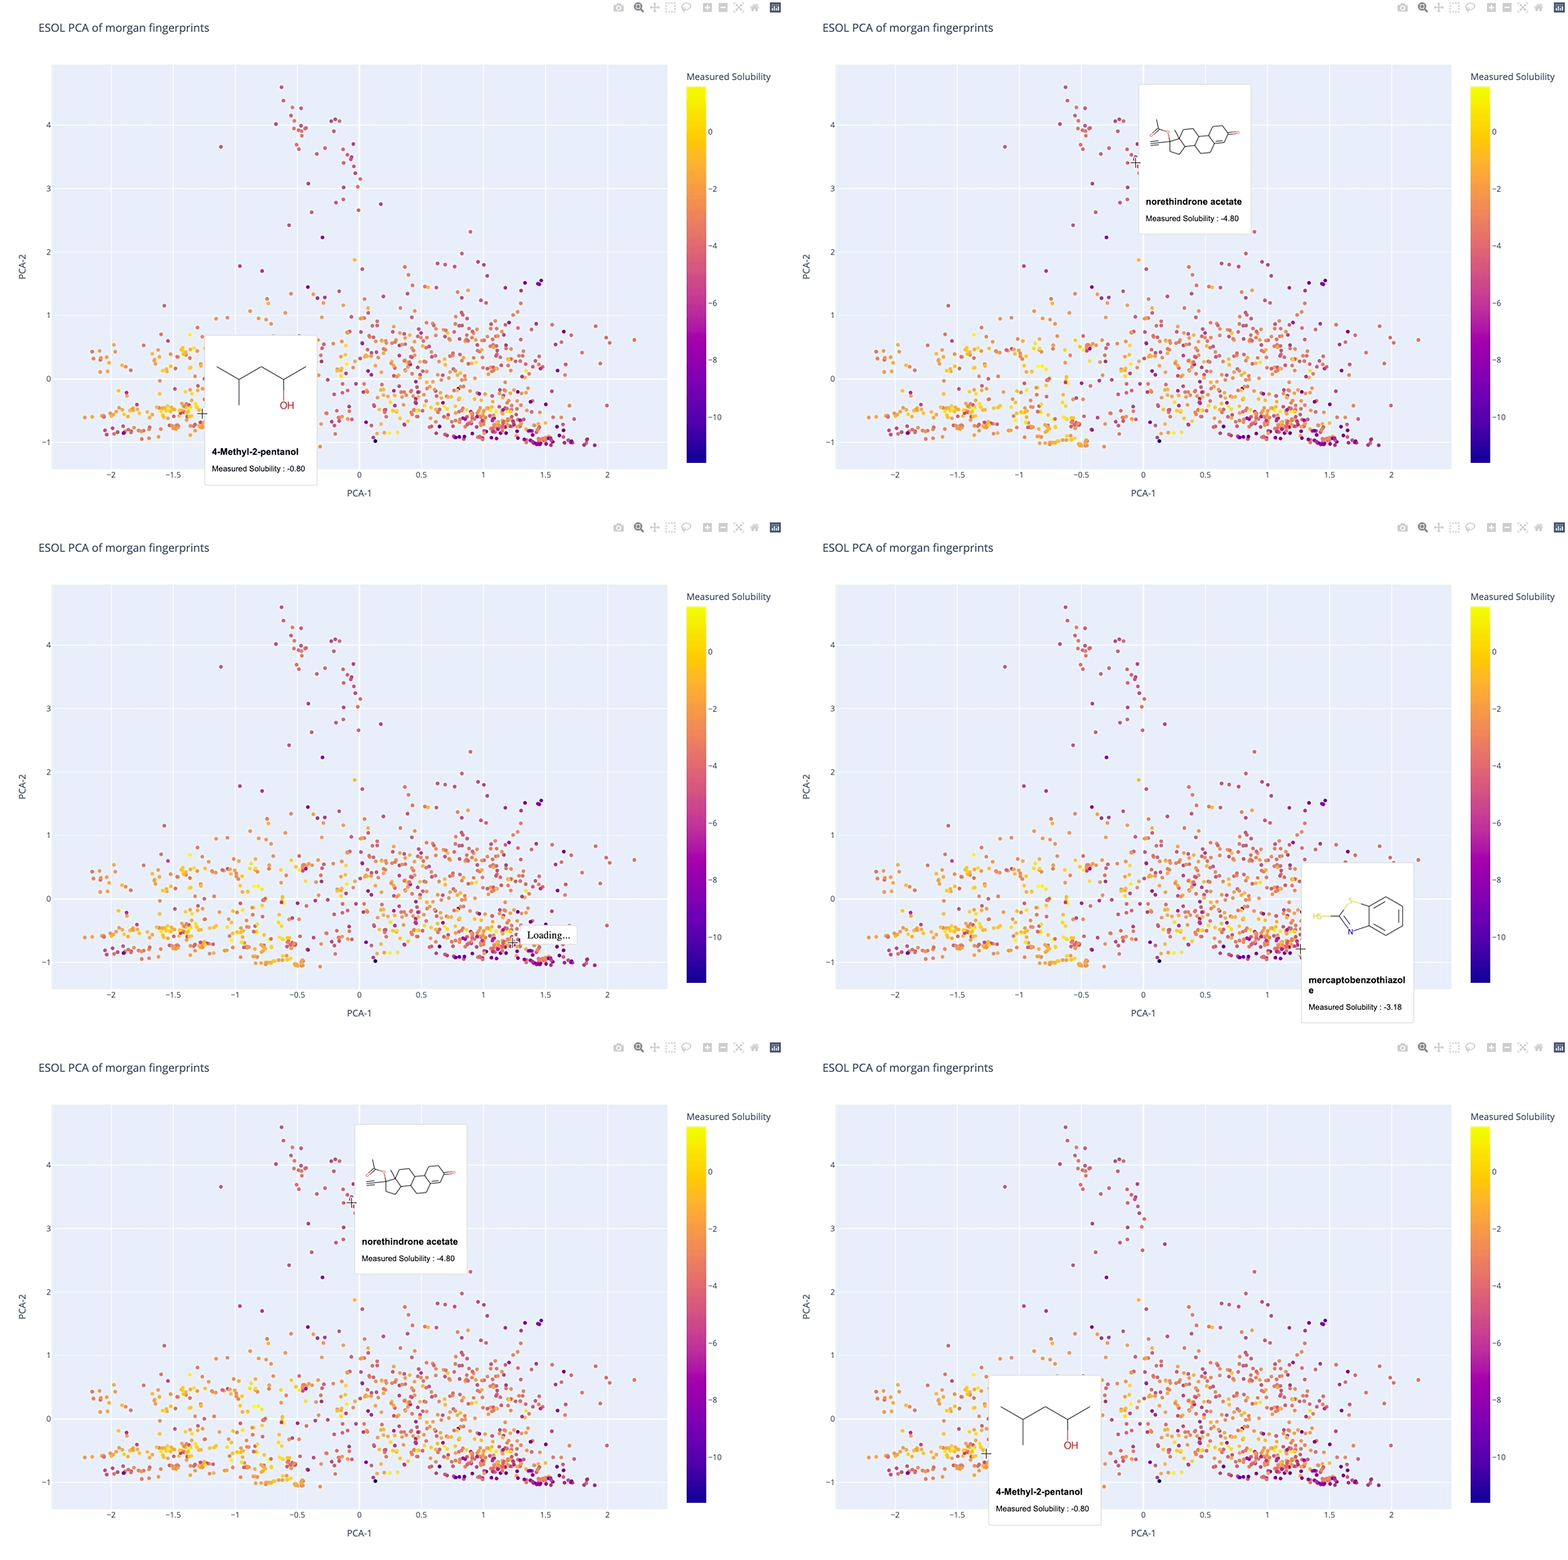
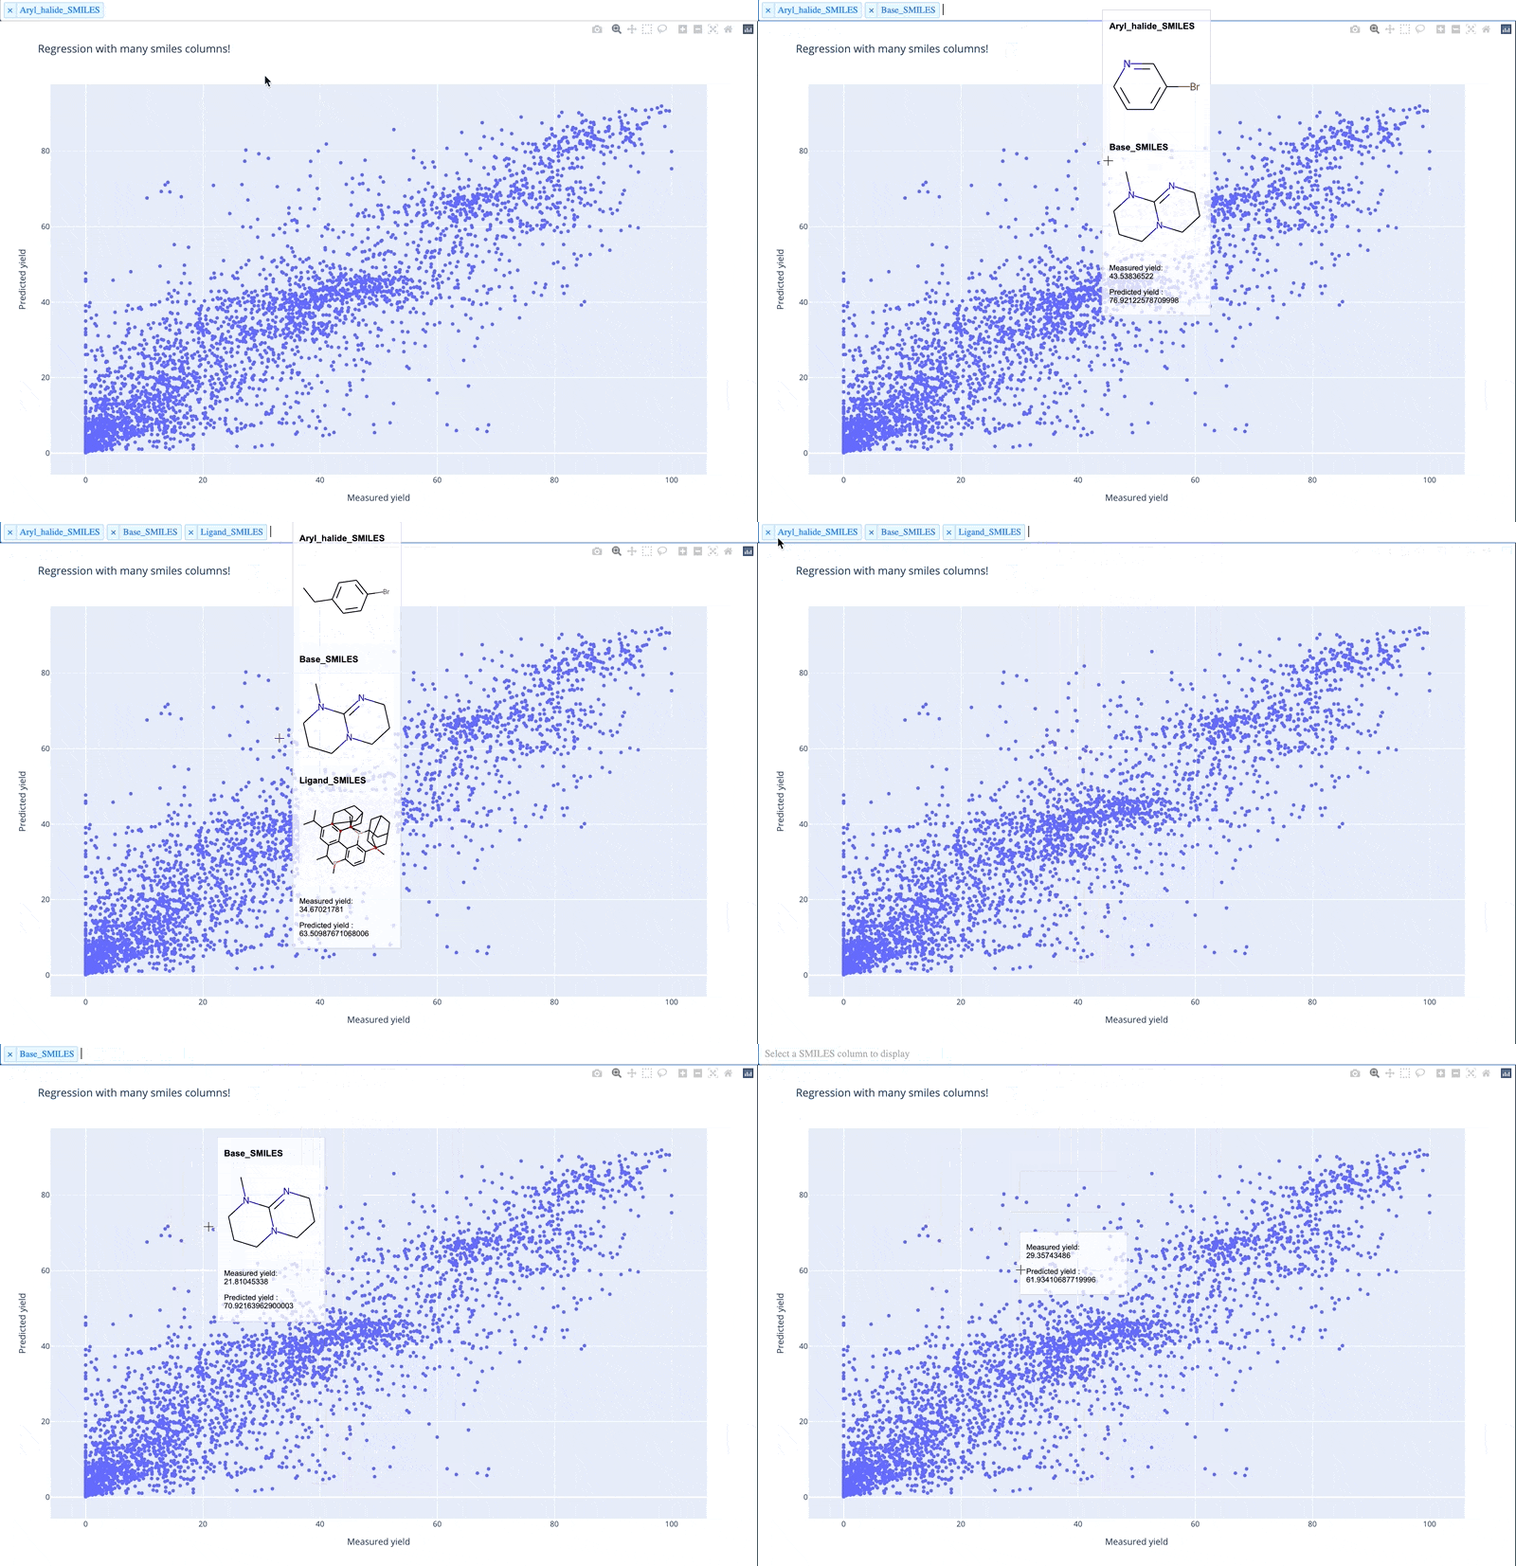
molplotly is an add-on to plotly built on RDKit which allows 2D images of molecules to be shown in plotly figures when hovering over the data points.

Beautiful :) Beautiful :) Beautiful :)

A readable walkthrough of how to use the package together with some useful examples can be found in this blog post while a runnable notebook can be found in examples/simple_usage_and_formatting.ipynb :)

Installation

pip install molplotly

Usage

import pandas as pd
import plotly.express as px

import molplotly

# load a DataFrame with smiles
df_esol = pd.read_csv(
    'https://raw.githubusercontent.com/deepchem/deepchem/master/datasets/delaney-processed.csv')
df_esol['y_pred'] = df_esol['ESOL predicted log solubility in mols per litre']
df_esol['y_true'] = df_esol['measured log solubility in mols per litre']

# generate a scatter plot
fig = px.scatter(df_esol, x="y_true", y="y_pred")

# add molecules to the plotly graph - returns a Dash app
app = molplotly.add_molecules(fig=fig,
                            df=df_esol,
                            smiles_col='smiles',
                            title_col='Compound ID',
                            )

# run Dash app inline in notebook (or in an external server)
app.run_server(mode='inline', port=8700, height=1000)

Input parameters

name type default description
fig figure required a plotly figure object containing datapoints plotted from df.
df DataFrame required a pandas dataframe that contains the data plotted in fig.
smiles_col str 'SMILES' name of the column in df containing the smiles plotted in fig
show_img bool True whether or not to generate the molecule image in the dash app
svg_size float 200 the size in pixels of the molecule drawing
alpha float 0.7 the transparency of the hoverbox, 0 for full transparency 1 for full opaqueness
mol_alpha float 0.7 the transparency of the SVG molecule image, 0 for full transparency 1 for full opaqueness
title_col str None name of the column in df to be used as the title entry in the hover box
show_coords bool True whether or not to show the coordinates of the data point in the hover box
caption_cols list None list of column names in df to be included in the hover box
caption_transform dict {} Functions applied to captions for formatting. The dict must follow a key: function structure where the key must correspond to one of the columns in subset or tooltip
color_col str None name of the column in df that is used to color the datapoints in df - necessary when there is discrete conditional coloring
symbol_col str None name of the column in df that is used to determine the marker shape of the datapoints in df
wrap bool True whether or not to wrap the title text to multiple lines if the length of the text is too long
wraplen int 20 the threshold length of the title text before wrapping begins - adjust when changing the width of the hover box
width int 150 the width in pixels of the hover box
fontfamily str 'Arial' the font family used in the hover box
fontsize int 12 the font size used in the hover box - the font of the title line is fontsize+2

Output parameters

by default a JupyterDash app is returned which can be run inline in a jupyter notebook or deployed on a server via app.run_server()

  • The recommended height of the app is 50+(height of the plotly figure).
  • For the port of the app, make sure you don't pick the same port as another molplotly plot otherwise the tooltips will clash with each other. Also, apparently on windows port numbers below 8700 are used by other processes so for safety processes keep to numbers above that.

Can I run this in colab?

JupyterDash is supposed to have support for Google Colab but at some point that seems to have broken.. Keep an eye on the raised issue here! Update (1st March 2022): The plots seem to be running again but the hoverboxes are not showing so I don't think it has been fully fixed - I will keep an eye on it in the meantime.

Can I save these plots?

An issue/feature request for this has already been raised here.

moltplotly works using a Dash app which is non-trivial to export because server side javascript is needed in addition to HTML/CSS styling (as detailed here)

Until I find a way to get around that, the best alternative is to either host the plot on an app/server, exporting the plotly figure without molecules showing :( as detailed in this page. If you want to use it in a presentation I'd suggest keeping the figure open in a browser and changing windows to it during your talk!

Warning about memory size

Just adding a warning here that memory usage in a notebook can increase significanly when using plotly (not molplotly's fault!). If you notice your jupyter notebook slowing down, plotly itself is a likely culprit... In that case I'd consider either using plotly with static image rendering, or ... use seaborn :P

Acknowledgements

molplotly's People

Contributors

hellevdm avatar ipendlet avatar jannisborn avatar janosh avatar rokasel avatar wjm41 avatar

Stargazers

 avatar  avatar  avatar  avatar  avatar  avatar  avatar  avatar  avatar  avatar  avatar  avatar  avatar  avatar  avatar  avatar  avatar  avatar  avatar  avatar  avatar  avatar  avatar  avatar  avatar  avatar  avatar  avatar  avatar  avatar  avatar  avatar  avatar  avatar  avatar  avatar  avatar  avatar  avatar  avatar  avatar  avatar  avatar  avatar  avatar  avatar  avatar  avatar  avatar  avatar  avatar  avatar  avatar  avatar  avatar  avatar  avatar  avatar  avatar  avatar  avatar  avatar  avatar  avatar  avatar  avatar  avatar  avatar  avatar  avatar  avatar  avatar  avatar  avatar  avatar  avatar  avatar  avatar  avatar  avatar  avatar  avatar  avatar  avatar  avatar  avatar  avatar  avatar  avatar  avatar  avatar  avatar  avatar  avatar  avatar  avatar  avatar  avatar  avatar  avatar

Watchers

 avatar  avatar

molplotly's Issues

how to integrate in an existing dash app and/or show a table in addition to figure?

Hey,

Fantastic functionality. Apologies I am trying very hard but cannot figure out how to integrate this with an existing dash app.

Also, at the moment, I am just interested in displaying the plot in addition to showing the complete input table with other features associated with structure. Anyways we can show a table below the figure, such as pca, interactively, when we hover on a dot and show the structure in addition to other metadata or features?

Thanks so much,
JL

Matrix distance to scatter plot

Hello everyone,

My name is Judith and for my PhD studies, I would like to use your beautiful scripts.
I get a distance matrix by rmsd between each pose but I don't see how to pass it to a scatter plot of 2 clusters, I tried with pandas but I'm really blocked, I can't select the lines and the columns to generate the scatter plot

Best Regards,
Judith

"Invalid prop" and "Callback error"

Hi,

This may be an error specific to my device (running MacOS Monterey 12.6.3), but Dash currently seems to raise an error when trying to use this package. As a minimal working example, I created a fresh environment using Mambaforge (tested both with Python 3.8 and Python 3.11) and copied the install commands & sample notebook from the package's Readme. When running the notebook as-is, the tooltips would simply not pop up, but after removing mode='inline' and viewing the graph through my browser, the browser showed me a "Callback error" each time I hovered over a datapoint (see attached screenshot). Additionally, it provided the error "Invalid prop for this component" upon loading.

The error seems to be fixed (at least in python 3.11) by replacing df_row[title_col].astype(str) in line 333 of molplotly.main with str(df_row[title_col]) (for some reason, .astype(str) seems to work with numeric dtypes but not with strings as the item returned by df_row[title_col] is the string itself). After making this change, the single "Invalid prop..." error remains, but the tooltip seems to work as intended without throwing the "Callback error"s.

The exact error messages were as follows:

Invalid prop for this component
-------------------------------
Property "value" was used with component ID:
  "smiles-menu"
in one of the Input items of a callback.
This ID is assigned to a dash_core_components.Store component
in the layout, which does not support this property.
This ID was used in the callback(s) for Output(s):
  graph-tooltip.show, graph-tooltip.bbox, graph-tooltip.children
Callback error updating ..graph-tooltip.show...graph-tooltip.bbox...graph-tooltip.children..
--------------------------------------------------------------------------------------------
AttributeError                            Traceback (most recent call last)
AttributeError: 'str' object has no attribute 'astype'

Screenshot 2023-03-10 at 14 23 46

Dependency versions for pip install

Is there some reason for the very specific version requirements for the dependencies? For the pip install I would loosen this up unless there are any particular known issues.

Removed support for python 3.7

Thanks for the great library, really useful!

You pinned the pandas version to ~=1.4.1 which effectively cuts of users that use python<3.7. See the pandas release notes:
https://pandas.pydata.org/docs/whatsnew/v1.4.0.html

Is this intentional? Which novel features from pandas >1.4.0 are strictly necessary to keep the package running?
I'll create a PR with a relaxed pandas requirements that works fine for me in a python3.7 env.

cannot pip install molplotly 1.1.8

Hello
I am running molplotly within a python virtualenv, under Linux
I cannot update to the last version of this very nice tool, since I get the following message:
Discarding https://files.pythonhosted.org/packages/39/40/c0d86942ba668d975570a0fbd7fe4224445198a90a64ec6f0c1cd3bf2527/molplotly-1.1.8.tar.gz (from https://pypi.org/simple/molplotly/): Requested molplotly from https://files.pythonhosted.org/packages/39/40/c0d86942ba668d975570a0fbd7fe4224445198a90a64ec6f0c1cd3bf2527/molplotly-1.1.8.tar.gz has inconsistent version: expected '1.1.8', but metadata has '1.1.7'
As a consequence, it's molplotly 1.1.7 that is installed instead the 1.1.8 version, forcing as well the installation of the old rdkit-pypi-2022.9.5

How could I fix this? Thank you for your help
Regards
Romuald

Pip install error

Great idea this package!
I however ran into an issue during installation:
UnicodeDecodeError: 'charmap' codec can't decode byte 0x8f in position 1822: character maps to <undefined>
This is certainly due to unusal characters in the readme, since I could install the package locally by editing the readme file.
Cheers!

Erro with dash 2.3.0

Hello,

First of all thanks for this great package.

Today, I got the following error while importing molplotly whereas I previously had no issue:
ImportError: cannot import name 'Input' from 'dash'

As my version of dash was a bit old 1.6 I believe, I upgraded it to version 2.3.0 via pip. The import error disappeared but I had another error when trying to run the server "app.run_server(mode='inline', port=8003, height=800)":
AttributeError: ('Read-only: can only be set in the Dash constructor or during init_app()', 'requests_pathname_prefix')

I have managed to get around by downgrading dash to version 2.0.0 as recommended here https://stackoverflow.com/questions/70908709/jupyterdash-app-run-server-error-using-jupyter-notebook, but there may be something to look into...

Thanks again

Defining color and markers simultaneously in px.scatter causes issues with hoverbox

Hi there, thanks for providing a great and easy to use tool!

This issue is reproducible with the first example in the documentation:

df_esol['delY'] = df_esol["y_pred"] - df_esol["y_true"]
fig_scatter = px.scatter(df_esol,
                         x="y_true",
                         y="y_pred",
                         color='delY',
                         marker='Minimum Degree', # <- addition
                         title='ESOL Regression (default plotly)',
                         labels={'y_pred': 'Predicted Solubility',
                                 'y_true': 'Measured Solubility',
                                 'delY': 'ΔY'},
                         width=1200,
                         height=800)

# This adds a dashed line for what a perfect model _should_ predict
y = df_esol["y_true"].values
fig_scatter.add_shape(
    type="line", line=dict(dash='dash'),
    x0=y.min(), y0=y.min(),
    x1=y.max(), y1=y.max()
)

fig_scatter.update_layout(title='ESOL Regression (with add_molecules!)')

app_scatter = molplotly.add_molecules(fig=fig_scatter,
                                      df=df_esol,
                                      smiles_col='smiles',
                                      title_col='Compound ID',
                                      color_col='delY' # <- addition
                                      )

# change the arguments here to run the dash app on an external server and/or change the size of the app!
app_scatter.run_server(mode='inline', port=8001, height=1000)

This returns

---------------------------------------------------------------------------
IndexError                                Traceback (most recent call last)
~/anaconda3/envs/ml/lib/python3.7/site-packages/molplotly/main.py in display_hover(
    hoverData={'points': [{'bbox': {'x0': 948.39, 'x1': 950.39, 'y0': 177.7, 'y1': 179.7}, 'curveNumber': 0, 'marker.color': -0.48000000000000004, 'pointIndex': 960, 'pointNumber': 960, 'x': 0.79, 'y': 0.31}]}
)
    111             df_curve = df[df[color_col] ==
    112                           curve_dict[curve_num]].reset_index(drop=True)
--> 113             df_row = df_curve.iloc[num]
        df_row = undefined
        df_curve.iloc = <pandas.core.indexing._iLocIndexer object at 0x7f7e3d16c950>
        num = 960
    114         else:
    115             df_row = df.iloc[num]

~/anaconda3/envs/ml/lib/python3.7/site-packages/pandas/core/indexing.py in __getitem__(
    self=<pandas.core.indexing._iLocIndexer object>,
    key=960
)
    929 
    930             maybe_callable = com.apply_if_callable(key, self.obj)
--> 931             return self._getitem_axis(maybe_callable, axis=axis)
        self._getitem_axis = <bound method _iLocIndexer._getitem_axis of <pandas.core.indexing._iLocIndexer object at 0x7f7e3d490c50>>
        maybe_callable = 960
        axis = 0
    932 
    933     def _is_scalar_access(self, key: tuple):

~/anaconda3/envs/ml/lib/python3.7/site-packages/pandas/core/indexing.py in _getitem_axis(
    self=<pandas.core.indexing._iLocIndexer object>,
    key=960,
    axis=0
)
   1564 
   1565             # validate the location
-> 1566             self._validate_integer(key, axis)
        self._validate_integer = <bound method _iLocIndexer._validate_integer of <pandas.core.indexing._iLocIndexer object at 0x7f7e3d490c50>>
        key = 960
        axis = 0
   1567 
   1568             return self.obj._ixs(key, axis=axis)

~/anaconda3/envs/ml/lib/python3.7/site-packages/pandas/core/indexing.py in _validate_integer(
    self=<pandas.core.indexing._iLocIndexer object>,
    key=960,
    axis=0
)
   1498         len_axis = len(self.obj._get_axis(axis))
   1499         if key >= len_axis or key < -len_axis:
-> 1500             raise IndexError("single positional indexer is out-of-bounds")
        global IndexError = undefined
   1501 
   1502     # -------------------------------------------------------------------

IndexError: single positional indexer is out-of-bounds

Using either only marker or color alone causes no issues with the hoverbox. Also, using Minimum Degree as color_col for add_molecules when both color and symbol are defined gives no issues.

Integrating scatterplot with 3D molecule structures in existing Dash app

Thanks for the great package!

I am interested in integrating a scatterplot with the 3D structures of my molecules in an existing Dash app. What would be the best way to do this (if it's even possible), considering that the add_molecules() function already returns a Dash app?

Thanks for your help! :)

Edit: My bad, didn't saw issue #15 !

Plotting in a running Dash app

Hi!
I have a small dash app that I use to explore the molecules present in different samples. It is possible to select the samples of interest and then display a plotly scatter plot generated using the structures. I tried to add the molplotly layer on the scatter plot but no molecules are displayed. Any experience on that?
Thanks!

Plots doubled and problem closing ports

Hi there,

With this code, I am seeing the interactive plot appear twice:

# generate a scatter plot
fig = px.scatter(plot_df, x="umap1", y="umap2", width=600, height=600)

# add molecules to the plotly graph - returns a Dash app
app = molplotly.add_molecules(fig=fig,
                            df=plot_df,
                            smiles_col='smiles'
                            )

# run Dash app inline in notebook (or in an external server)
app.run_server(mode='inline', port=8701, height=650)

Also, when I re-rerun this cell in Jupyter Lab, I get this error:

/Users/kwaneu/sw/miniconda/miniconda3/envs/python/lib/python3.11/site-packages/dash/dash.py:516: UserWarning:

JupyterDash is deprecated, use Dash instead.
See https://dash.plotly.com/dash-in-jupyter for more details.

---------------------------------------------------------------------------
TypeError                                 Traceback (most recent call last)
Cell In[49], line 11
      5 app = molplotly.add_molecules(fig=fig,
      6                             df=plot_df,
      7                             smiles_col='smiles'
      8                             )
     10 # run Dash app inline in notebook (or in an external server)
---> 11 app.run_server(mode='inline', port=8701, height=650) # height should be height+50

File ~/sw/miniconda/miniconda3/envs/python/lib/python3.11/site-packages/jupyter_dash/jupyter_app.py:222, in JupyterDash.run_server(self, mode, width, height, inline_exceptions, **kwargs)
    220 old_server = self._server_threads.get((host, port))
    221 if old_server:
--> 222     old_server.kill()
    223     old_server.join()
    224     del self._server_threads[(host, port)]

File ~/sw/miniconda/miniconda3/envs/python/lib/python3.11/site-packages/jupyter_dash/_stoppable_thread.py:16, in StoppableThread.kill(self)
     13 def kill(self):
     14     thread_id = self.get_id()
     15     res = ctypes.pythonapi.PyThreadState_SetAsyncExc(
---> 16         ctypes.c_long(thread_id), ctypes.py_object(SystemExit)
     17     )
     18     if res == 0:
     19         raise ValueError(f"Invalid thread id: {thread_id}")

TypeError: 'NoneType' object cannot be interpreted as an integer

Thanks!

Stacked Bar chart or multiple traces?

Hi,

Thanks for sharing this, it's great!

Is there a way to display mols in a stacked bar plot? The stacked bars use separate columns for the y-axis, not a shared facet column.

Or are there any examples where it's used on more than one trace per plot (like add_trace with plotly go)?

Attached some plotly code and a test set if that helps!

Thanks,

fig=px.bar(
    data_frame = df,
    x = "Identifier",
    y = ['Conc1',''Conc2','Conc3'],
    barmode = 'stack'

Test Data.csv

Streamlit Integration

Hi,

I was wondering if there was any way of integration molplotly into a streamlit app. This is some very code I have :

fig = visualize_chemical_space(library_to_visualise, method, fingerprint)
st.plotly_chart(fig)
app = molplotly.add_molecules(fig=fig, df=library_to_visualise, smiles_col='SMILES', title_col='ID')
app.run_server(mode='inline', port=8700, height=1000)

I guess this working out of the box was a long shot. If you have any ideas to make this work (my current idea was to create a button to link to the URL where the molplotly plot is hosted) I'd be grateful.

A lot of CADD/cheminformatics people seem to be using streamlit for some basic webapps. I think this would be an awesome feature to be able to add.

Saving interactive plots

Thanks for the great package!

It would be fantastic if the interactive plots could be exported/saved. I understand that this is non-trvial in plotly, but other libraries like mpl3d also allow to export as interactive HTML or SVG. See here for an exemplary plot. Also TMAP and Faerun support this natively.
I think it will be a heavily sought-after feature for real usability of this package.

Possible solutions:

Pip install fails

Not sure if this is on my end, but when installing using pip install molplotly, I could not import without running into the following issues:

ImportError: cannot import name 'json' from itsdangerous
Fixed by running pip install --force-reinstall itsdangerous==2.0.1

ImportError: cannot import name 'BaseResponse' from 'werkzeug.wrappers
Fixed by running pip install --force-reinstall werkzeug==2.0.3

Not sure if this is just an environment problem, or whether the project should be updated to use the newer releases of these packages. Thanks

Error when using with Plotly Subplots

When trying to use molplotly to generate hover structures with a series of scatterplots generated using make_subplots (generated using different columns of a dataframe for the same RDKit molecule row), molplotly.add_molecules returns

ValueError: More than one plotly curve in figure - color_col and/or marker_col needs to be specified.

As these plots are generated using different columns, rather than faceting data in a single column based on values in another, there is no common color or marker column. Is there a way to generate molecular structures for these subplots?

Recommend Projects

  • React photo React

    A declarative, efficient, and flexible JavaScript library for building user interfaces.

  • Vue.js photo Vue.js

    🖖 Vue.js is a progressive, incrementally-adoptable JavaScript framework for building UI on the web.

  • Typescript photo Typescript

    TypeScript is a superset of JavaScript that compiles to clean JavaScript output.

  • TensorFlow photo TensorFlow

    An Open Source Machine Learning Framework for Everyone

  • Django photo Django

    The Web framework for perfectionists with deadlines.

  • D3 photo D3

    Bring data to life with SVG, Canvas and HTML. 📊📈🎉

Recommend Topics

  • javascript

    JavaScript (JS) is a lightweight interpreted programming language with first-class functions.

  • web

    Some thing interesting about web. New door for the world.

  • server

    A server is a program made to process requests and deliver data to clients.

  • Machine learning

    Machine learning is a way of modeling and interpreting data that allows a piece of software to respond intelligently.

  • Game

    Some thing interesting about game, make everyone happy.

Recommend Org

  • Facebook photo Facebook

    We are working to build community through open source technology. NB: members must have two-factor auth.

  • Microsoft photo Microsoft

    Open source projects and samples from Microsoft.

  • Google photo Google

    Google ❤️ Open Source for everyone.

  • D3 photo D3

    Data-Driven Documents codes.