#PivotTable.js
PivotTable.js is a Javascript Pivot Table library with drag'n'drop functionality built on top of jQuery/jQueryUI and originally written in CoffeeScript by Nicolas Kruchten at Datacratic.
##What does it do?
PivotTable.js' basic function is to turn a data set into a summary table and then optionally add a true 2-d drag'n'drop UI to allow a user to manipulate this summary table, turning it into a pivot table, very similar to the one found in older versions of Microsoft Excel with a bunch of extra developer-oriented features and some visualization effects.
##Features
- works with common input formats
- layered architecture allows for summary table generation with or without the pivot table UI around it (if you don't use the UI, then there is no dependency on jQueryUI)
- derived columns can be created on the fly based on the whole input row by passing in a function
- complex aggregation functions can compute values based on the whole input row (i.e. weighted averages)
- built-in support for basic heatmap and bar chart visualization
- extension points allow aggregation functions, table output, UI and visualizations to be tailored to specific applications
- works acceptably fast in Chrome on commodity hardware up to hundreds of thousands of rows with a dozen attributes
##Where's the demo?
A demo of PivotTable.js loaded up with a sample dataset of Canadian Members of Parliament as of 2012 can be found here: PivotTable.js demo.
##How do you use the UI?
PivotTable.js implements a pivot table drag'n'drop UI similar to that found in popular spreadsheet programs. You can drag variables into/out of the row/column areas, and choose a summary function. If you choose a summary function that takes an argument, like 'average', you'll have to drag a variable onto the dropdown.
###Initial state of UI with Canadian MP's dataset

###Drag'n'Drop...

###...for MP counts by Province and Party

###A little more...

###...for Gender Imbalance by Provice and Party

Now you do it: Age distribution bar chart by Gender

You can also exclude some rows

##How does the code work?
There are two main functions defined in pivot.coffee: pivot() and pivotUI(), both implemented as jQuery plugins, as well as a bunch of helpers and templates.
Despite the fact that this is described as a Javascript library, it's actually written in CoffeeScript. You can compile pivot.coffee into pivot.js with coffee -c pivot.coffee or you can use the precompiled JS file from the examples directory.
Once you've loaded jQuery and pivot.js, this code (demo):
$("#output").pivot(
    [
        {color: "blue", shape: "circle"},
        {color: "red", shape: "triangle"}
    ],
    {
        rows: ["color"],
        cols: ["shape"]
    }
);
appends this table to $("#output") (the default, overridable behaviour is to populate the table cells with counts):
| shape | circle | triangle | Totals | |
|---|---|---|---|---|
| color | ||||
| blue | 1 | 1 | ||
| red | 1 | 1 | ||
| Totals | 1 | 1 | 2 | |
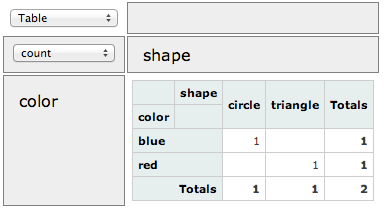
A slight change to the code (calling pivotUI() instead of pivot() ) yeilds the same table with a drag'n'drop UI around it, so long as you've imported jQueryUI (demo):
$("#output").pivotUI(
    [
        {color: "blue", shape: "circle"},
        {color: "red", shape: "triangle"}
    ],
    {
        rows: ["color"],
        cols: ["shape"]
    }
);
###Parameters
####pivot(input [,options])
pivot will inject an HTML table into the object onto which it is called, which will summarize input according to options.
input is an array of objects, or a jQuery object referencing a table (see next section).
options is an object with the following keys:
rows: array of variable names to use as rowscols: array of variable names for use as columnsaggregator: constructor for an object which will aggregate results per cell (see source)derivedAttributes: object to define derived attributes (see demo)filter: function called on each row, returnsfalseif the row is to be excluded from the outputpostProcessor: function called on the output before function returns (used bypivotUIto do visualization effects likeheatmapandbarchart)
####pivotUI(input [,options])
pivotUI will essentiall draw a UI and then call pivot. It will call pivot every time the UI is changed via a drag'n'drop or an aggregator selection. The options object lets you set up the UI itself in terms of what visualization aggregators and effects are offered, and it lets you prepopulate the various options as well.
input is an array of objects, or a jQuery object referencing a table (see next section).
options is an object with the following keys:
effects: dictionary of post-processing visualization functionsaggregators: dictionary of constructors for aggregation functions in dropdownrows: array of variable names to prepopulate in row areacols: array of variable names to prepopulate in cols areavals: array of variable names to prepopulate in vals areaaggregatorName: aggregator to prepopulate in dropdowneffectsName: effects to prepopulate in radio buttonderivedAttributes: object to define derived attributes (passed through topivot())
(You can also view-source on the demo or log a GitHub Issue if this isn't clear enough)
##Input Formats
###Arrays of objects
<script>
	var input = [
		{
			"key1": "value1_key1",
			"key2": "value1_key2",
			//...
		},
		{
			"key1": "value2_key1",
			"key2": "value2_key2",
			//...
		},
		//...
	];
</script>
###Arrays of arrays
<script>
	var input = [
		["key1", "key2"],
		["value1_key1", "value1_key2"],
		["value2_key1", "value2_key2"],
		//...
	];
</script>
###Functions that call back
<script>
	var input = function(callback) {
		callback({
			"key1": "value1_key1",
			"key2": "value1_key2",
			//...
		});
		callback({
			"key1": "value2_key1",
			"key2": "value2_key2",
			//...
		};
		//...
	};
</script>
###jQuery References to Simple Tables
<script>
	var input = $("#input");
</script>

<table id="input">
	<thead>
		<tr>
			<th>key1</th>
			<th>key2</th>
			<!-- etc... -->
		</tr>
	</thead>
	<tbody>
		<tr>
			<td>value1_key1</td>
			<td>value1_key2</td>
		</tr>
		<tr>
			<td>value2_key1</td>
			<td>value2_key2</td>
		</tr>
			<!-- etc... -->
	</tbody>
</table>
##Copyright & Licence
PivotTable.js is © 2012-2013 Nicolas Kruchten, Datacratic
Permission is hereby granted, free of charge, to any person obtaining a copy of this software and associated documentation files (the "Software"), to deal in the Software without restriction, including without limitation the rights to use, copy, modify, merge, publish, distribute, sublicense, and/or sell copies of the Software, and to permit persons to whom the Software is furnished to do so, subject to the following conditions:
The above copyright notice and this permission notice shall be included in all copies or substantial portions of the Software.
THE SOFTWARE IS PROVIDED "AS IS", WITHOUT WARRANTY OF ANY KIND, EXPRESS OR IMPLIED, INCLUDING BUT NOT LIMITED TO THE WARRANTIES OF MERCHANTABILITY, FITNESS FOR A PARTICULAR PURPOSE AND NONINFRINGEMENT. IN NO EVENT SHALL THE AUTHORS OR COPYRIGHT HOLDERS BE LIABLE FOR ANY CLAIM, DAMAGES OR OTHER LIABILITY, WHETHER IN AN ACTION OF CONTRACT, TORT OR OTHERWISE, ARISING FROM, OUT OF OR IN CONNECTION WITH THE SOFTWARE OR THE USE OR OTHER DEALINGS IN THE SOFTWARE.


