
There are a huge number of algorithms designed to call differential events from RNA-seq data at the gene, isoform and splicing-event level. It would be great if when a new caller comes out, there was a way to automatically place it in the context of the other callers. Every now and then a review article comes out which compares a subset of the tools against each other. This project aims to do provide a tool to do that automatically.
git clone https://github.com/roryk/bcbio.rnaseq
- Install the necessary libraries
cd bcbio.rnaseq
Rscript resources/scripts/install_libraries.R
- Run a simulation of sample size 5
lein run simulate -s 5 -d output_dir
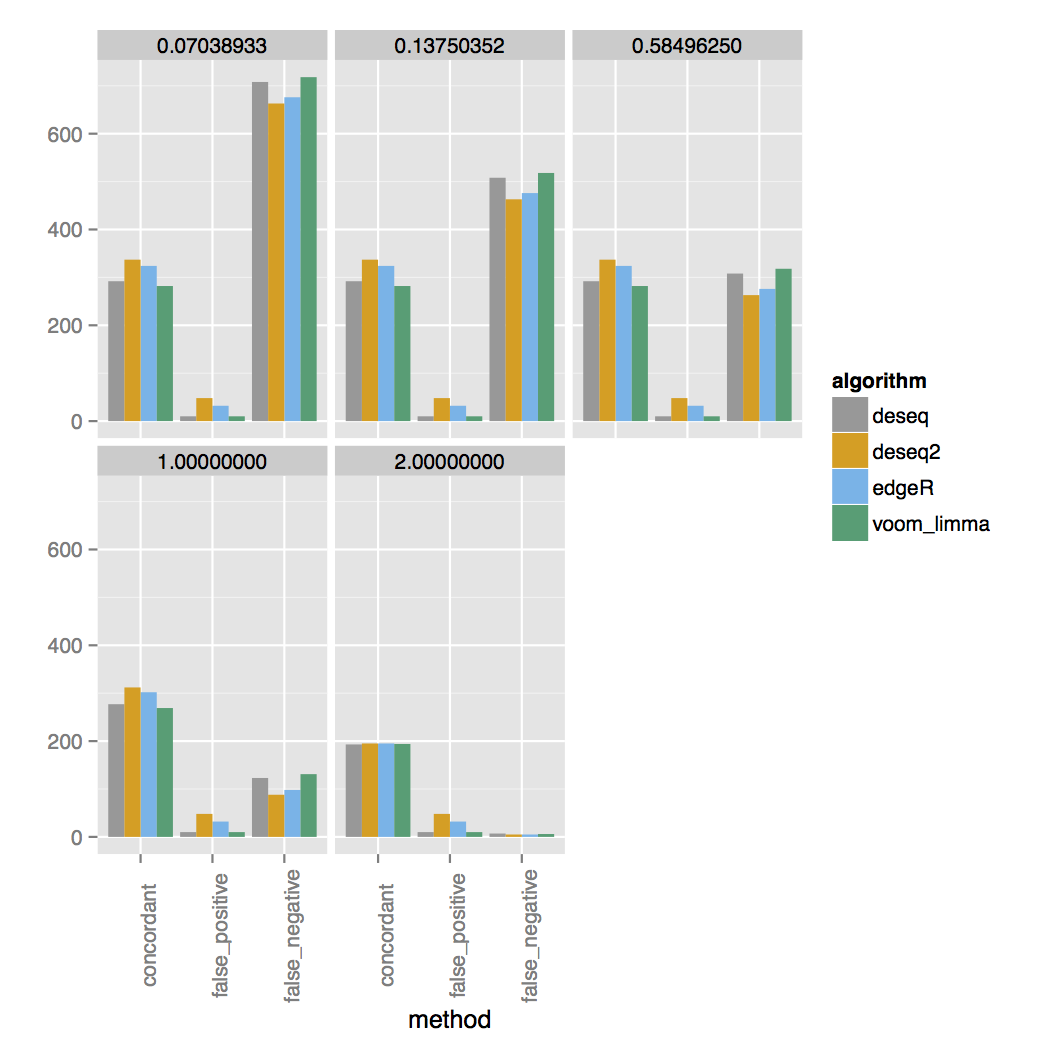
In the output_dir you will find plots comparing the output from the callers against the set of simulated true positives. For example here are concordance plots vs. the set of true simulated RNA-seq genes for an experiment with 3 replicates:
vs 30 replicates:
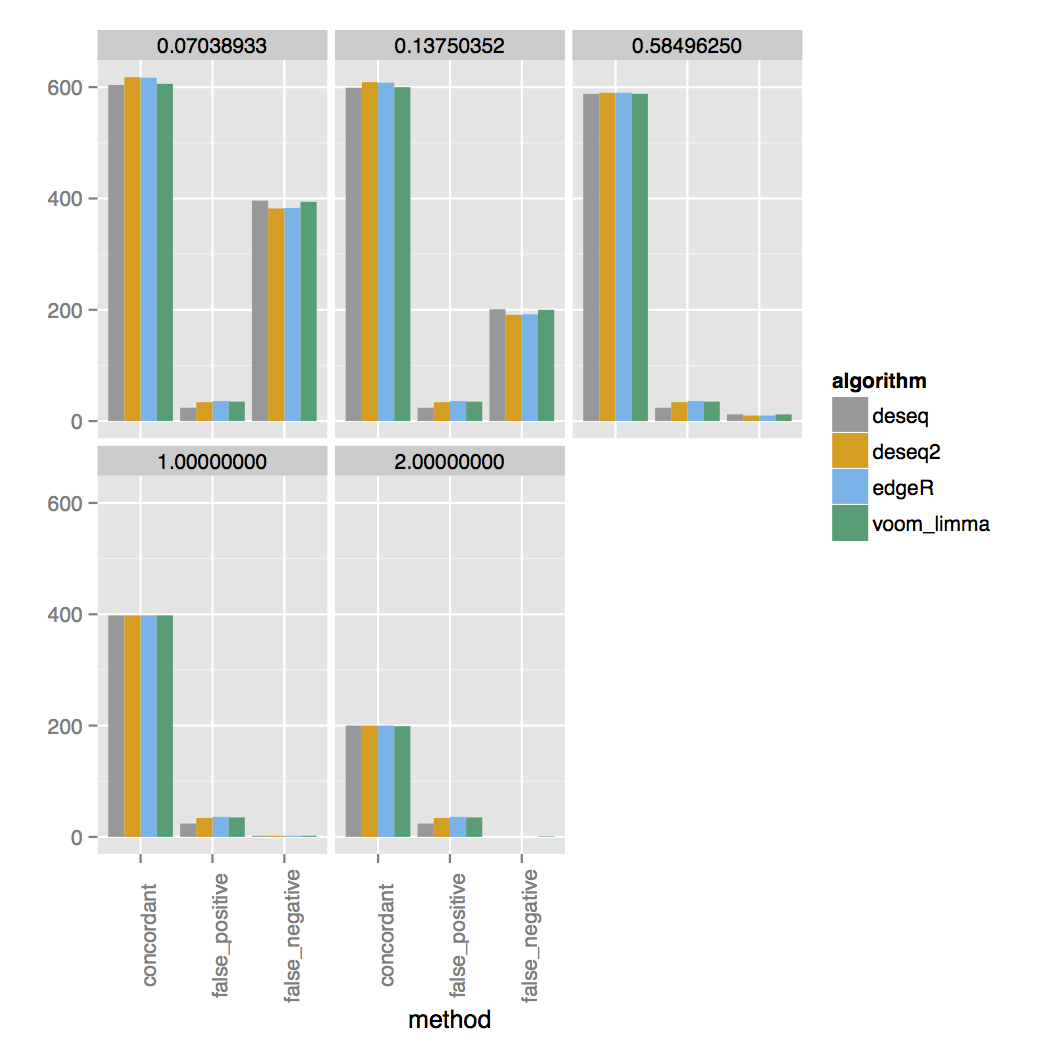
The simulator simulates a range of fold changes and the two concordance plots are faceted on the log2 fold change cutoff listed at the top. The simulated set has 200 additional genes that are DE between each cutoff, for a total of 1000 DE genes. For three samples you can see almost all DE genes are called at a 4-fold change. At a 2-fold change only around half of the correct DE genes are called and almost none for fold changes lower than that. For 30 samples genes with a lower fold change are called much more accurately.
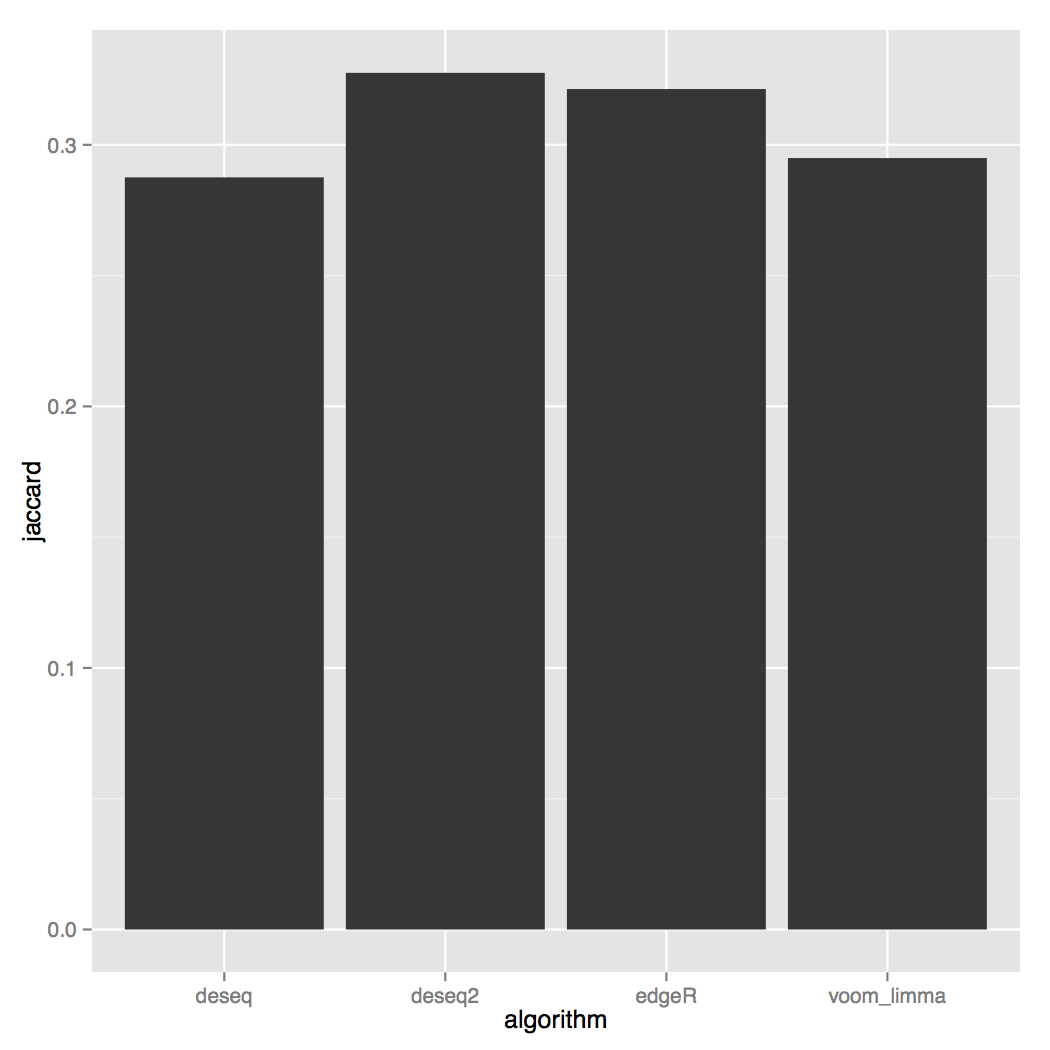
Other useful plots are the Jaccard index:
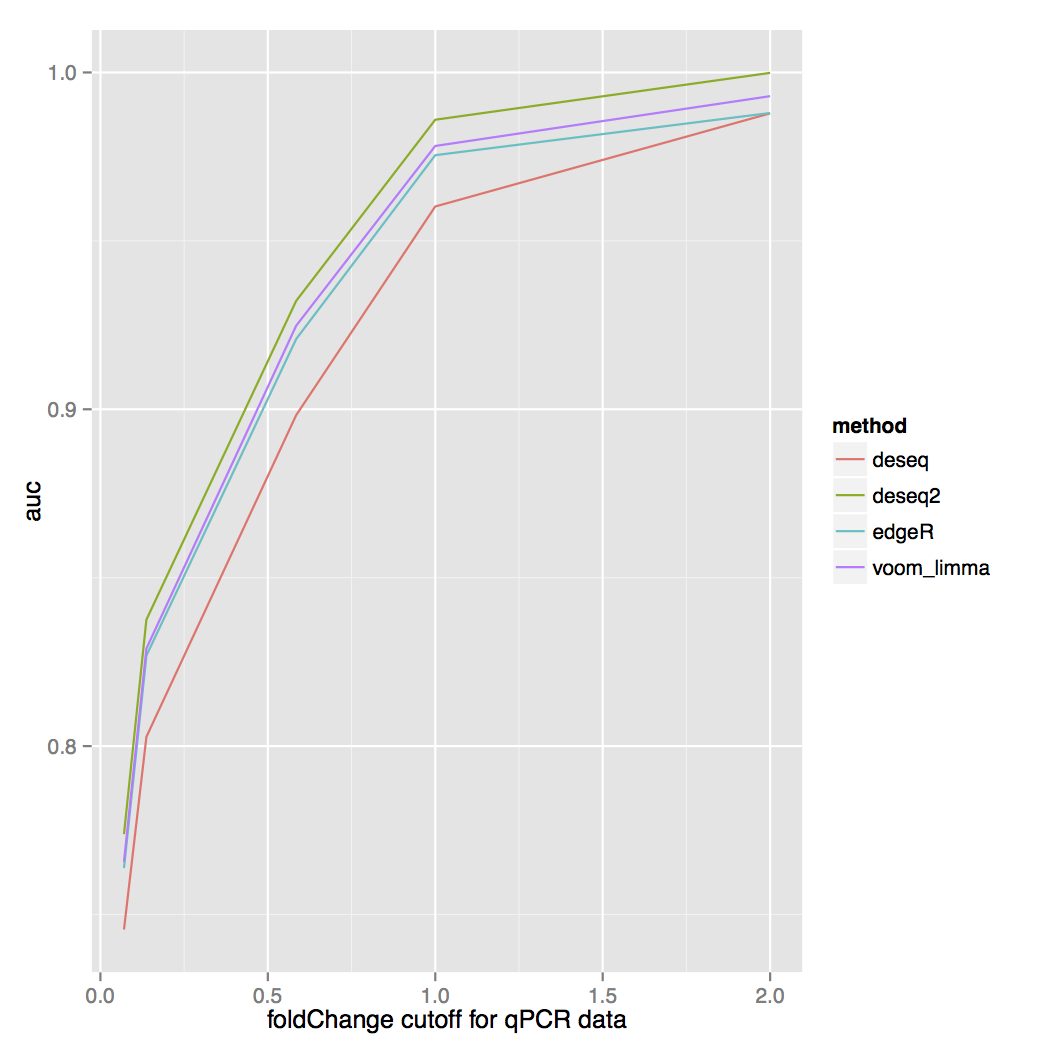
and the area under the ROC curve for each fold change cutoff:
bcbio.rnaseq can be used to simulate a RNA-seq experiment of
a given sample size. Running bcbio.rnaseq with:
lein run simulate -s 3 -d sample_size_3
Will output the results of simulating an experiment of size 3 to the directory sample_size_3. The simulator simulates an experiment with 20 million reads with 10,000 total genes, 1000 of which are differentially expressed, 200 at five different fold change levels.
This mode is invoked with
lein run compare
and takes the output from a
bcbio-nextgen RNA-seq analysis and runs several
different DE callers and compares the results to each other. If your
run includes ERCC spike-in data bcbio.rnaseq will detect
this automatically and run a concordance analysis on the ERCC data.
Passing the --seqc flag turns on a
a diagnostic mode
for determining how well DE callers work against a reference set of ~
1000 qPCR assayed genes from the SEQC project. The true set of
DE calls were made on the qPCR data via the hacky method of performing
a t-test and BH correcting the p-values, and calling anything with a
FDR < 0.05 as differentially expressed. To run in this mode you would
first download and prepare the SEQC data, align and quantitate it with
bcbio-nextgen and run bcbio.rnaseq on the
results.
This mode produces a Rmd file with a report of a bcbio-nextgen run. If you run it without passing a formula, it will just generate a quality-control report. If you pass a formula like this:
lein run summarize path-to-project-summary-file -f "~ batch + panel"
It will run a DESeq2 analysis with the specified model and prepare reports of all pairwise comparisons for the last factor in the model. An example report is available here.
If you have cufflinks and R installed and in your path, this
should work for you. If it doesn't please open an issue and we'll fix
it.
git clone https://github.com/roryk/bcbio.rnaseq
cd bcbio.rnaseq
make
The executable will be in bin/bcbio-rnaseq.
If you make a R-file template called name-of-caller.template and
stick it in the resources directory, it will automatically be
added to the list of callers to run. The templates have to handle
three things: transforming the counts to something the caller can use,
resolving the groups to be compared from a list indicating which
column in the table goes with which group and outputting a table with
the DE calls in the right format. Each file takes three inputs:
count-file: a file of counts of reads mapping to genes, with the rows the IDs and the columns the sample names. This will be provided to your script.class: this is a list which pairs each column with each condition to run. Right now this only does simple two-factor analyses.out-file: In your R script the results should be transformed to have these columns::
id, expr, logFC, pval, padj, algorithm
where id is the gene ID, expr is the normalized average counts
for all of the conditions for that gene, logFC is the log2 fold
change, pval the p-value that condition 1 is different than
condition 2, padj the Benjamini-Hochberg adjusted p-value and
algorithm the name for this caller that you want to show up on the
graphs.
An example is clearer: a proper template, deseq and the output, sample-output.