Funktionen und Rmd Notebook zur Erstellung verschiedener farbenfroher Bevölkerungspyramiden in der Programmiersprache R mit der Grafikbibliothek {ggplot2}. Die Grafiken wurden verwendet, um statische Visualisierungen für den Bericht "Demografischen Wandel neu entdecken" zu erstellen, der vom Bundesinstitut für Bevölkerungsforschung (BiB) veröffentlicht wurde. Darüber hinaus wurden animierte Versionen zur Erklärung wie und warum sich die Muster im Laufe der Zeit verändern für die sozialen Medien und Webauftritte erstellt.
Datenquelle: Mikrozensus
Berechnungen: Bundesinstitut für Bevölkerungsforschung (BiB)
Grafische Darstellung: Cédric Scherer
→ Grafiken, Animationen und mehr Infos hier:
www.bib.bund.de/pyramiden
Functions and Rmd notebook to create various colorful population pyramids in R with {ggplot2}. The graphics have been used to design static visualization for the report "Rediscovering demographic change" published by the German Federal Institute for Population Research (BIB). In addition, animated versions that explain how and why the patterns change over time were designed for social media and webpages.
Data source: Microcensus
Calculations: Federal Institute for Population Research (BIB)
Graphical illustration: Cédric Scherer
→ Graphics, animations and more information here:
www.bib.bund.de/pyramiden
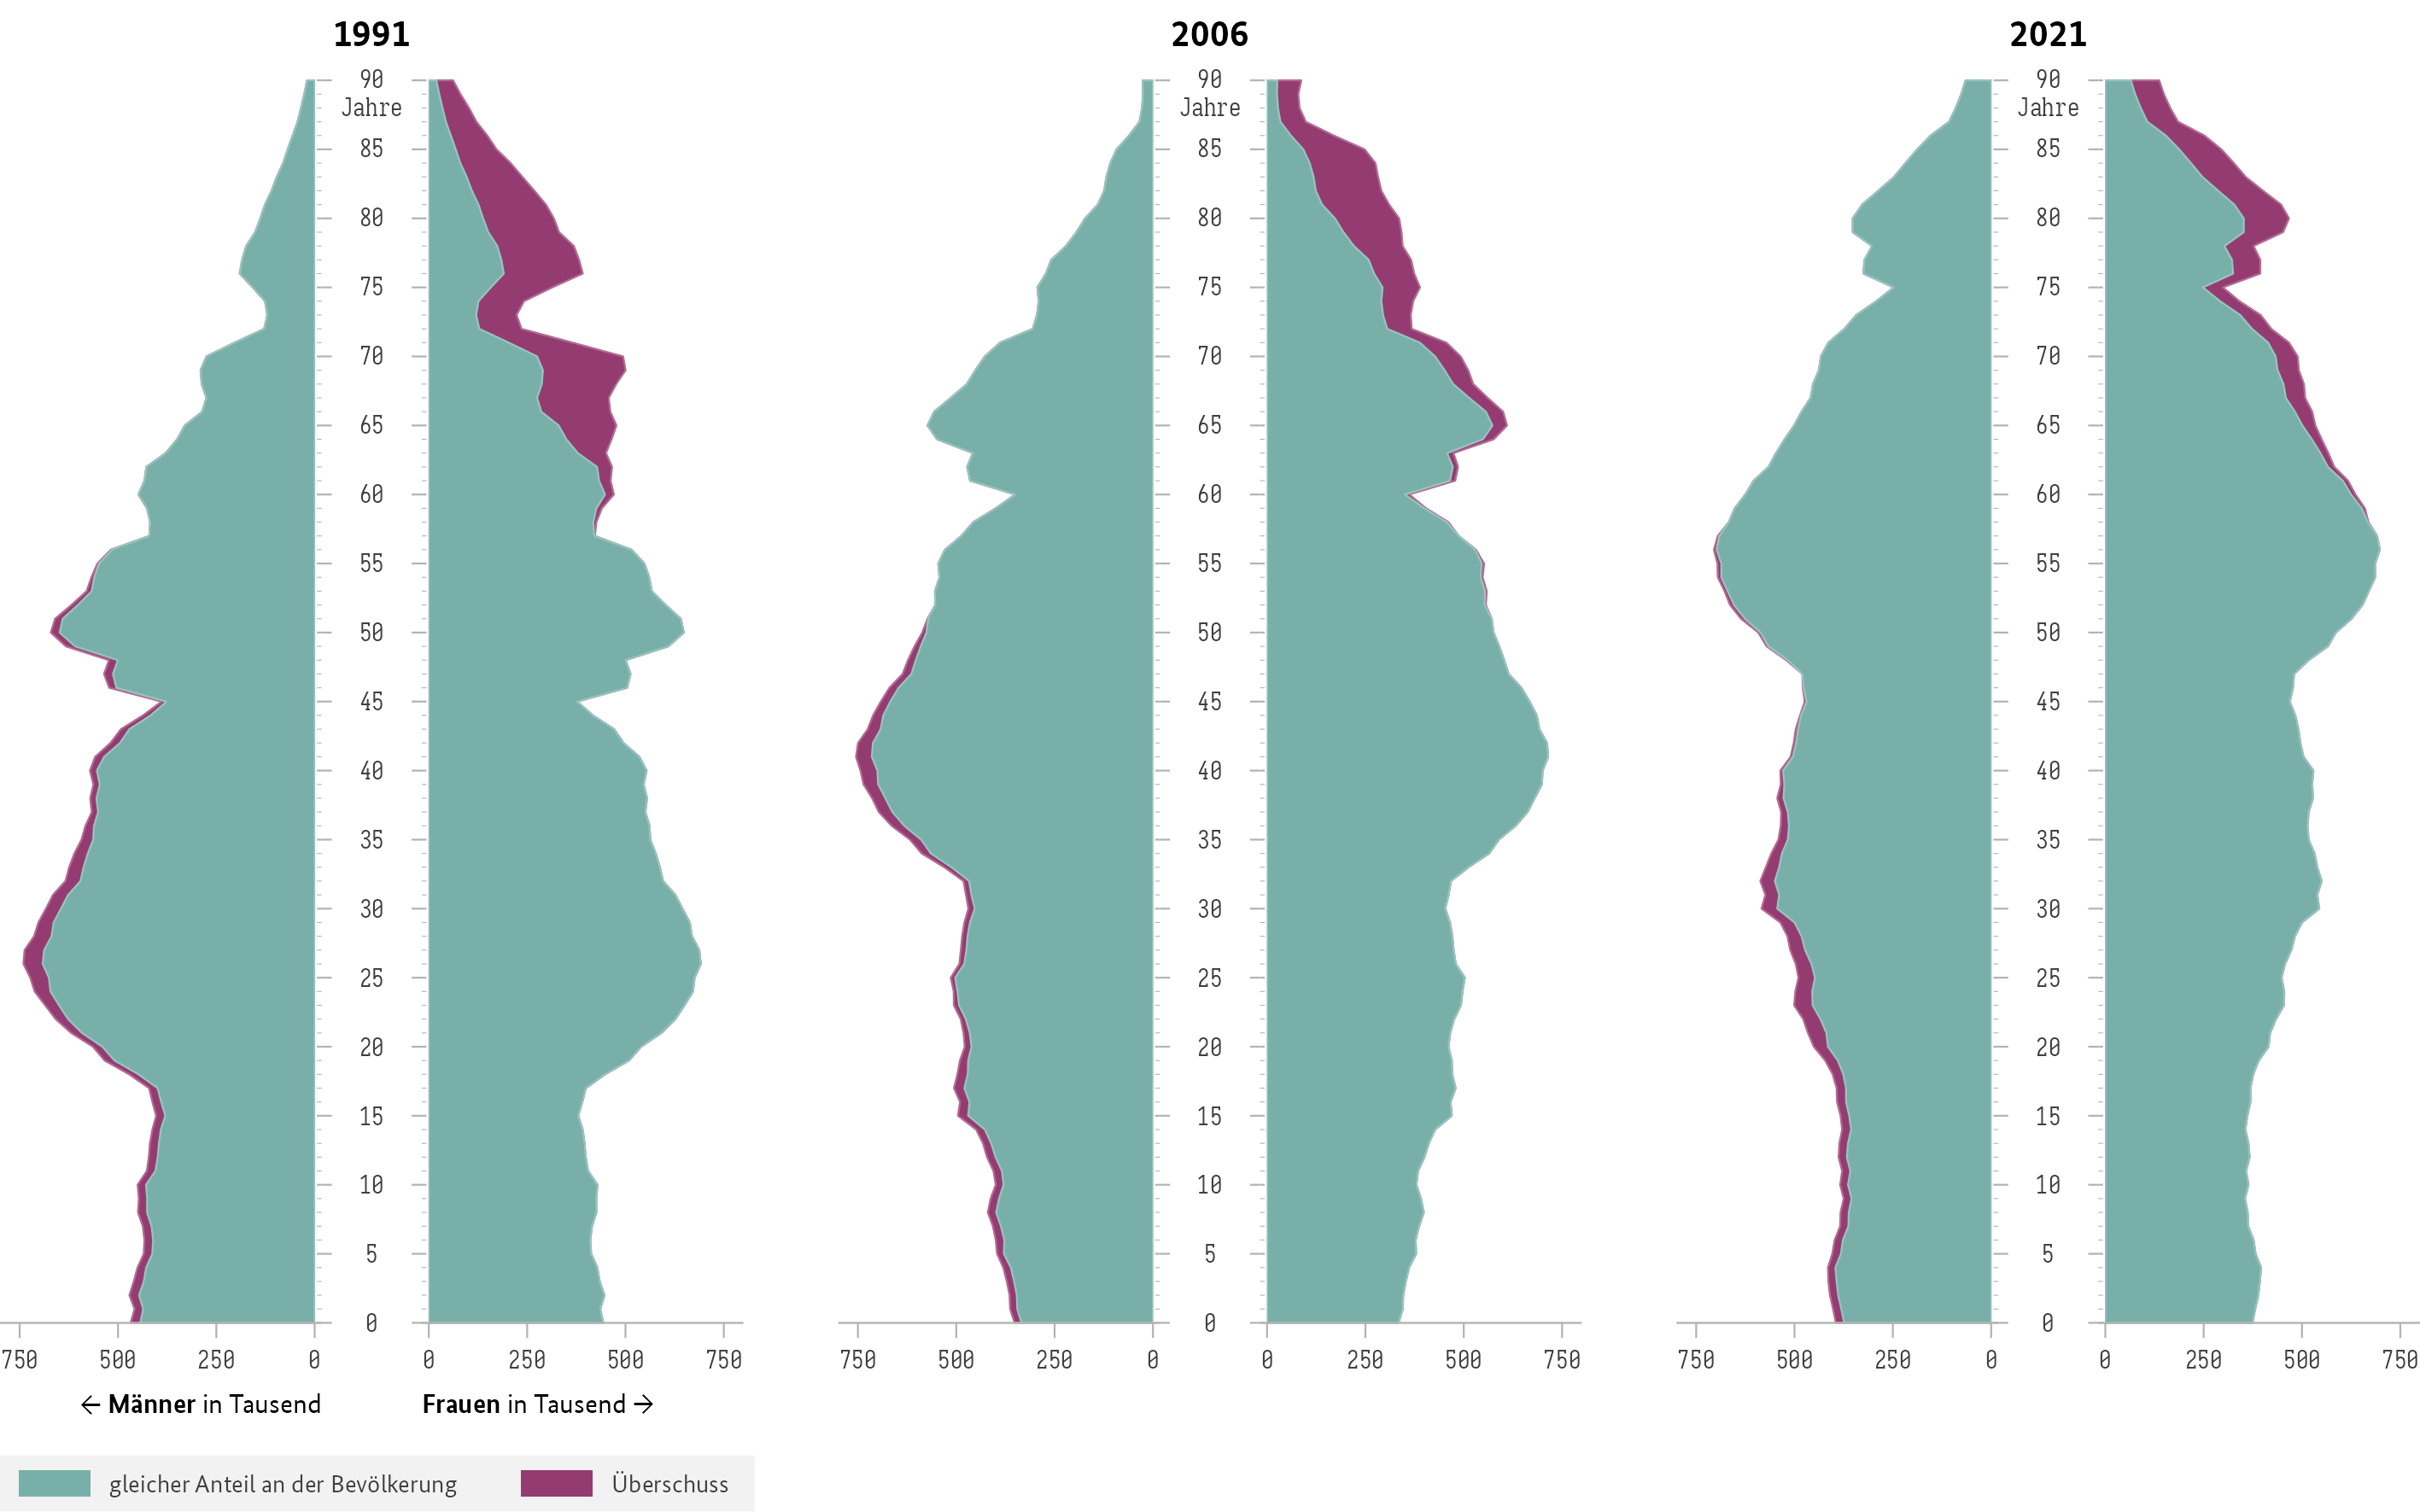
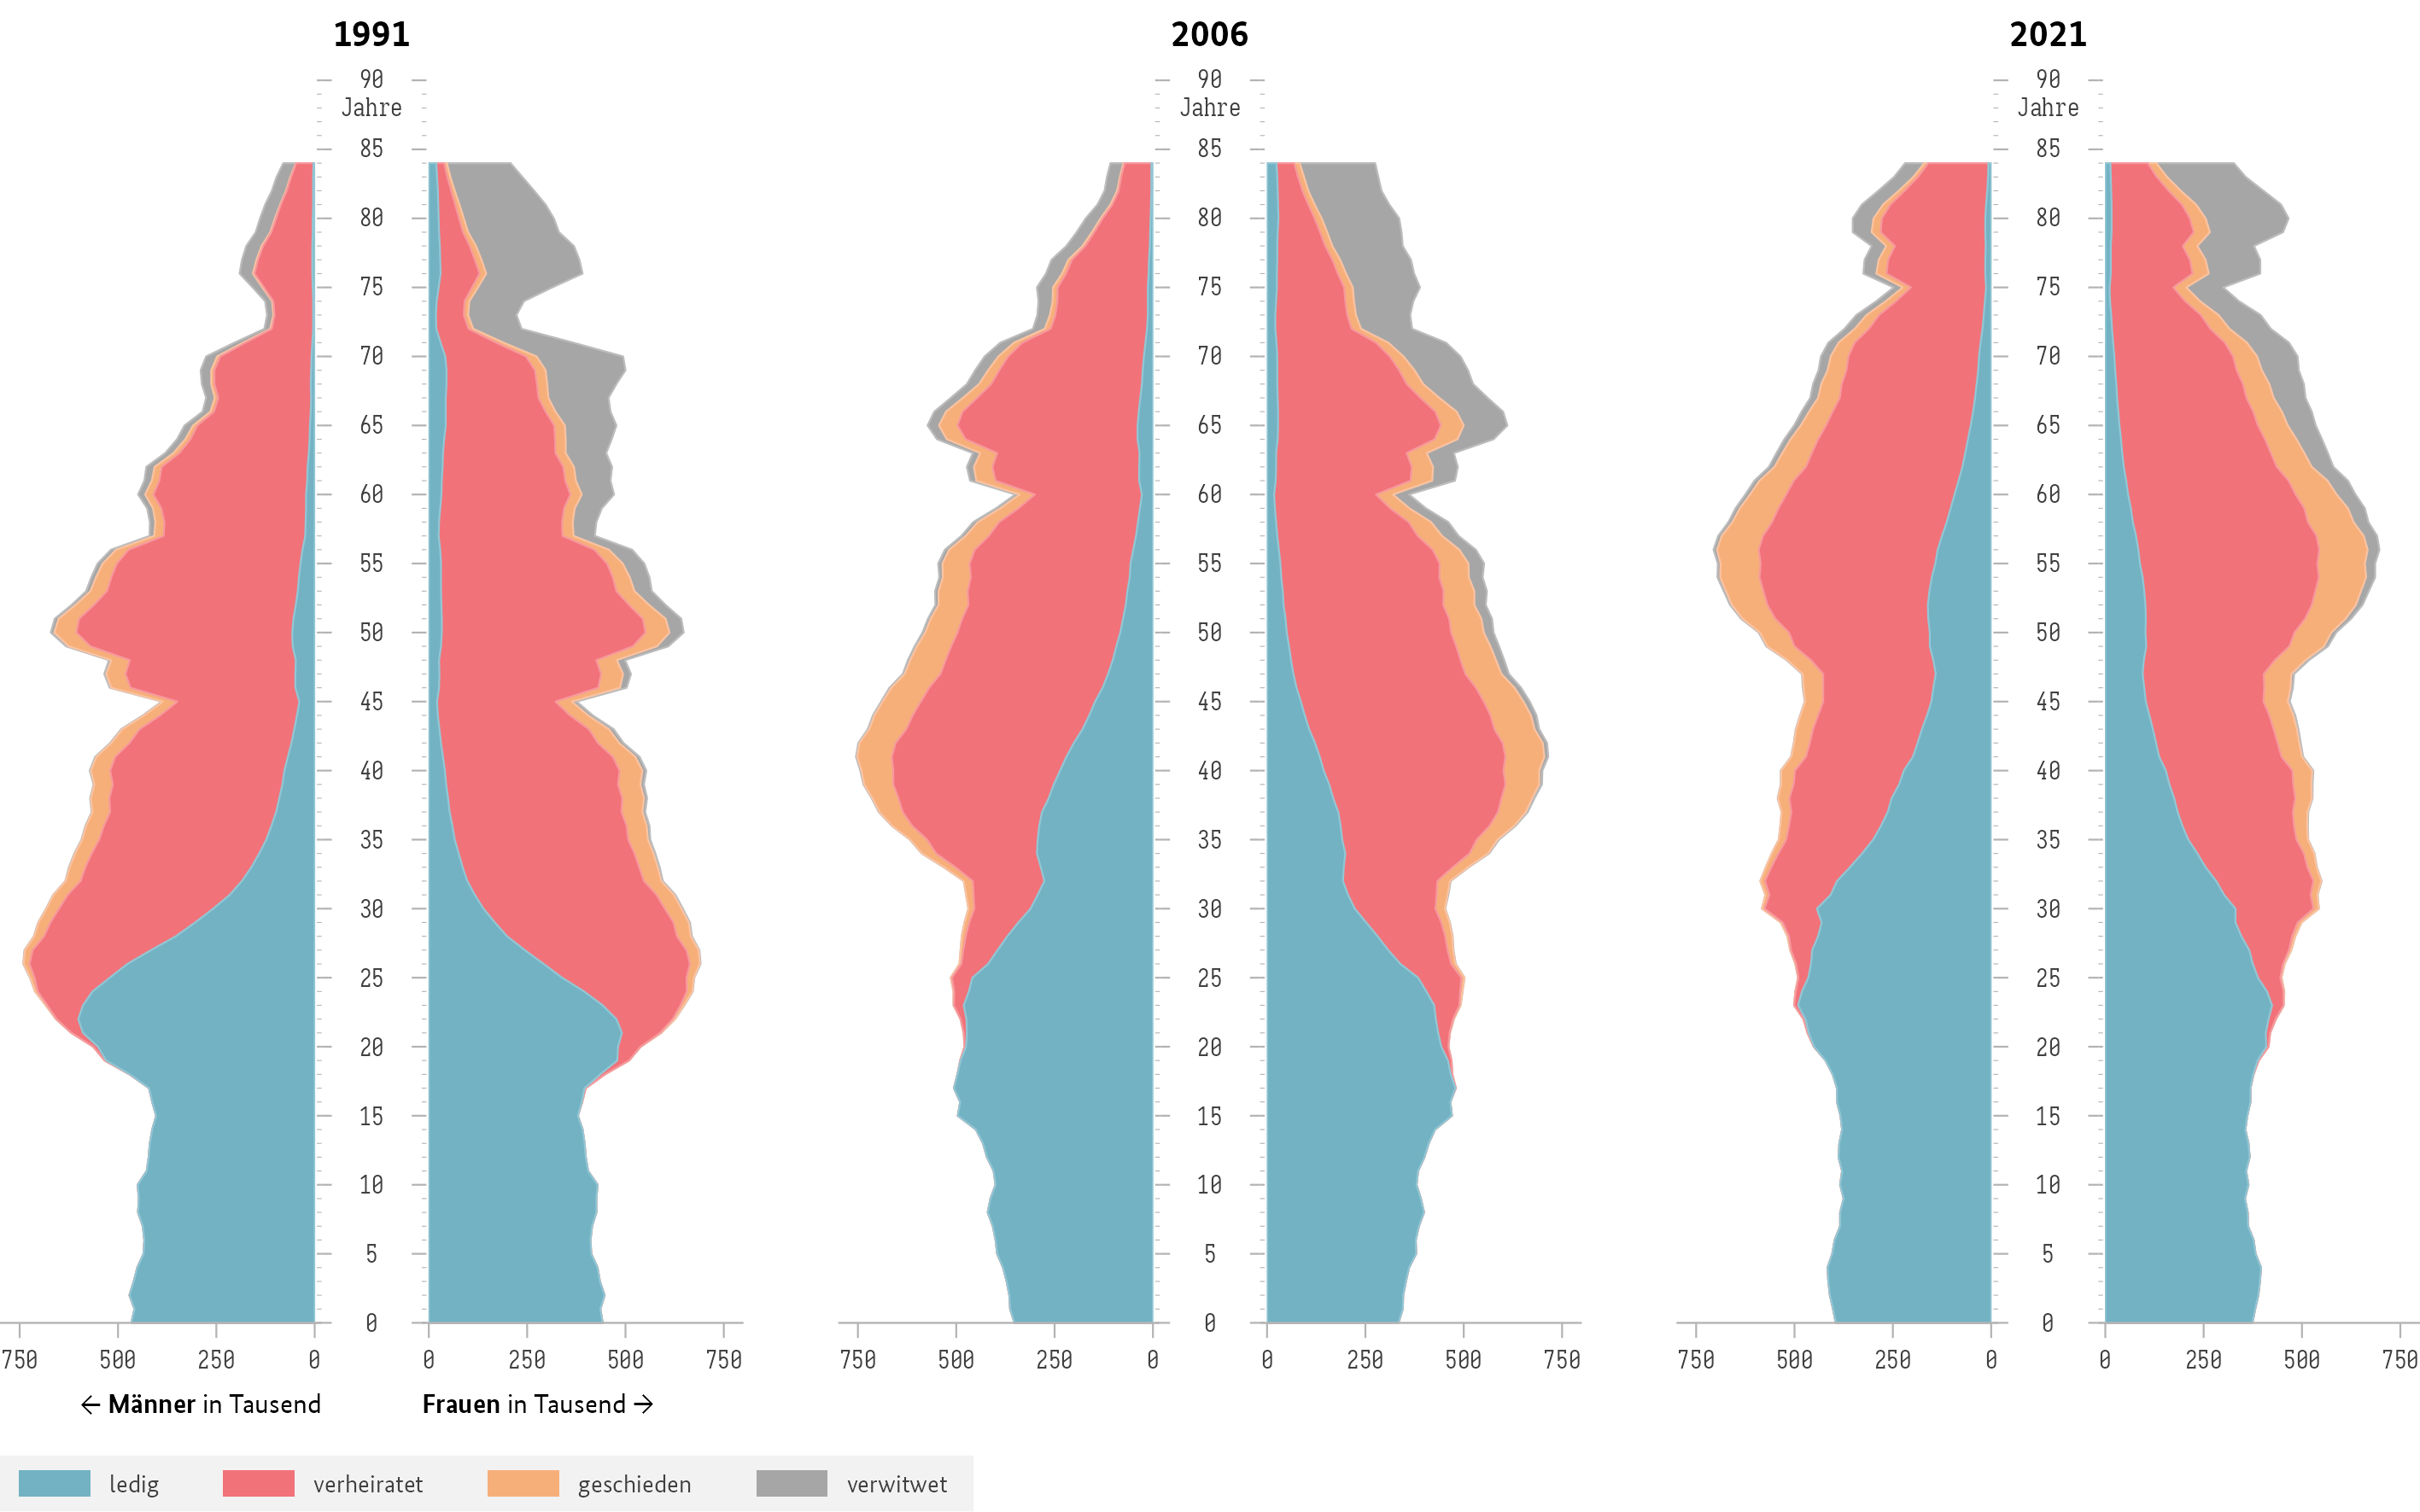
Die beispielhaften Visualisierungen der generellen Bevölkerungsstruktur sowie des Familienstandes in Deutschland im Jahr 1991, 2006 und 2021. Die hier gezeigte Grafik ist das direkte Ergebnis des Codes und wurde in der Programmiersprache R mit Hilfe der Grafikbibliothek {ggplot2} erstellt. Die finalen statischen Visualisierungen sowie Animationen wurden im Anschluss mit einem Vektrografikprogramm erstellt.
The exemplary visualisation of the general population structure in Germany in 1991, 2006 and 2021. The graphic shown here is the direct result of the code and was created in the programming language R with the help of the graphics library {ggplot2}. The final static visualisations as well as animations were subsequently created with a vector graphics tool.
-
Die Daten in diesem Repository umfassen zu Illustrationszwecken lediglich die generellen Bevölkerungsdaten sowie die Daten zum Familienstand. Die anderen genutzten Daten unterliegen einer Sperrfrist und sind daher nicht Teil des Repositories.
-
Das Notebook
BiB-population-pyramids.Rmdlädt die entsprechenden Daten und generiert die 3er Pyramiden als SVG Datei (zur Weiterverarbeitung) sowie Versionen mit einer Legende als PDF und PNG Dateien. -
Das Skript
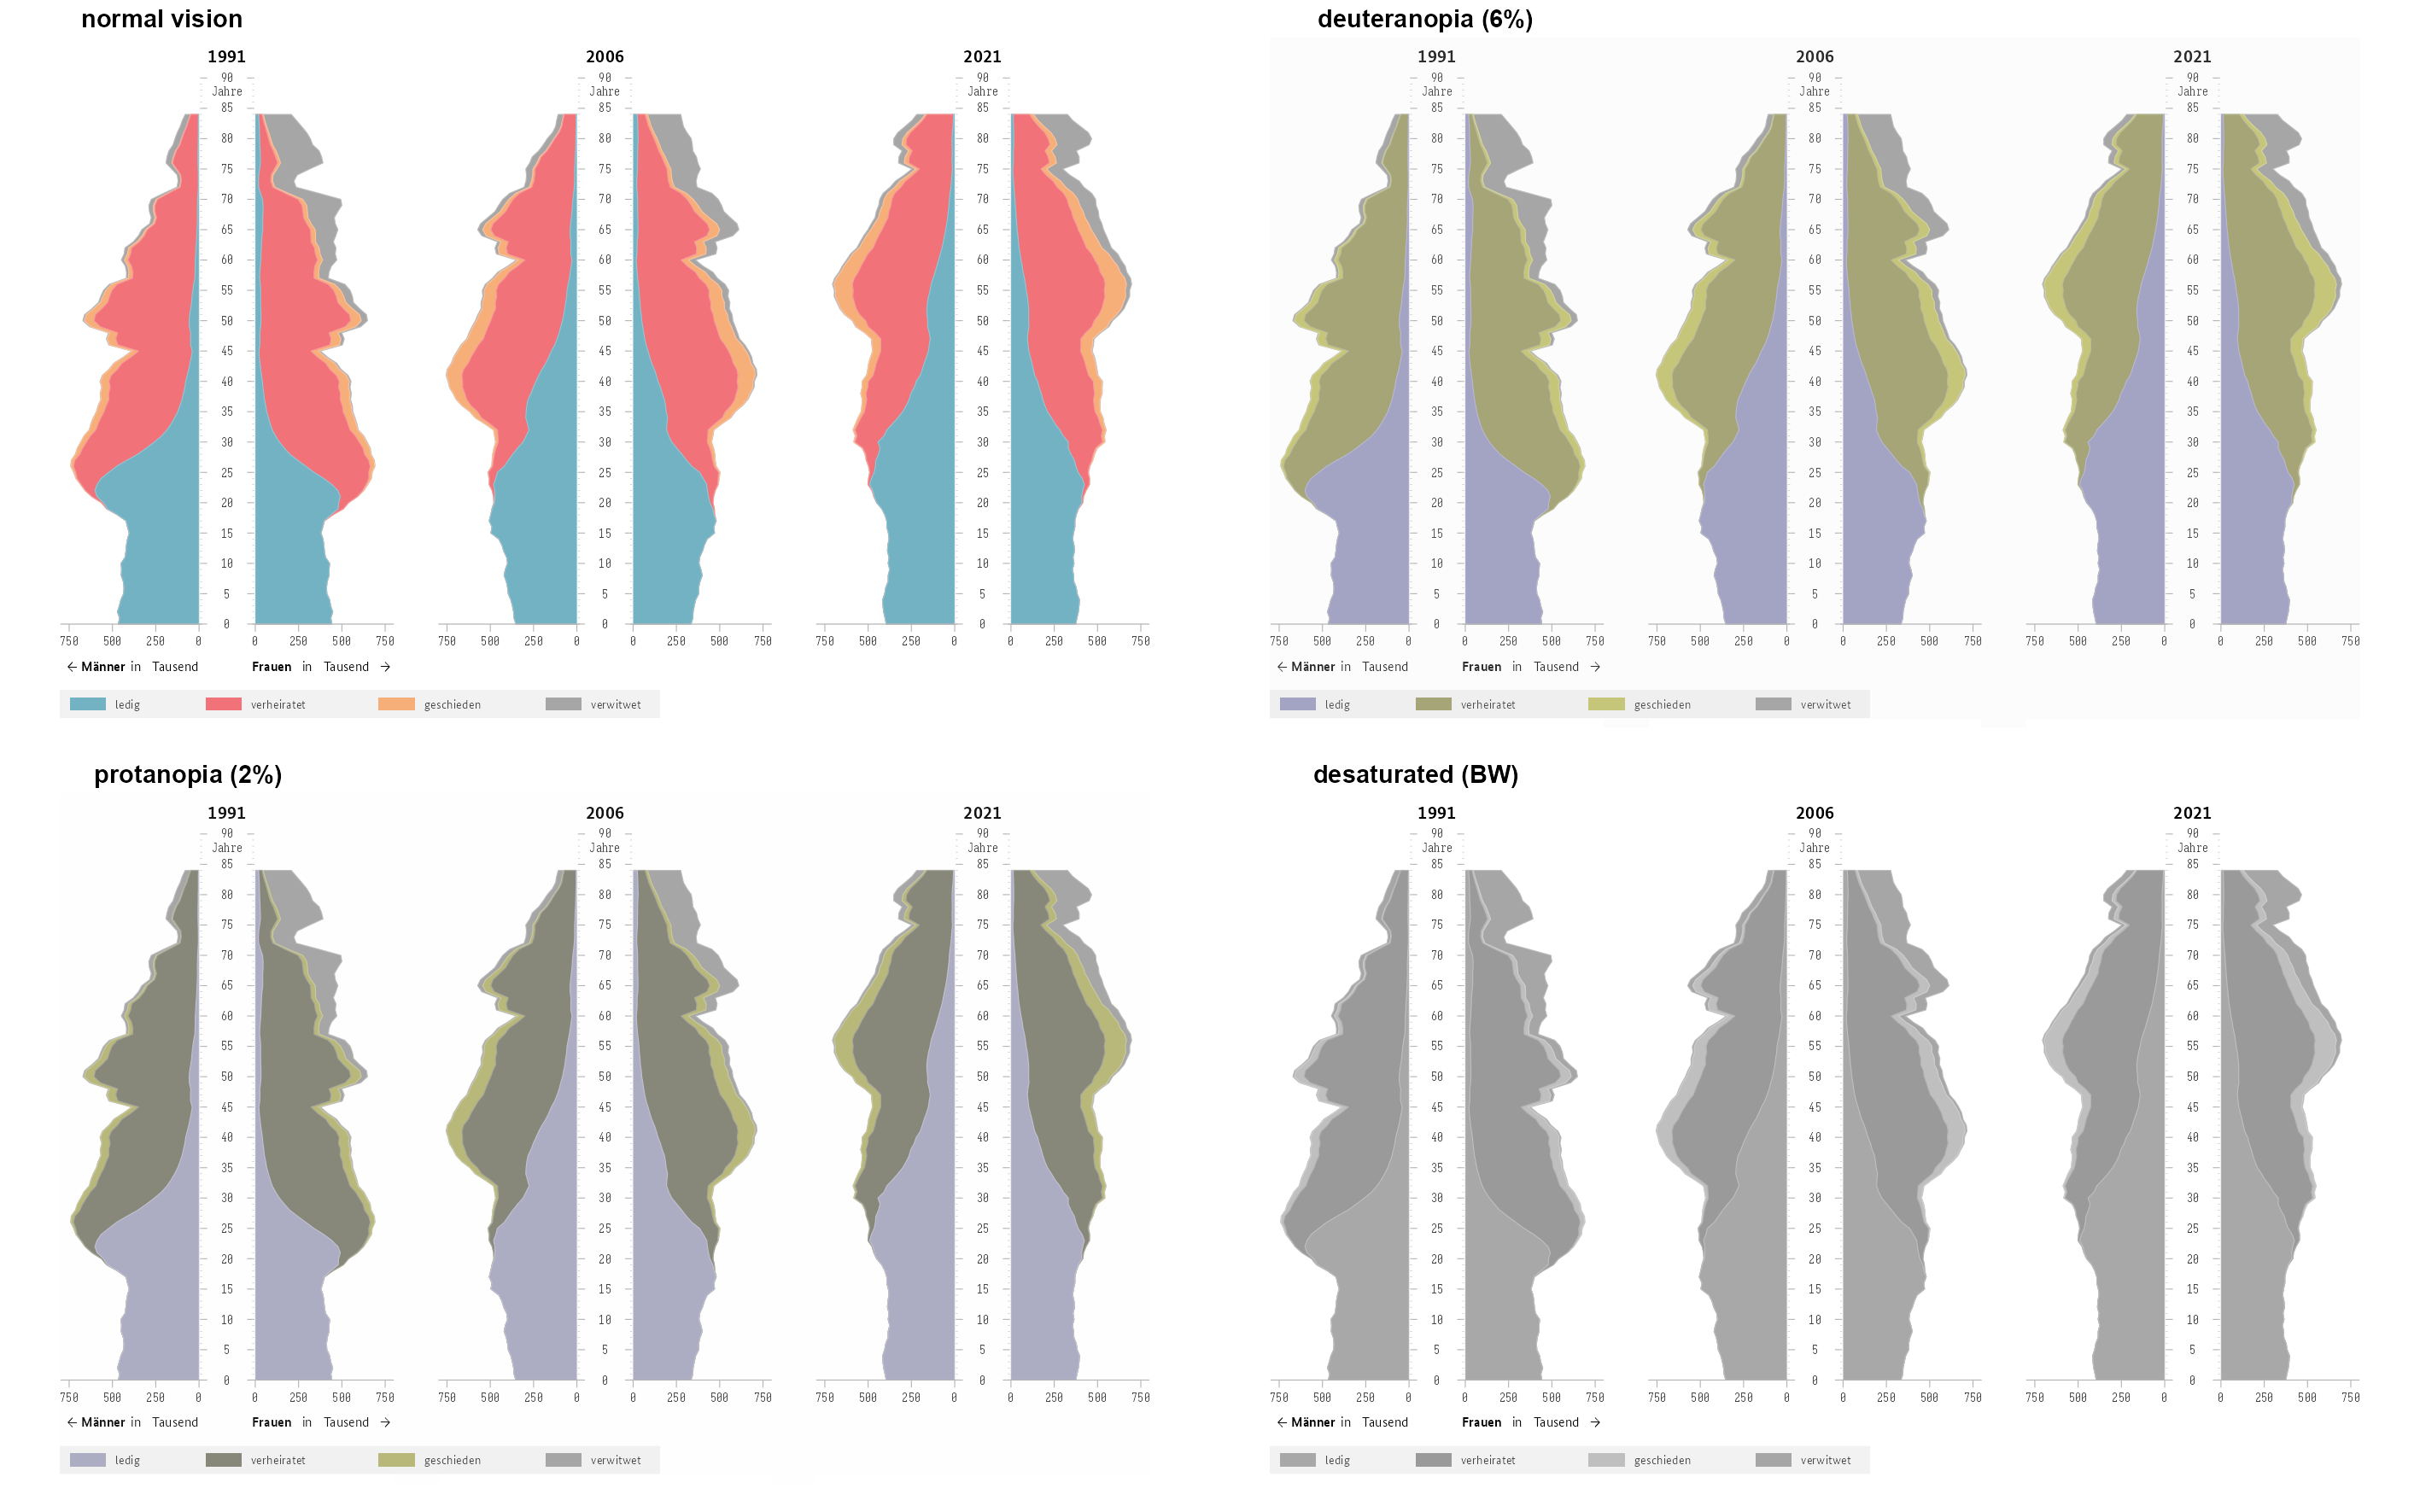
src/bib-pyramid-functions.Renthält die Funktionen zur Erstellung der Pyramiden. Die Funktionen sind nested: Die Hauptfunktion istdraw_set_pyramids()(bzw.draw_set_pyramids_2()) welches die Pyramiden mit Hilfe der Funktiondraw_pyramid()erstellt und anschließend in einem Gesamtlayout zusammenfügt. Die Funktiondraw_pyramid()wiederum nutzt die Funktiondraw_pyramid_side()zur Erstellung der linken und rechten Pyramidenhälfte. Zum Speichern der Grafiken in verschiedenen Formaten sowie zur Durchführung der Simulation von Farbblindheit wird die Funktiondraw_all_pyramids()genutzt. Zudem erhält das Skript eine Helferfunktion namesevery_nth()sowie ein eigens für die Pyramiden entworfenes{ggplot2}Theme namenstheme_bib(). -
Das Theme nutzt zwei Schriftarten, Iosevka Slab und BundesSans Web. Beide Schriftarten müssen auf dem System lokal installiert sein; erstere ist als open-source Projekt unter github.com/be5invis/Iosevka verfügbar. Die Schriftart BundesSans ist jedoch nicht frei erhältlich und muss ggf. gegen eine andere, auf dem System installierte Schriftart ausgetauscht werden.
-
The data in this repository includes only the general population data and the data sets on family status for illustrative purposes. The other data used are subject to a retention period and are therefore not part of the repository.
-
The notebook
BiB-population-pyramids.Rmdloads the corresponding data and generates the 3 pyramids as SVG files (for further processing) as well as versions with a legend as PDF and PNG files. -
The script
src/bib-pyramid-functions.Rcontains the functions to create the pyramids. The functions are nested: The main function isdraw_set_pyramids()(ordraw_set_pyramids_2()) which creates the pyramids using the functiondraw_pyramid()and then assembles them into an overall layout. The functiondraw_pyramid()in turn uses the functiondraw_pyramid_side()to create the left and right halves of the pyramid. The functiondraw_all_pyramids()is used to save the graphics in different formats and to simulate colour blindness. In addition, the script holds a helper function calledevery_nth()as well as a specially designed{ggplot2}theme for the pyramids calledtheme_bib(). -
The theme uses two typefaces, Iosevka Slab and BundesSans Web. Both typefaces must be installed locally on the system; the former is available as an open-source project at github.com/be5invis/Iosevka. However, the BundesSans typefaces is not freely available and may have to be exchanged for another font installed on the system.
This work is licensed under a Creative Commons Attribution-ShareAlike 4.0 International License.


