A QGIS plugin allowing you to quickly go from rasters like this:


From rasters like this:


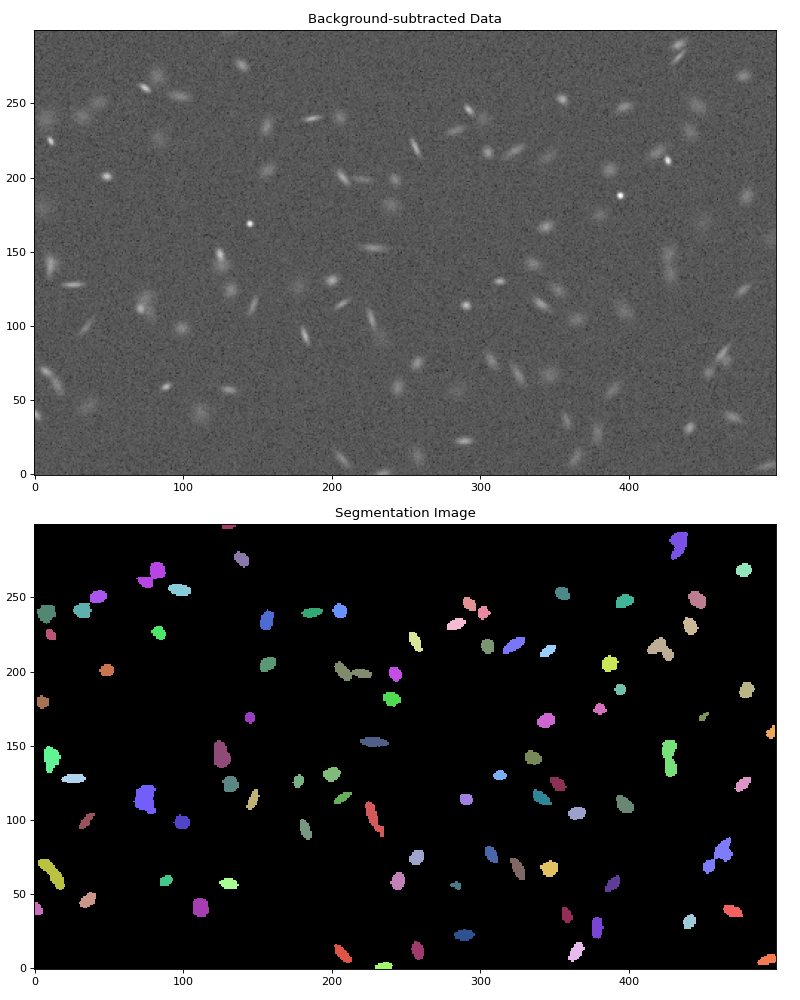
The algorithm NDVeye uses is largely based on this photutils tutorial: Image Segmentation. There, the starting point is an image of (simulated) galaxies. After background noise subtraction comes image segmentation:
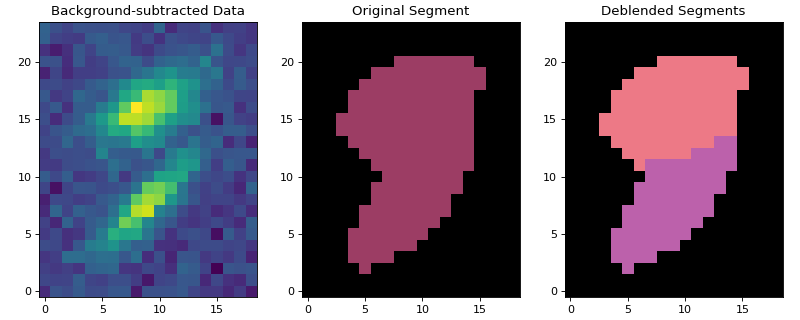
After the image segmentation is complete, a so-called deblending is performed: in this process, light sources which are detected as one source but are actually multiple sources are separated to multiple sources. This image explains it well:
We follow a similar algorithm. First, we subtract background noise. Currently, this value is taken to be constant throughout the image. The user interface refers to this value as Background offset. This line performs the subtraction.
Then, we convolve the background subtracted raster with a 2D Gaussian. We use astropy.convolution.convolve (here) and photutils.segmentation.make_2dgaussian_kernel (here). Users can set fwhm and size values of the Gaussian through fields Kernel FWHM and Kernel size. (Click on the functions to learn more about their parameters.)
We pass the result of the convolution to photutils.segmentation.detect_sources here. Users can specify the threshold parameter of this function through the Detection threshold input field; the npixels parameter through the Minimum pixel count input field; and the connectivity parameter throught the Connectivity: use 8 instead of 4 checkbox.
The next step is source deblending, performed via photutils.segmentation.deblend_sources. The user specified Minimum pixel count is used again as the npixels parameter. The nlevels and contrast parameters are set via the Number of deblending thresholds and the Minimum contrast for object separation input fields.
After these steps, detected sources (in the corn counting case: sources = corn plants) are polygonized & georeferenced through ordinary geospatial methods: no more astronomy software is involved.
In agriculture, it is often useful to know how many corn plants grow in a section of land. Experiments on different types of plants & treatments are often very localised. It is therefore helpful to be able quickly count how many corn plants there are in a row.
Download an example NDVI raster:
curl -O 'https://raw.githubusercontent.com/zabop/ndveye/master/docs/NDVIsource.tif'
If you prefer not using the terminal, you can also download the file from here. (We got the data using a DJI drone. We modified the location for privacy reasons.)
Open the downloaded TIF file in QGIS. Draw a polygon around some of the rows:

Create 4 raster files from these polygons:

We will use these rasters as input to NDVI. Explore pixel values:
- Background (ie non-corn) pixel values are around
$0.15$ - Target pixel values are more than that by around
$0.1$ - The smallest targets consist of around 2 pixels
- Smallest target's diameter is around 2 pixels. We found by trial and error that it is usually beneficial to undershoot this parameter, so let's just say smallest diameter is around 1.
Keeping these values in mind, we can launch NDVeye to identify corn plants:

If we aren't happy with the results, we can tweak NDVeye parameters a bit, or edit the layer we produced directly. Often, we will want to know the number of corn plants in each polygon. We can use the Vector -> Analysis Tools -> Count Points in Polygon... functionality to achieve that:

We can use NDVeye to improve OpenStreetMap, an open spatial database, "built by a community of mappers that contribute and maintain data about roads, trails, cafés, railway stations, and much more, all over the world".
There are some yet unmapped reefs within lagoons of the Tuamotus islands:


We can polygonize these reefs using NDVeye.
Let's use Sentinel-2 imagery as raster input. EO Browser can help us acquire suitable imagery. There, we can search for Toau atoll, edit cloud coverage settings, copy the s3 path of the image & visualize it straight away:

You can inspect the different bands in EO, and list available files using AWS s3 CLI:
aws s3 ls --request-payer requester sentinel-s2-l2a/tiles/6/L/XH/2024/3/26/0/ --recursive
I chose to work with the B04 band. Download imagery:
aws s3 cp --request-payer requester s3://sentinel-s2-l2a/tiles/6/L/XH/2024/3/26/0/R10m/B04.jp2 .
Drag and drop B04.jp2 to QGIS. Add Bing Aerial basemap (I like using QuickMapServices for this). Zoom to -15.918, -145.932 (I can recommend the Lat Lon Tools plugin).
These few steps in a gif:

We need a polygon to clip B04.tif by. Let's draw a polygon on the area of interest, and extract a raster from B04.tif. Save result to a tif file. Make sure Target CRS is set to EPSG:3857 and Output data type is set to float32.

We can use the Identify Features functionality to explore the pixel values of the layer in we just created:

The background, ie non-reef water pixels have value around a 1000. The reefs have pixel values a few hundred more. The smallest reefs we can hope to identify are 1 or 2 pixels wide, consisting of ~4 pixels at a minimum.
Open NDVeye from the Processing Toolbox. Specify input parameters, keeping in mind the numbers in the previous paragraph. Since we don't need deblending (ie we don't want to separate reefs which are touching), I set the Minimum contrast for object separation field to one.
 In the end, two layers (one of points, one of polygons) are added to canvas.
We can edit the style settings of our newly created polygon layer, and inspect the results. If we find there many reefs we haven't found, we need to change the input parameters (lowering Detection threshold would probably be a good first try.) Overall, this run was fairly successful, we found most reefs. There are a few false detections, but we cand delete these easily (I press the Backspace after highlighting the erroneous polygons):
 Quite many reefs have been found!
There are some issues with the plugin, listed below. We welcome help with any of them, and we are curious to learn more about what else could be improved. Open a Pull Request or contact us: [email protected].
- Hard to install. We aim to make the core code available from within QGIS. Steps to achieve this outlined here.
- Some users might find it hard to install dependencies, such as astropy and photutils. We don't yet see an easy and straightforward solution to this.
- Background offset is currently assumed to be constant throughout the input. This doesn't have to be the case. This photutils tutorial uses more advanced background handling. We found that this is not necessary to achieve most of our objectives with the plugin, but this might change.
- The user interface is somewhat complicated. For simple setups, we hope to make it more convinient.
- The progress bar is not very expressive. It is not a big deal when the input rasters are small and few, but when this is not the case, a better progress bar would be convinient.
- Input types are highly constrained now. Raster inputs are tested using float32, and it is known that some other widely used types are not compatible with some of the functions used now (background subtraction for instance). A fix would probably avoid some annoyance.
- Input raster has to be projected in EPSG:3857 now, as georeferencing of Astropy results assumes this projection. Probably it's not very big deal to expand the supported projections - we should do so.
- Sometimes, the plugin launches another QGIS instance. Reason unknown. Slightly annoying.

