GithubHelp home page GithubHelp logo

zhaozm007 / d3improvedradarchart Goto Github PK

View Code? Open in Web Editor NEW

This project forked from brianbooden/d3improvedradarchart

0.0 1.0 0.0 4.16 MB

Qlik Sense Implementation of Nadieh Bremer's Improved D3 Radar Chart

JavaScript 100.00%

d3improvedradarchart's Introduction

Interactive Radar Chart

Developed by Brian Booden & Matthieu Burel, based on D3.js

Update 05/10/2016

  • Added support for 10k points, previously was limited to 50
  • Simplified Dimensions by adding 2 mandatory, instead of 1 mandatory and 1 optional, which was confusing
  • Reworked, simpler color schemes
  • Tweaks to label sizes, radar positioning and margins, and legend spacing, to make best use of space

Please try the new version, and leave feedback, as we endeavour to improve our extension!

Regards, Brian and Matt

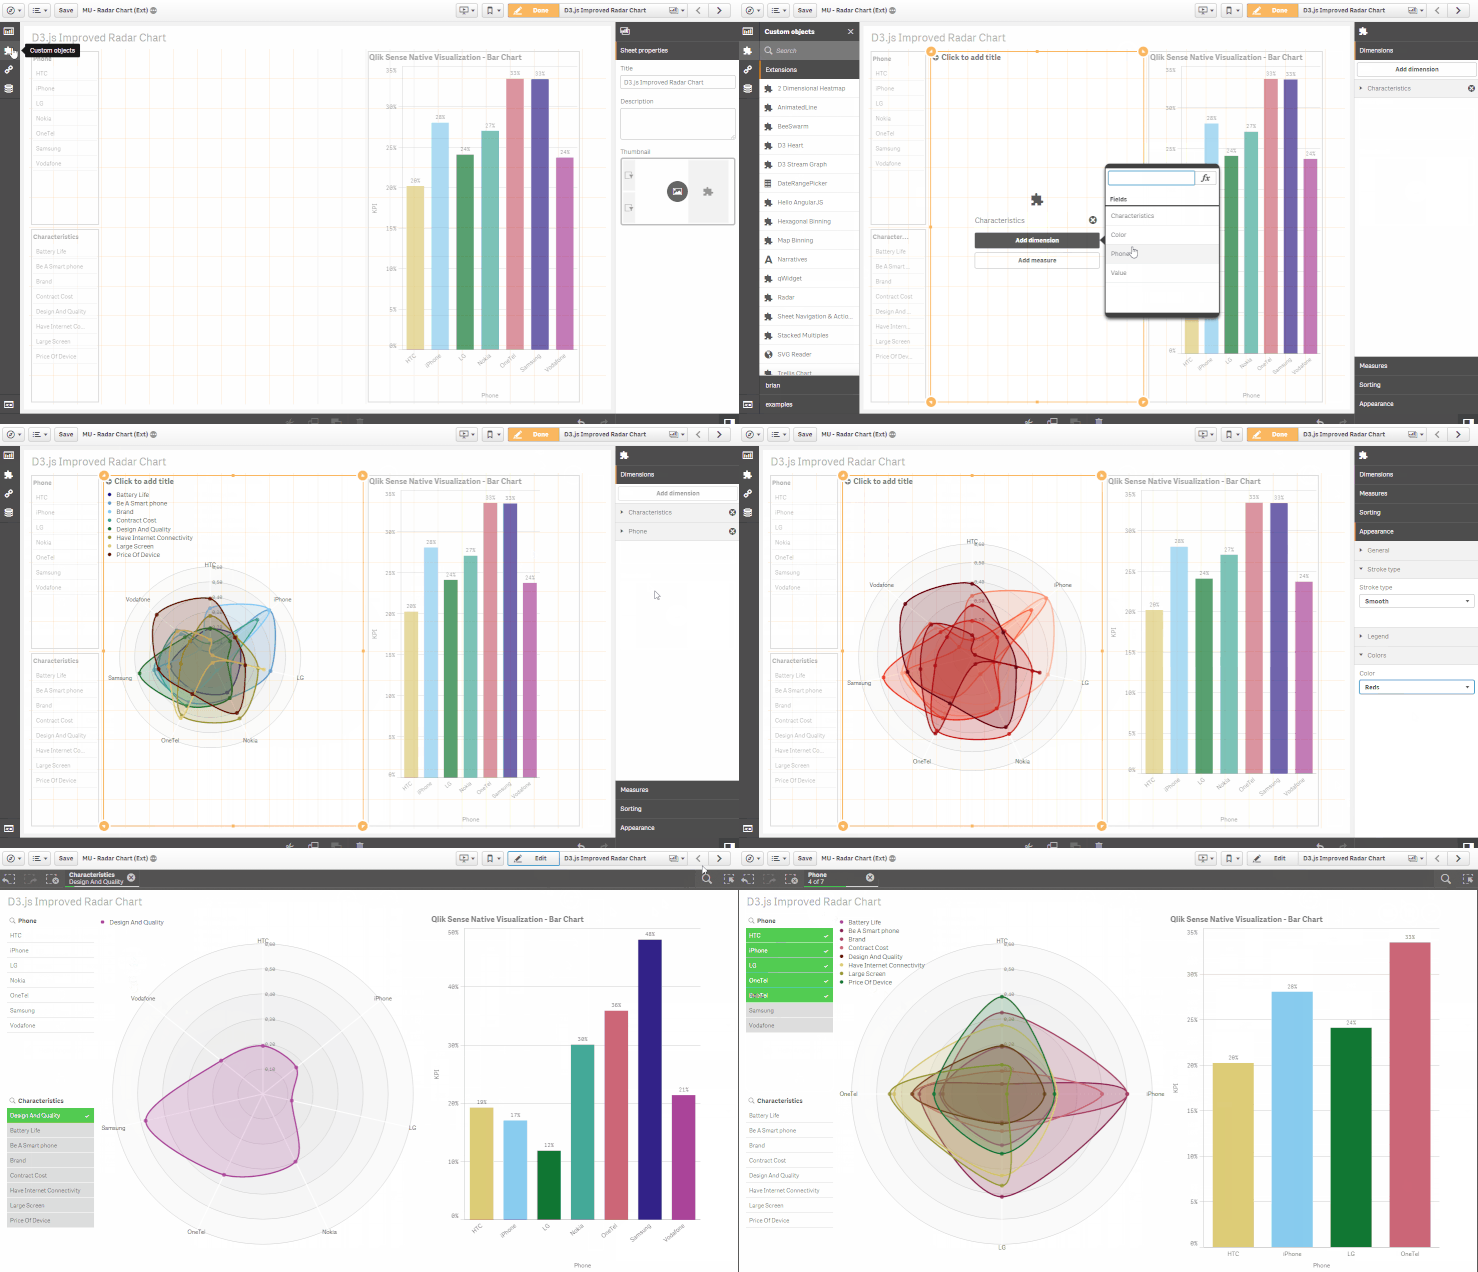
Interactive Radar Chart demonstration

=================

Qlik Sense extension displaying multivariate data in the form of a two-dimensional chart of three or more quantitative variables represented on axes starting from the same point: http://en.wikipedia.org/wiki/Radar_chart

The extension is based on and/or inspired by :

  • Original radar chart extension, developed by Borja Rodriguez : here
  • D3.js, using by Nadieh Bremer to design alternative radar chart look & feel : here
  • Susie Lu's legend maker here
  • Chroma.js, Gregor Aisch's color palette generator : here

d3improvedradarchart's People

Contributors

vizmatt avatar brianbooden avatar

Watchers

 avatar

Recommend Projects

  • React photo React

    A declarative, efficient, and flexible JavaScript library for building user interfaces.

  • Vue.js photo Vue.js

    ๐Ÿ–– Vue.js is a progressive, incrementally-adoptable JavaScript framework for building UI on the web.

  • Typescript photo Typescript

    TypeScript is a superset of JavaScript that compiles to clean JavaScript output.

  • TensorFlow photo TensorFlow

    An Open Source Machine Learning Framework for Everyone

  • Django photo Django

    The Web framework for perfectionists with deadlines.

  • D3 photo D3

    Bring data to life with SVG, Canvas and HTML. ๐Ÿ“Š๐Ÿ“ˆ๐ŸŽ‰

Recommend Topics

  • javascript

    JavaScript (JS) is a lightweight interpreted programming language with first-class functions.

  • web

    Some thing interesting about web. New door for the world.

  • server

    A server is a program made to process requests and deliver data to clients.

  • Machine learning

    Machine learning is a way of modeling and interpreting data that allows a piece of software to respond intelligently.

  • Game

    Some thing interesting about game, make everyone happy.

Recommend Org

  • Facebook photo Facebook

    We are working to build community through open source technology. NB: members must have two-factor auth.

  • Microsoft photo Microsoft

    Open source projects and samples from Microsoft.

  • Google photo Google

    Google โค๏ธ Open Source for everyone.

  • D3 photo D3

    Data-Driven Documents codes.