GithubHelp home page GithubHelp logo

anvaka / pm Goto Github PK

View Code? Open in Web Editor NEW
1.4K 31.0 139.0 11.62 MB

package managers visualization

Home Page: https://anvaka.github.io/pm/

License: MIT License

JavaScript 90.48% HTML 1.70% Shell 0.23% Batchfile 0.04% Less 7.54%

pm's Introduction

Software Galaxies

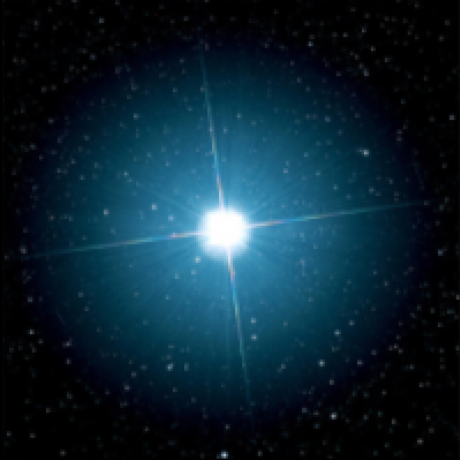
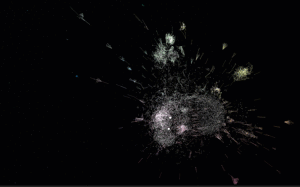
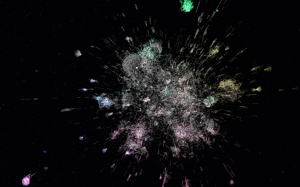
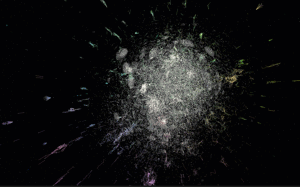
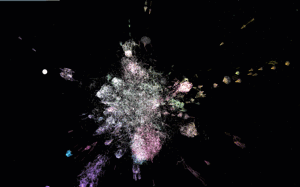
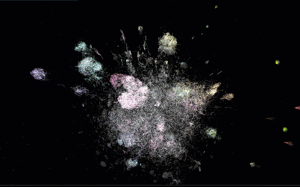
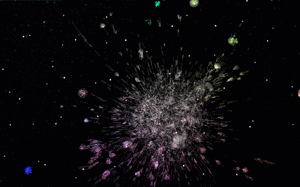
This repository combines visualizations of major software package managers.

All visualizations are available here: http://anvaka.github.io/pm/#/

Please read operating manual - it is short and describes basic navigation principles.

Repository was create for my talk at CascadiaJS 2015

After conference update - video - slides

Friends, you are awesome! I can't express how much I appreciate all your kind words and warm feedback. It really means a world for me. Thank you!

Individual Visualizations

Each graph is indexed individually, and data is pushed to gh-pages branch of galactic-data.

Bower


indexer | demo

PHP Composer


indexer | demo

Ruby gems


indexer | demo

npm


indexer | demo

Go


indexer | demo

R language


indexer | demo

Debian


indexer | demo

Arch Linux


indexer | demo

Arch Linux + AUR


indexer | demo

NuGet


indexer | demo

Homebrew


indexer | demo

PyPI


indexer | demo

Fedora


indexer | demo

Rust Crates


indexer | demo

Elm


indexer | demo

local development

git clone https://github.com/anvaka/pm
cd pm
npm i
npm start

This will start local development sever with auto-rebuild.

Your own graphs

This section has detailed instructions about how to use the tool with your own graphs. Before you read any further, if your graph is smaller than 10k nodes, consider using ngraph.pixel or VivaGraph both should be able to provide interactive layout.

If you have an interesting graph but don't have JavaScript experience, please feel free to reach out to me and I'll try to make visualization for you (my email is [email protected]).

Otherwise, if you want to hack on your own, please keep reading.

Graph

First, you will need a graph in ngraph.graph format. The ngraph.graph has detailed documentation about how to create graph, but it also has several loaders from popular graph formats (e.g. dot, gexf)

Layout

Now that you have a graph we need to compute the layout.

If your graph is smaller than 200k nodes, consider using ngraph.offline.layout. This module was created exactly for the purpose of the pm project, it is well documented, and should be easy to get started with. You can also read layout.js of all[gems|go|bower] packages to see more examples.

If your graph is much larger than 200k nodes, then consider using ngraph.native - this module is harder to work with (as it requires C++ knowledge), but it is much faster.

The secret GitHub visualization is using ngraph.native.

Data format

Once layout is computed, we are ready to visualize. Just save the graph using ngraph.tobinary and store it along with latest positions file (produced by layout) into a folder.

The folder structure should look like this:

.
└── my-pm-data-server
    └── my-graph
        ├── manifest.json
        └── version-1
            ├── labels.json         /* this file is produced by ngraph.tobinary */
            ├── links.bin           /* this file is produced by ngraph.tobinary */
            └── positions.bin       /* this file is produced by ngraph.native   */

The file manifest.json describes what version of the graph are available and has the following content:

{
  "all": ["version-1"],
  "last": "version-1"
}

Inside my-pm-data-server we launch a web server. I personally prefer http-server. Once it is installed globally (npm i http-server -g), you can launch it like this:

http-server --cors -p 9090

This will start a local data server at http://127.0.0.1:9090/

Update the config.js in this repository to point to your data server, and your graph should be accessible at

http://127.0.0.1:8081/#/galaxy/my-graph

Note

The galactic-data follows the same data structure as described above. Use it for the reference if you need an example

The secret visualization

The last shown visualization was secret GitHub followers visualization. It shows all GitHub users who has more than two followers.

The visualization has more than 1,100,000 nodes, and renders at 60 fps when flying around. The FPS drops when you hover-over nodes to 20-30, This is because we are doing hit-testing, to find what's under cursor.

With this many nodes, it runs well in the browser. Unfortunately it requires more than 1GB of RAM. Which may or may not crash your phone browser - sorry about this.

With all warnings said, here are the links:

Feedback

Please do not hesitate to provide your feedback or bug fixes. Even if it is something small like fixing a typo - I'd be glad to hear from you!

pm's People

Contributors

anvaka avatar phiresky avatar zacanger avatar

Stargazers

 avatar  avatar  avatar  avatar  avatar  avatar  avatar  avatar  avatar  avatar  avatar  avatar  avatar  avatar  avatar  avatar  avatar  avatar  avatar  avatar  avatar  avatar  avatar  avatar  avatar  avatar  avatar  avatar  avatar  avatar  avatar  avatar  avatar  avatar  avatar  avatar  avatar  avatar  avatar  avatar  avatar  avatar  avatar  avatar  avatar  avatar  avatar  avatar  avatar  avatar  avatar  avatar  avatar  avatar  avatar  avatar  avatar  avatar  avatar  avatar  avatar  avatar  avatar  avatar  avatar  avatar  avatar  avatar  avatar  avatar  avatar  avatar  avatar  avatar  avatar  avatar  avatar  avatar  avatar  avatar  avatar  avatar  avatar  avatar  avatar  avatar  avatar  avatar  avatar  avatar  avatar  avatar  avatar  avatar  avatar  avatar  avatar  avatar  avatar  avatar

Watchers

 avatar  avatar  avatar  avatar  avatar  avatar  avatar  avatar  avatar  avatar  avatar  avatar  avatar  avatar  avatar  avatar  avatar  avatar  avatar  avatar  avatar  avatar  avatar  avatar  avatar  avatar  avatar  avatar  avatar  avatar  avatar

pm's Issues

Controls too sensitiv

The controls are just to sensitive.

This includes wasd, left,right,up,down and the mouse as well as the mouse mode activated by space.

Filter based on name

It would be neat if you could filter based on name and have just those nodes (and maybe their dependencies/dependents) show up, or at least just those links at any length.

E.g. the biojs-* set of packages generally depend on one another for functionality, but they're fairly widely spread across the "galaxy", and thus hard to see relationships amongst them.

Add NuGet &| MyGet :)

Please add NuGet and MyGet support.

I have found some related resources:

@davidfowl, @pranavkm, is there a better (API) way to get packages and their dependencies information (preferably in JSON) for this kind of scenarios where node.js app wants to interact with NuGet like these: https://github.com/anvaka/pm/tree/master/src/galaxy/nodeDetails/templates, in order to be able to form the graphical galaxy: https://anvaka.github.io/pm/ ?

CPAN graph?

I don't have the JS chops to build one myself, but i can tell you where to easily get the data.

There's the ElasticSearch-based metacpan API which is documented here and here:
https://www.elastic.co/guide/en/elasticsearch/reference/current/query-dsl.html
https://github.com/CPAN-API/cpan-api/blob/master/docs/API-docs.md

To get all the distributions on CPAN, you can build on this query:
http://api.metacpan.org/v0/distribution/_search

To get the dependencies for each distribution, you can build on this query:
http://api.metacpan.org/v0/search/reverse_dependencies/MetaCPAN-API

Note also that these URLs can easily be tested on the metacpan explorer:
https://explorer.metacpan.org/#/5706053

Total graph size should be around 32469 nodes.

Build and deploy static React app?

I've cloned the package and followed the instructions to visualize my graph using a local server, after determining the correct package structure.

I want to "save" a static copy of this graph that I can host on GitHub, like the one @anvaka is hosting on his GitHub and that is in the pm/build directory. When I run npm run build in the cloned copy of the pm package, I rebuild the original React app with the package galaxies, instead of my graph.

This may be a very novice question, but how do I use npm to generate a build of my own visualization? What should I be targeting—package structure changes, code, etc.?

Scala

Hi @anvaka

I saw your video from CascadiaJS 2015, awesome work!

I work for the Scala Center. We built https://index.scala-lang.org with data from Github and Maven Central. I was trying to draw the graph Scala dependencies using Graphviz but it was just a fur ball :P. Today I will your visualizer hopefully I can have a PR.

bind 'h' and '?' to toggle the 'help' window

Seems that for some scrolling the mouse is not the most intuitive way to bring up the help window, would be cool if you can add 'h' and '?' key bindings as additional methods to toggle the help window.

Add more details to the "Your own graphs" section

Hi,
I followed the steps from the "Your own graphs" section

I was able to generate the files ( positions.bin, labels.json and links.bin )

the next step writes :

Follow the same folder structure as in galactic-data.

Update the config.js in this repository to point to your data server, and you are ready to explore your own graph.

So I put the file on an express.js server into the path /public/npm/2016-06-16T00-00-00Z
I added a manifest.json file into /public/npm/

{
  "all": [
    "2016-06-16T00-00-00Z"
  ],
  "last": "2016-06-16T00-00-00Z"
}

I changed the config.js to

export default {
  //dataUrl: '//anvaka.github.io/galactic-data/'
  dataUrl: '//localhost:8082/'
};

Then I launched anvaka/pm with npm start

It didnt work. I don't see error in any consoles.

I was expecting to see my own graph on http://127.0.0.1:8081/#/galaxy/npm?

Could you provide additional information on the last step ?

Failed at start script

When I try npm start I get the following error:

npm ERR! Windows_NT 6.1.7601
npm ERR! argv "C:\Program Files\nodejs\node.exe" "C:\Program Files\nodejs\node_modules\npm\bin\npm-cli.js" "start"
npm ERR! node v5.0.0
npm ERR! npm v3.3.6
npm ERR! code ELIFECYCLE
npm ERR! [email protected] start: PORT=8081 node dev-server.js
npm ERR! Exit status 1
npm ERR!
npm ERR! Failed at the [email protected] start script 'PORT=8081 node dev-server.js'.
npm ERR! This is most likely a problem with the pmviz package,
npm ERR! not with npm itself.
npm ERR! Tell the author that this fails on your system:
npm ERR! PORT=8081 node dev-server.js
npm ERR! You can get their info via:
npm ERR! npm owner ls pmviz
npm ERR! There is likely additional logging output above.

Any hint?

help needed for deployment

Hi! My goal is to create something similar with your work on embeddings.
After cloning the two repos, I have created a directory my_data under your project pm, containing labels.json links.bin and positions.bin as described. I have also changed the `src/config.js' to have:

export default {
  dataUrl: './my_data/'
};

However, when I start npm start, it automatically shows the Code Galaxies Visualization. I guess I am losing a path or something simple. How can I see my visualization?

big data

I have 30 000 000 points to draw but the memory is not enough. NGraph can also not finished computing in several hours with only 3 000 000 points using ngraph.tobinary. I was wondering if there are methods or tricks to deal with massive data efficiently. Waiting for your reply.

Arbitrary information

Hello!

Great project, I'm importing data through a .CSV, so my code looks a bit like this

    let src = newData[0]; //source
    let dst = newData[1]; //destination

    //link  
    g.addLink(src, dst); // now graph 'g' has two new nodes: 'src' & 'dst'

Is there any way to add arbitrary data, for example if I had another parameter "newData[2]" that represented the information about the node, or the edge relationship, and add that to any node/link so that information is visible on-screen? Perhaps somewhere like here ?

Also, just wondering if there are any future plans to add a feature to add custom node or link colors, in my case I need to base them off a third data point (if that's possible in this project) that describes the relationship of source/destination.

Very sorry to bother you,
Thanks for any help you are willing to offer.

how to generate the position.bin

Hi, the position.bin consists of the position of node, but i see the ngraph.tobinary does not generate it. i want to exchange my own data to that format so i can use the ngraph.

Add explanation of size to the descriptions

Nice and fun utility. I couldn't find an explanation of why some stars are so much larger than others. Natural tendency is to steer toward clusters and largest stars. Clusters are explained (cool!), but size is not.

Mispositioned Graph

Hi all,

I generated my own graph (based on this Andreis fantastic work) for BGP related routing data and in general it works.
However, the graph is not positioned centrally (x=0,y=0,z=0) and therefore the link/edge colors (which base on the graphs position) are all yellow as it is shown on attached image:

image

Does anyone know how to fix this positioning issue?

@anvaka : I can provide the source files if you want to debug.

sort results in search & info

is it possible to (by default) sort the results in the search window or the info window when you click a node? For some PMs it might make sense to sort the search results on name, or on in-degree, right now it is all random it seems. I'd prefer by default an alpabetic/numeric sort on the name of the node

Visualize # of dependents?

I'd be very interested to see a visualization that reflects either the number of direct dependents or the total dependents in a graph rooted on each package. It might use brightness and/or color. Size probably doesn't work that well because size is so influenced by distance.

how to set color on links

hello
in my project create graph like this :
graph.addLink(item.from, item.to,{color:"red"})

then create binary file from graph like this :
ToBinary.BuildBinaryGraph(graph);


so how to get {color:"red"} in function setLinks(buffer) from project pm ??
and set my color to lineView.render(...)

Please Help Me.

Ability to find the software package in the Galaxy.

It would be cool to have a means in the search to basically go on "autopilot" and have the user taken to a specific package they searched for.

This is such a cool bit of fun. Thanks for the hard work!

Scott

Need help with data server

Hi anvaka, thanks for your great great galaxy visualisations!
I tried to build my own graph visualisation using the instructions you give under "Your own graphs". Although I am a total JS n00b, I managed to take all the steps (with a tiny test graph) up until the stuff that's under "Data format". There, you write:

Update the config.js in this repository to point to your data server, and you are ready to explore your own graph.

My problem is that I simply do not know how to setup my own data server. I mean, I have all the necessary files (labels.json, links.bin, meta.json, positions.bin) but I don't know where to put them to get my own data server. Hence, I do not know where I have to point config.js to.

Could you help me with that?

Thanks a lot,
Sascha

Recommend Projects

  • React photo React

    A declarative, efficient, and flexible JavaScript library for building user interfaces.

  • Vue.js photo Vue.js

    🖖 Vue.js is a progressive, incrementally-adoptable JavaScript framework for building UI on the web.

  • Typescript photo Typescript

    TypeScript is a superset of JavaScript that compiles to clean JavaScript output.

  • TensorFlow photo TensorFlow

    An Open Source Machine Learning Framework for Everyone

  • Django photo Django

    The Web framework for perfectionists with deadlines.

  • D3 photo D3

    Bring data to life with SVG, Canvas and HTML. 📊📈🎉

Recommend Topics

  • javascript

    JavaScript (JS) is a lightweight interpreted programming language with first-class functions.

  • web

    Some thing interesting about web. New door for the world.

  • server

    A server is a program made to process requests and deliver data to clients.

  • Machine learning

    Machine learning is a way of modeling and interpreting data that allows a piece of software to respond intelligently.

  • Game

    Some thing interesting about game, make everyone happy.

Recommend Org

  • Facebook photo Facebook

    We are working to build community through open source technology. NB: members must have two-factor auth.

  • Microsoft photo Microsoft

    Open source projects and samples from Microsoft.

  • Google photo Google

    Google ❤️ Open Source for everyone.

  • D3 photo D3

    Data-Driven Documents codes.