GithubHelp home page GithubHelp logo

bcgov / opho-cdr-shiny Goto Github PK

View Code? Open in Web Editor NEW
3.0 7.0 3.0 31.12 MB

Working space for a Shiny Dashboard displaying Chronic Disease Registry data, in collaboration with a UBC MDS Capstone project team (May - June 2022)

License: Apache License 2.0

R 100.00%
hlth

opho-cdr-shiny's Introduction

BC Chronic Disease Dashboard

Lifecycle:Dormant

The BC Chronic Disease Registry (CDR) is a data product that captures information about the rate of new and persistent cases of chronic diseases across the province. Age-standardized rates of disease are studied for different regions, including HAs (Health Authorities) and CHSAs (Community Health Service Areas), as well as for demographic variables such as sex.

In this project we aim to create an interactive dashboard that will allow users of all technical expertise to explore and visualize spatial and temporal information of the disease rates in the data, and to develop an analysis pipeline that will describe the temporal trends in the data.

Usage

Our data product is currently available for internal use only. Please contact the CDR Working Group to request access to the data. To re-run the analysis and run the dashboard, please ensure that R (version 4.2.0) and RStudio are installed, then follow the respective instructions below.

Modelling

  1. Clone this Github repository.
  2. Create a folder named “data” in the root directory of the repository. Download and save the “Data_T_CHSA” inside this “data” folder.
  3. Open the opho-cdr-shiny.Rproject file in RStudio. Run the following command in the R console to install the package dependencies or manually as listed below: renv::restore()
  4. Run the following command using the command line/terminal from the root directory of the project: make all
  5. To view the temporal model visualizations in a Shiny document, check that results have been output to “results/model”. Run the following command in the R console: rmarkdown::run('src/model/02_visualize.Rmd')
  6. To view the Joinpoint Regression results, check that results have been output to “results/model”. To veiw the method paper, run the following command in the R console: rmarkdown::run('src/joinpoint/joinpoint_method.rmd')

Dashboard

  1. Clone this Github repository
  2. Create a data/ directory within the src/dashboard/ director, and save the original and modeled data inside in folders named “raw” and “model” respectively. The data inside the raw folder should be saved from the “Data_MFT_HA_CHSA” dataset, and the data inside the model folder should be saved from running the Models (Both Temporal and Joinpoint Regression) above. The folder structure should look as follows:
.
├── ...
├── src                                  
│   ├── dashboard                         
|   │   ├── data                              
|   │   |   ├── model                         # Modeled Data from Modelling
|   │   |   |   ├── HSCPrevalence  
|   │   |   |   |   ├── AMI_EPI.csv 
|   │   |   |   |   ├── ASTHMA_EPI.csv 
|   │   |   |   |   └── ...
|   │   |   |   ├── IncidenceRate 
|   │   |   |   |   ├── ALZHEIMER_DEMENTIA.csv 
|   │   |   |   |   ├── AMI.csv 
|   │   |   |   |   └── ...
|   │   |   |   └── LifePrevalence 
|   │   |   |   |   ├── ALZHEIMER_DEMENTIA.csv 
|   │   |   |   |   ├── AMI.csv 
|   │   |   |   |   └── ...
|   │   |   |   └── joinpoint_for_shiny_df.fst
|   │   |   |   └── joinpoint_results.csv
|   │   |   └── raw                            # Original Data from "Data_MFT_HA_CHSA'
|   │   |       ├── HSCPrevalence 
|   │   |       |   ├── AMI_EPI.csv 
|   │   |       |   ├── ASTHMA_EPI.csv 
|   │   |       |   └── ...
|   │   |       ├── IncidenceRate 
|   │   |       |   ├── ALZHEIMER_DEMENTIA.csv 
|   │   |       |   ├── AMI.csv 
|   │   |       |   └── ...
|   │   |       └── LifePrevalence 
|   │   |           ├── ALZHEIMER_DEMENTIA.csv 
|   │   |           ├── AMI.csv 
|   │   |           └── ... 
│   |   └── ...  
│   └──  ...                                 
└── ...
  1. Run the following command using the command line/terminal from the root directory of the project:
shiny::runApp('src/dashboard')

Dependencies

  • R version 4.2.0 and R packages:

    • here=1.0.1
    • tidyverse=1.3.1
    • ggplot2=3.3.6
    • R-INLA=22.05.07
    • docopt=0.7.1
    • shiny=1.7.1
    • shinyjs=2.1.0
    • plyr=1.8.7
    • leaflet=2.1.1
    • sp=1.4-7
    • rgdal=1.5-32
    • plotly=4.10.0
    • scales=1.2.0
    • shinycssloaders=1.0.0
    • rgeos=0.5-9
    • shinyWidgets=0.7.0
    • DT=0.23
    • shinyBS=0.61.1
    • fANCOVA=0.6-1
    • segmented=1.6-0
    • broom=0.8.0
    • modelr=0.1.8
    • purrr=0.3.4
    • fst=0.9.8
  • GNU make 3.81

Project Status

Getting Help or Reporting an Issue

To report bugs/issues/feature requests, please file an issue.

How to Contribute

If you would like to contribute, please see our CONTRIBUTING guidelines.

Please note that this project is released with a Contributor Code of Conduct. By participating in this project you agree to abide by its terms.

License

Copyright 2022 Province of British Columbia

Licensed under the Apache License, Version 2.0 (the "License");
you may not use this file except in compliance with the License.
You may obtain a copy of the License at

http://www.apache.org/licenses/LICENSE-2.0

Unless required by applicable law or agreed to in writing, software distributed under the License is distributed on an "AS IS" BASIS,
WITHOUT WARRANTIES OR CONDITIONS OF ANY KIND, either express or implied.
See the License for the specific language governing permissions and limitations under the License.

This project was created using the bcgovr package.

opho-cdr-shiny's People

Contributors

chendaniely avatar henry-ngo avatar jennifer-hoang avatar jessie14 avatar kaylamclean avatar mahm00d27 avatar repo-mountie[bot] avatar shyan0903 avatar

Stargazers

 avatar  avatar  avatar

Watchers

 avatar  avatar  avatar  avatar  avatar  avatar  avatar

opho-cdr-shiny's Issues

Meeting Agenda for 2022-05-27

Agenda Items:

  • Decision to include dropped columns in data extraction option of the dashboard
  • Discuss challenges and progress of dashboard architecture.
  • Discuss revision of the temporal model to address the prior distribution.

Modeling Questions:

  • The current model uses a gamma distribution for the response variable, but rare diseases with zero-values can't be modelled. Are there any recommended approaches to overcome this, such as zero-inflated or hurdle models?
  • The selected model sometimes predicts a constant rate over time (horizontal line) - is this reasonable for chronic diseases?
  • Both a RW1/RW2 model is fit on each CHSA/disease/rate type, then the best model is selected. Is this approach okay, or is it preferable to fit only one model per disease?
  • Are there any guidelines/recommended tools for analysis reproducibility (e.g. Docker, Makefile)?

Action Items:

Dashboard :

  • Drop rows with the NA values in the data extraction tab
  • Drop rows with values less than 5 (First Nations) in the data extraction tab
  • Keep Numerator and Denominator column in the data extraction tab
  • Info page: List the names. of the conditions (Fernanda shared in MS teams thread), and include a link to the document with description of all the conditions. STRETCH GOAL : Try displaying the pdf within the dashboard (In a placeholder window), so that the user stays in the dashboard while viewing the pdf
  • Allow one SIGNIFICANT digit after decimal
  • Add CI in hovers, and add error bars in bar chart
  • Change to representative color for regions (Henry shared in MS Teams thread)
  • Instead of ranging from 3 to infinity, use "Greater than 3" (instead of infinity)
  • Add denominators rates in the legend as such as "per 1000 population"
  • Start all scales from Zero. STRETCH GOAL : Figure out a way to include both options of starting from Zero , or otherwise
  • Rename Gender to Sex. Drop underscores and include spaces
  • Drop "Data Dictionary Tab". Add data description. Include definitions such as "Age-Std pop" and also brief info on CI.
  • OPHO team to come up with statement regarding permission and scope of data usage, reproducibility, and contacts

Modeling

  • Explore Zero-inflated poisson distribution for Bayesian temporal model

Meeting Agenda for 2022-06-17

Agenda Items:

Dashboard Questions:

  • Review the latest version of the dashboard
  • By region tab: text boxes summary
    header: Top 4 highest age life prevalence in faser health: first highest rate: second highest rate:
    leave space width same as the left side

Modeling Questions:

  • LOESS model: can we adjust negative estimates to zero?
    • Leave fitted model values as is, and make a note of this issue
    • Future steps: Try fitting values in log space to force positive values

Action Items:

  • Presentation for OPHO: June 22, 1pm

Final Project Report Comments

  • for formal technical writing, do not use conjunctions
    • First sentence intro: "so it's important..." -> "so it is important"
  • executive summary has BCCDR, the intro has BC CDR, I would make the spacing consistent
  • i would list and then define the terms. to make the sentence flow better
    • The BC CDR Captures 3 different types... into our dashboard: incidence rate, lifetime prevalence, and active healthcare contact prevalence. The indigence rate is....
  • use "three" instead of "3" for formal writing
  • use "five" instead of "5" for formal writing (things less than 10? i think is the rule?)

  • swap the ordering for sections 2.1 and 2.2 so the dashboard is first. then modeling after. mainly because temporal modelining references a dashboard before you talk about the dashboard. same probably applies for DS Techniques section

  • joinpoint regression "Time in years" why is the "T" capitalized? I don't think you need that?
  • second time you mention "Time in years" can just be "time"
  • why is there no reference to figure 1 in the text? since it's not referenced in the results you should remove it.

  • is it possible for figure 2 to be created without the annotations but just saved out from the code?
    • Then reference the image from the code-generated output?
    • You can talk about the points, grey bands and blue bands in the text/caption
    • use a reproducible image
    • You can do the same with Figure 1 (if you choose to keep it + write about it) if you put the 2 images into a single image, or use latex subfigures, you don't necessarily need the arrows and breakpoint annotation unless you want to code up a +geom_anotation() bit to save out.

  • section 4 is a stacked heading

  • Your conclusion a bunch of separate paragraphs that are only 1 sentence long. Can you make those into proper paragraphs? instead of bullet points-esque statments
    • this also kind of shows up in your source document as the only section that isn't following the rest of the document's line breaks, so it's very different in the source + rendered document.

Meeting Agenda for 2022-06-03

Agenda Items:

  • Aim to finalize product in next 2 weeks
  • Discuss how to integrate modelled data into dashboard
    • As a separate tab or toggle switches in existing tabs ?

Dashboard Questions:

  • How many decimals should we round confidence intervals to? (Some intervals are small and will round to the rate itself)
  • Should we use existing CI data (not modelled data) for error bars / confidence intervals?
  • Data dictionary variables different from table column names

Modeling Questions:

  • Follow-up: With the current gamma model, 84% of incidence rate data, 91% of HSC prevalence rate data, and 98% of life prevalence rate data were able to be modelled.
  • Tweedie distribution can accommodate 0 values for rare diseases but INLA implementation is experimental. Would it still be useful to generate these models?

Action Items:

  • Reminder : next week's meeting moved to Thursday June 9, 11am

Update README file contents and generation

The current README file is the default generated for BC Gov R Projects. It was created using bcgovr

There are actually two README files right now. The default is README.md which can be modified and used. There is also a README.Rmd. It is possible to include a step to render README.md from README.Rmd with each commit or as needed etc. This could be set up as a GitHub Action, I think. More info: https://usethis.r-lib.org/reference/use_readme_rmd.html

It's up to the UBC MDS team to decide if they prefer to work with the README in regular .md format or if they prefer the R-integration of .Rmd. Perhaps one will prove to be more useful as the project grows.

In addition, leaving the "usage", "example", and "project status" sections for the UBC MDS team to fill in as the project progresses. Feel free to add more sections if needed in this part of the README. Please leave the How to Contribute and License sections unchanged please.

Add project lifecycle badge

No Project Lifecycle Badge found in your readme!

Hello! I scanned your readme and could not find a project lifecycle badge. A project lifecycle badge will provide contributors to your project as well as other stakeholders (platform services, executive) insight into the lifecycle of your repository.

What is a Project Lifecycle Badge?

It is a simple image that neatly describes your project's stage in its lifecycle. More information can be found in the project lifecycle badges documentation.

What do I need to do?

I suggest you make a PR into your README.md and add a project lifecycle badge near the top where it is easy for your users to pick it up :). Once it is merged feel free to close this issue. I will not open up a new one :)

Capstone Week 1 Tasks

  • Generate a teamwork contract to facilitate effective collaboration
  • Setup a remote repository, and use it to assign and track work
  • Understand your partner’s question and how the data project can answer it;
    • Spatial Temporal Analysis: Clarify question to be answered
  • Understand your data (i.e., what are the rows and columns, what are the images, etc.);
  • Determine the data you will need to create for your model - draw a picture!;
    • Create visual for presentation?
  • Come up with 1-2 modeling strategies that you will try as a first approach (think simple here);
    • Clarify approach for Spatial Temporal Analysis
  • Plan your dashboard prototype - draw a picture!;
  • Split your data into train and test sets reproducibly, and write these sets to separate files;
    • Revisit this for modelling team
  • Perform exploratory data analysis to get to know your data;
  • Fit your first model (note - this will not be possible for all groups!)

Proposal Sections:

  • Executive Summary
  • Introduction
  • Data Science Techniques
  • Timeline

Upcoming Deadlines:

  • Proposal Presentation by Friday May 6 1:30pm
  • Proposal Draft by Tuesday, May 10 6pm
  • Proposal Final by Friday, May 13 6pm

It's Been a While Since This Repository has Been Updated

This issue is a kind reminder that your repository has been inactive for 362 days. Some repositories are maintained in accordance with business requirements that infrequently change thus appearing inactive, and some repositories are inactive because they are unmaintained.

To help differentiate products that are unmaintained from products that do not require frequent maintenance, repomountie will open an issue whenever a repository has not been updated in 180 days.

  • If this product is being actively maintained, please close this issue.
  • If this repository isn't being actively maintained anymore, please archive this repository. Also, for bonus points, please add a dormant or retired life cycle badge.

Thank you for your help ensuring effective governance of our open-source ecosystem!

Lets use common phrasing

TL;DR 🏎️

Teams are encouraged to favour modern inclusive phrasing both in their communication as well as in any source checked into their repositories. You'll find a table at the end of this text with preferred phrasing to socialize with your team.

Words Matter

We're aligning our development community to favour inclusive phrasing for common technical expressions. There is a table below that outlines the phrases that are being retired along with the preferred alternatives.

During your team scrum, technical meetings, documentation, the code you write, etc. use the inclusive phrasing from the table below. That's it - it really is that easy.

For the curious mind, the Public Service Agency (PSA) has published a guide describing how Words Matter in our daily communication. Its an insightful read and a good reminder to be curious and open minded.

What about the master branch?

The word "master" is not inherently bad or non-inclusive. For example people get a masters degree; become a master of their craft; or master a skill. It's generally when the word "master" is used along side the word "slave" that it becomes non-inclusive.

Some teams choose to use the word main for the default branch of a repo as opposed to the more commonly used master branch. While it's not required or recommended, your team is empowered to do what works for them. If you do rename the master branch consider using main so that we have consistency among the repos within our organization.

Preferred Phrasing

Non-Inclusive Inclusive
Whitelist => Allowlist
Blacklist => Denylist
Master / Slave => Leader / Follower; Primary / Standby; etc
Grandfathered => Legacy status
Sanity check => Quick check; Confidence check; etc
Dummy value => Placeholder value; Sample value; etc

Pro Tip 🤓

This list is not comprehensive. If you're aware of other outdated nomenclature please create an issue (PR preferred) with your suggestion.

Meeting Agenda for 2022-05-18

Agenda Items:

  • Proposal Feedback (10 min)
  • Dashboard Discussion (25 min)
  • Modeling Discussion (25 min)
    • EDA with LOESS baseline model (Jenn)

Dashboard Questions:

  • Feedback on current layout and features
    • leave out the unknown regions from filters
    • keep the map legend the same scale
  • Are the plots we have included useful?

Modeling Questions:

  • Does it make sense to average standardized rates and confidence intervals if we are aggregating multiple regions?
  • Loess baseline model:
    • Loess is a flexible model that captures trends well, but disadvantages include that CIs for the rates occasionally extend below 0 with rare diseases. The CIs are approximated using the t-distribution. Is this an acceptable trade-off?

Action Items:

  • Use word documents rather than pdf files for easier edits
  • Decide the preferred format for the final report
  • Always mention BC Chronic Disease Registry and clarify it is a derived data product
  • Confirm the preferred color scheme
  • Change gender to sex
  • Change disease names to full name with acronyms in brackets
  • Confirm what's should be shown on the data download page: keep geography column,
  • TBD: Kayla visiting for our final presentation on June 16th; we presenting virtually/in-person if funding is available to the ophp team on the last Wednesday of June.

It's Been a While Since This Repository has Been Updated

This issue is a kind reminder that your repository has been inactive for 181 days. Some repositories are maintained in accordance with business requirements that infrequently change thus appearing inactive, and some repositories are inactive because they are unmaintained.

To help differentiate products that are unmaintained from products that do not require frequent maintenance, repomountie will open an issue whenever a repository has not been updated in 180 days.

  • If this product is being actively maintained, please close this issue.
  • If this repository isn't being actively maintained anymore, please archive this repository. Also, for bonus points, please add a dormant or retired life cycle badge.

Thank you for your help ensuring effective governance of our open-source ecosystem!

Speed up the shiny app

Now that most of the functionalities have been implemented for the final data product: the BC Chronic Disease Dashboard hosted on Shiny, we have noticed unreasonably slow performance issue. Specifically, when one or multiple filters change, the charts can take a long time to be drawn and sometimes even lead the app to freeze. This issue documents the methods Jessie and I have tried to speed up the app.

Meeting Agenda for 2022-05-06

Agenda Items:

  • Proposal slides (15 min)
    • Dashboard Design (Jessie/Irene)
    • Spatial-temporal Modeling Techniques (Mahmood/Jennifer)
    • Timeline (Mahmood)
  • Dashboard Discussion (20 min)
  • Modeling Discussion (20 min)
  • Housekeeping: Alternative meeting time for next week (since Kayla is away)

Dashboard Questions:

  • Is the current proposed design appropriate for the end users?
    • A: Yes. Would be useful to add data table and data download features
  • Who are the end users for dashboard (level of technical expertise) ?
    • A: Public audience, health professionals
  • Region levels: In addition to CHSA, which region levels might be most useful on the dashboard? (Health authority, HSDA, LHA?)
    • A: Work with most and least granular levels
    • Kayla can provide HA level to avoid problems with suppressed data at the CHSA level

Modeling Questions:

  • We are considering a Bayesian spatio-temporal model for standardized incidence ratios (SIRs) - would this be a useful metric to look at?
  • How to address missing (suppressed) data?
    • A: Not an issue if we use temporal smoothing models
  • When can the gender data be expected?
    • A: Approximately May 18th (Week 3)

Action Items:

  • Identify appropriate temporal models and send relevant papers to OPHO team (Mahmood/Jennifer)
  • Data for HA level and gender from Kayla
  • Confirm next meeting date: Wednesday May 18, 11-12pm

Meeting Agenda for 2022-06-09

Agenda Items:

  • Feedback on Dashboard/Model Integration, Info Tab
  • Jointpoint regression analysis (Mahmood)
  • INLA model - Gamma model with modified zeroes
  • Capstone presentation next week, will share slides with opho

Dashboard Questions:

  • How consistent does the Region Tab need to be compared to Disease Tab? (linked highlights, hover behaviour, etc)
  • Final review of dashboard features / functions

Modeling Questions:

  • After modifying zeroes to 0.0001, the RW2 model gives very wide credible interval bands but RW1 model appears to be an improvement over the original 95% confidence intervals. Should we incorporate this into the model?

Action Items:

  • Presentation: show data from HAs and larger CHSAs preferably
  • Model: Explore RW1 hyper-parameters (might be overfitting in some cases), otherwise use loess for data with zeroes (adjust smoothing parameter)
  • By Region:
    • Top 4 Diseases by Age Standardized Prevalence, Most Recent Year (2020) - add a column on the side
  • Deadline to wrap up data product: June 22

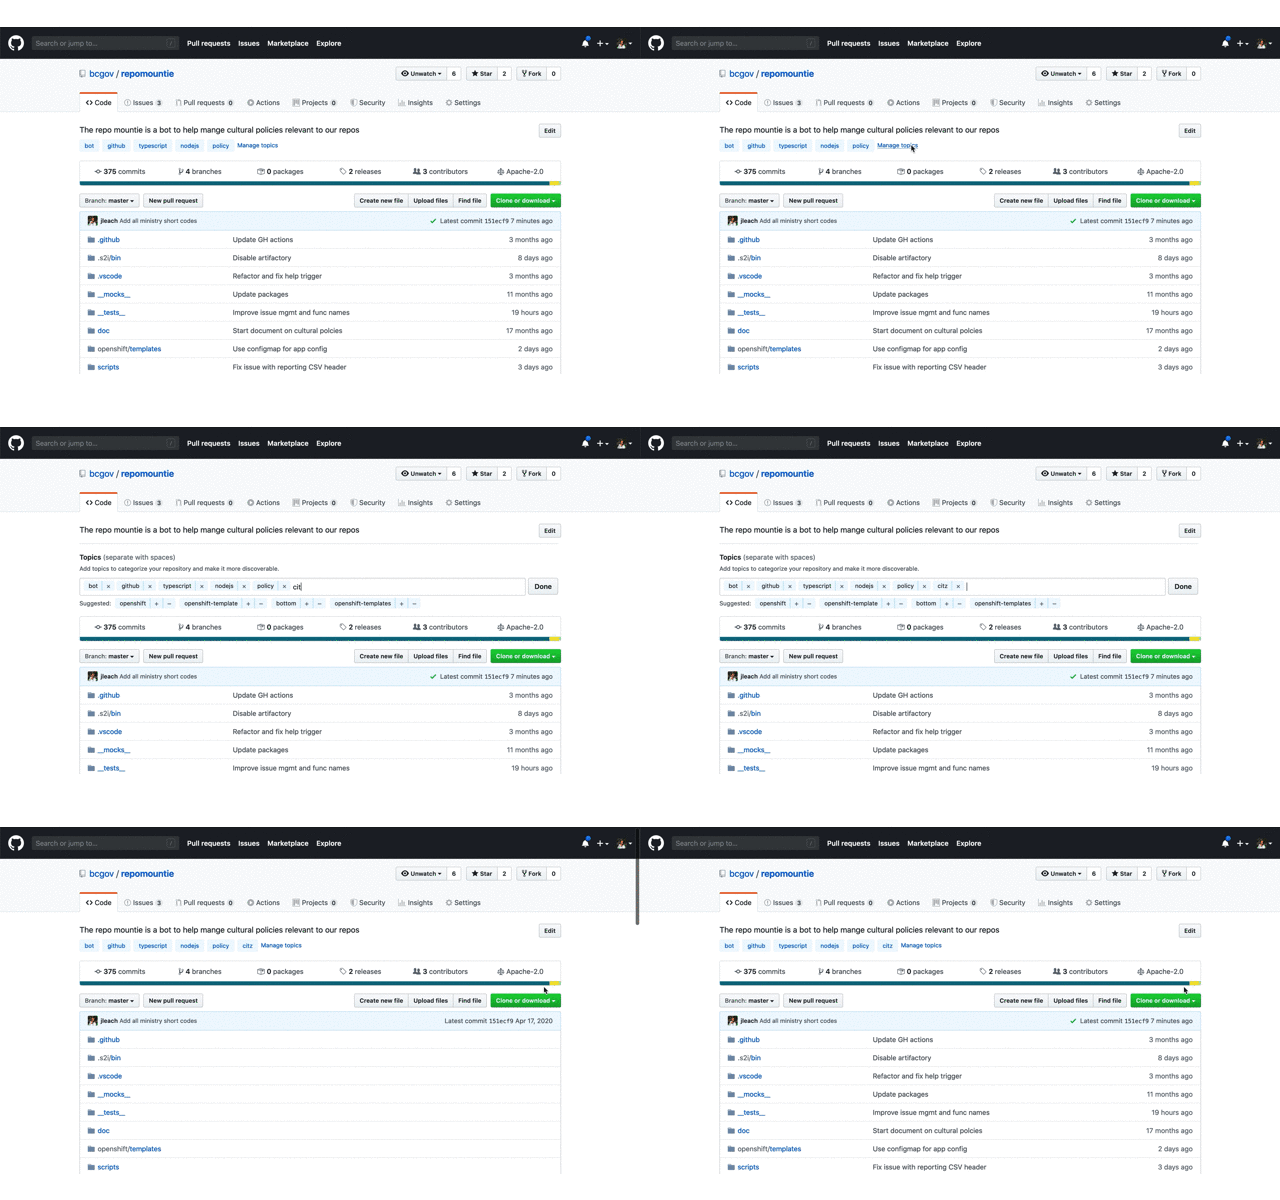
Add missing topics

TL;DR

Topics greatly improve the discoverability of repos; please add the short code from the table below to the topics of your repo so that ministries can use GitHub's search to find out what repos belong to them and other visitors can find useful content (and reuse it!).

Why Topic

In short order we'll add our 800th repo. This large number clearly demonstrates the success of using GitHub and our Open Source initiative. This huge success means it's critical that we work to make our content as discoverable as possible. Through discoverability, we promote code reuse across a large decentralized organization like the Government of British Columbia as well as allow ministries to find the repos they own.

What to do

Below is a table of abbreviation a.k.a short codes for each ministry; they're the ones used in all @gov.bc.ca email addresses. Please add the short codes of the ministry or organization that "owns" this repo as a topic.

add a topic

That's it, you're done!!!

How to use

Once topics are added, you can use them in GitHub's search. For example, enter something like org:bcgov topic:citz to find all the repos that belong to Citizens' Services. You can refine this search by adding key words specific to a subject you're interested in. To learn more about searching through repos check out GitHub's doc on searching.

Pro Tip 🤓

  • If your org is not in the list below, or the table contains errors, please create an issue here.

  • While you're doing this, add additional topics that would help someone searching for "something". These can be the language used javascript or R; something like opendata or data for data only repos; or any other key words that are useful.

  • Add a meaningful description to your repo. This is hugely valuable to people looking through our repositories.

  • If your application is live, add the production URL.

Ministry Short Codes

Short Code Organization Name
AEST Advanced Education, Skills & Training
AGRI Agriculture
ALC Agriculture Land Commission
AG Attorney General
MCF Children & Family Development
CITZ Citizens' Services
DBC Destination BC
EMBC Emergency Management BC
EAO Environmental Assessment Office
EDUC Education
EMPR Energy, Mines & Petroleum Resources
ENV Environment & Climate Change Strategy
FIN Finance
FLNR Forests, Lands, Natural Resource Operations & Rural Development
HLTH Health
IRR Indigenous Relations & Reconciliation
JEDC Jobs, Economic Development & Competitiveness
LBR Labour Policy & Legislation
LDB BC Liquor Distribution Branch
MMHA Mental Health & Addictions
MAH Municipal Affairs & Housing
BCPC Pension Corporation
PSA Public Service Agency
PSSG Public Safety and Solicitor General
SDPR Social Development & Poverty Reduction
TCA Tourism, Arts & Culture
TRAN Transportation & Infrastructure

NOTE See an error or omission? Please create an issue here to get it remedied.

Recommend Projects

  • React photo React

    A declarative, efficient, and flexible JavaScript library for building user interfaces.

  • Vue.js photo Vue.js

    🖖 Vue.js is a progressive, incrementally-adoptable JavaScript framework for building UI on the web.

  • Typescript photo Typescript

    TypeScript is a superset of JavaScript that compiles to clean JavaScript output.

  • TensorFlow photo TensorFlow

    An Open Source Machine Learning Framework for Everyone

  • Django photo Django

    The Web framework for perfectionists with deadlines.

  • D3 photo D3

    Bring data to life with SVG, Canvas and HTML. 📊📈🎉

Recommend Topics

  • javascript

    JavaScript (JS) is a lightweight interpreted programming language with first-class functions.

  • web

    Some thing interesting about web. New door for the world.

  • server

    A server is a program made to process requests and deliver data to clients.

  • Machine learning

    Machine learning is a way of modeling and interpreting data that allows a piece of software to respond intelligently.

  • Game

    Some thing interesting about game, make everyone happy.

Recommend Org

  • Facebook photo Facebook

    We are working to build community through open source technology. NB: members must have two-factor auth.

  • Microsoft photo Microsoft

    Open source projects and samples from Microsoft.

  • Google photo Google

    Google ❤️ Open Source for everyone.

  • D3 photo D3

    Data-Driven Documents codes.