GithubHelp home page GithubHelp logo

clavellab / maldipickr Goto Github PK

View Code? Open in Web Editor NEW
2.0 1.0 0.0 7.54 MB

Dereplicate And Cherry-pick Mass Spectrometry Spectra

Home Page: https://clavellab.github.io/maldipickr/

License: GNU General Public License v3.0

R 98.55% Dockerfile 0.78% CSS 0.58% SCSS 0.09%
dereplication maldi-tof-ms cherry-pick r r-packages rstats

maldipickr's Introduction

maldipickr maldipickr website

CRAN status Project Status: Active – The project has reached a stable, usable state and is being actively developed. R-CMD-check codecov

  • You are using the MALDI-TOF1 Biotyper to identify bacterial isolates
  • You want to select representative isolates for further experiments
  • You need fast and automated selection decisions that you can retrace

{maldipickr} provides documented and tested R functions that will help you dereplicate MALDI-TOF data and cherry-pick representative spectra of microbial isolates.

Graphical overview

Thumbnail of maldipickr graphical overview

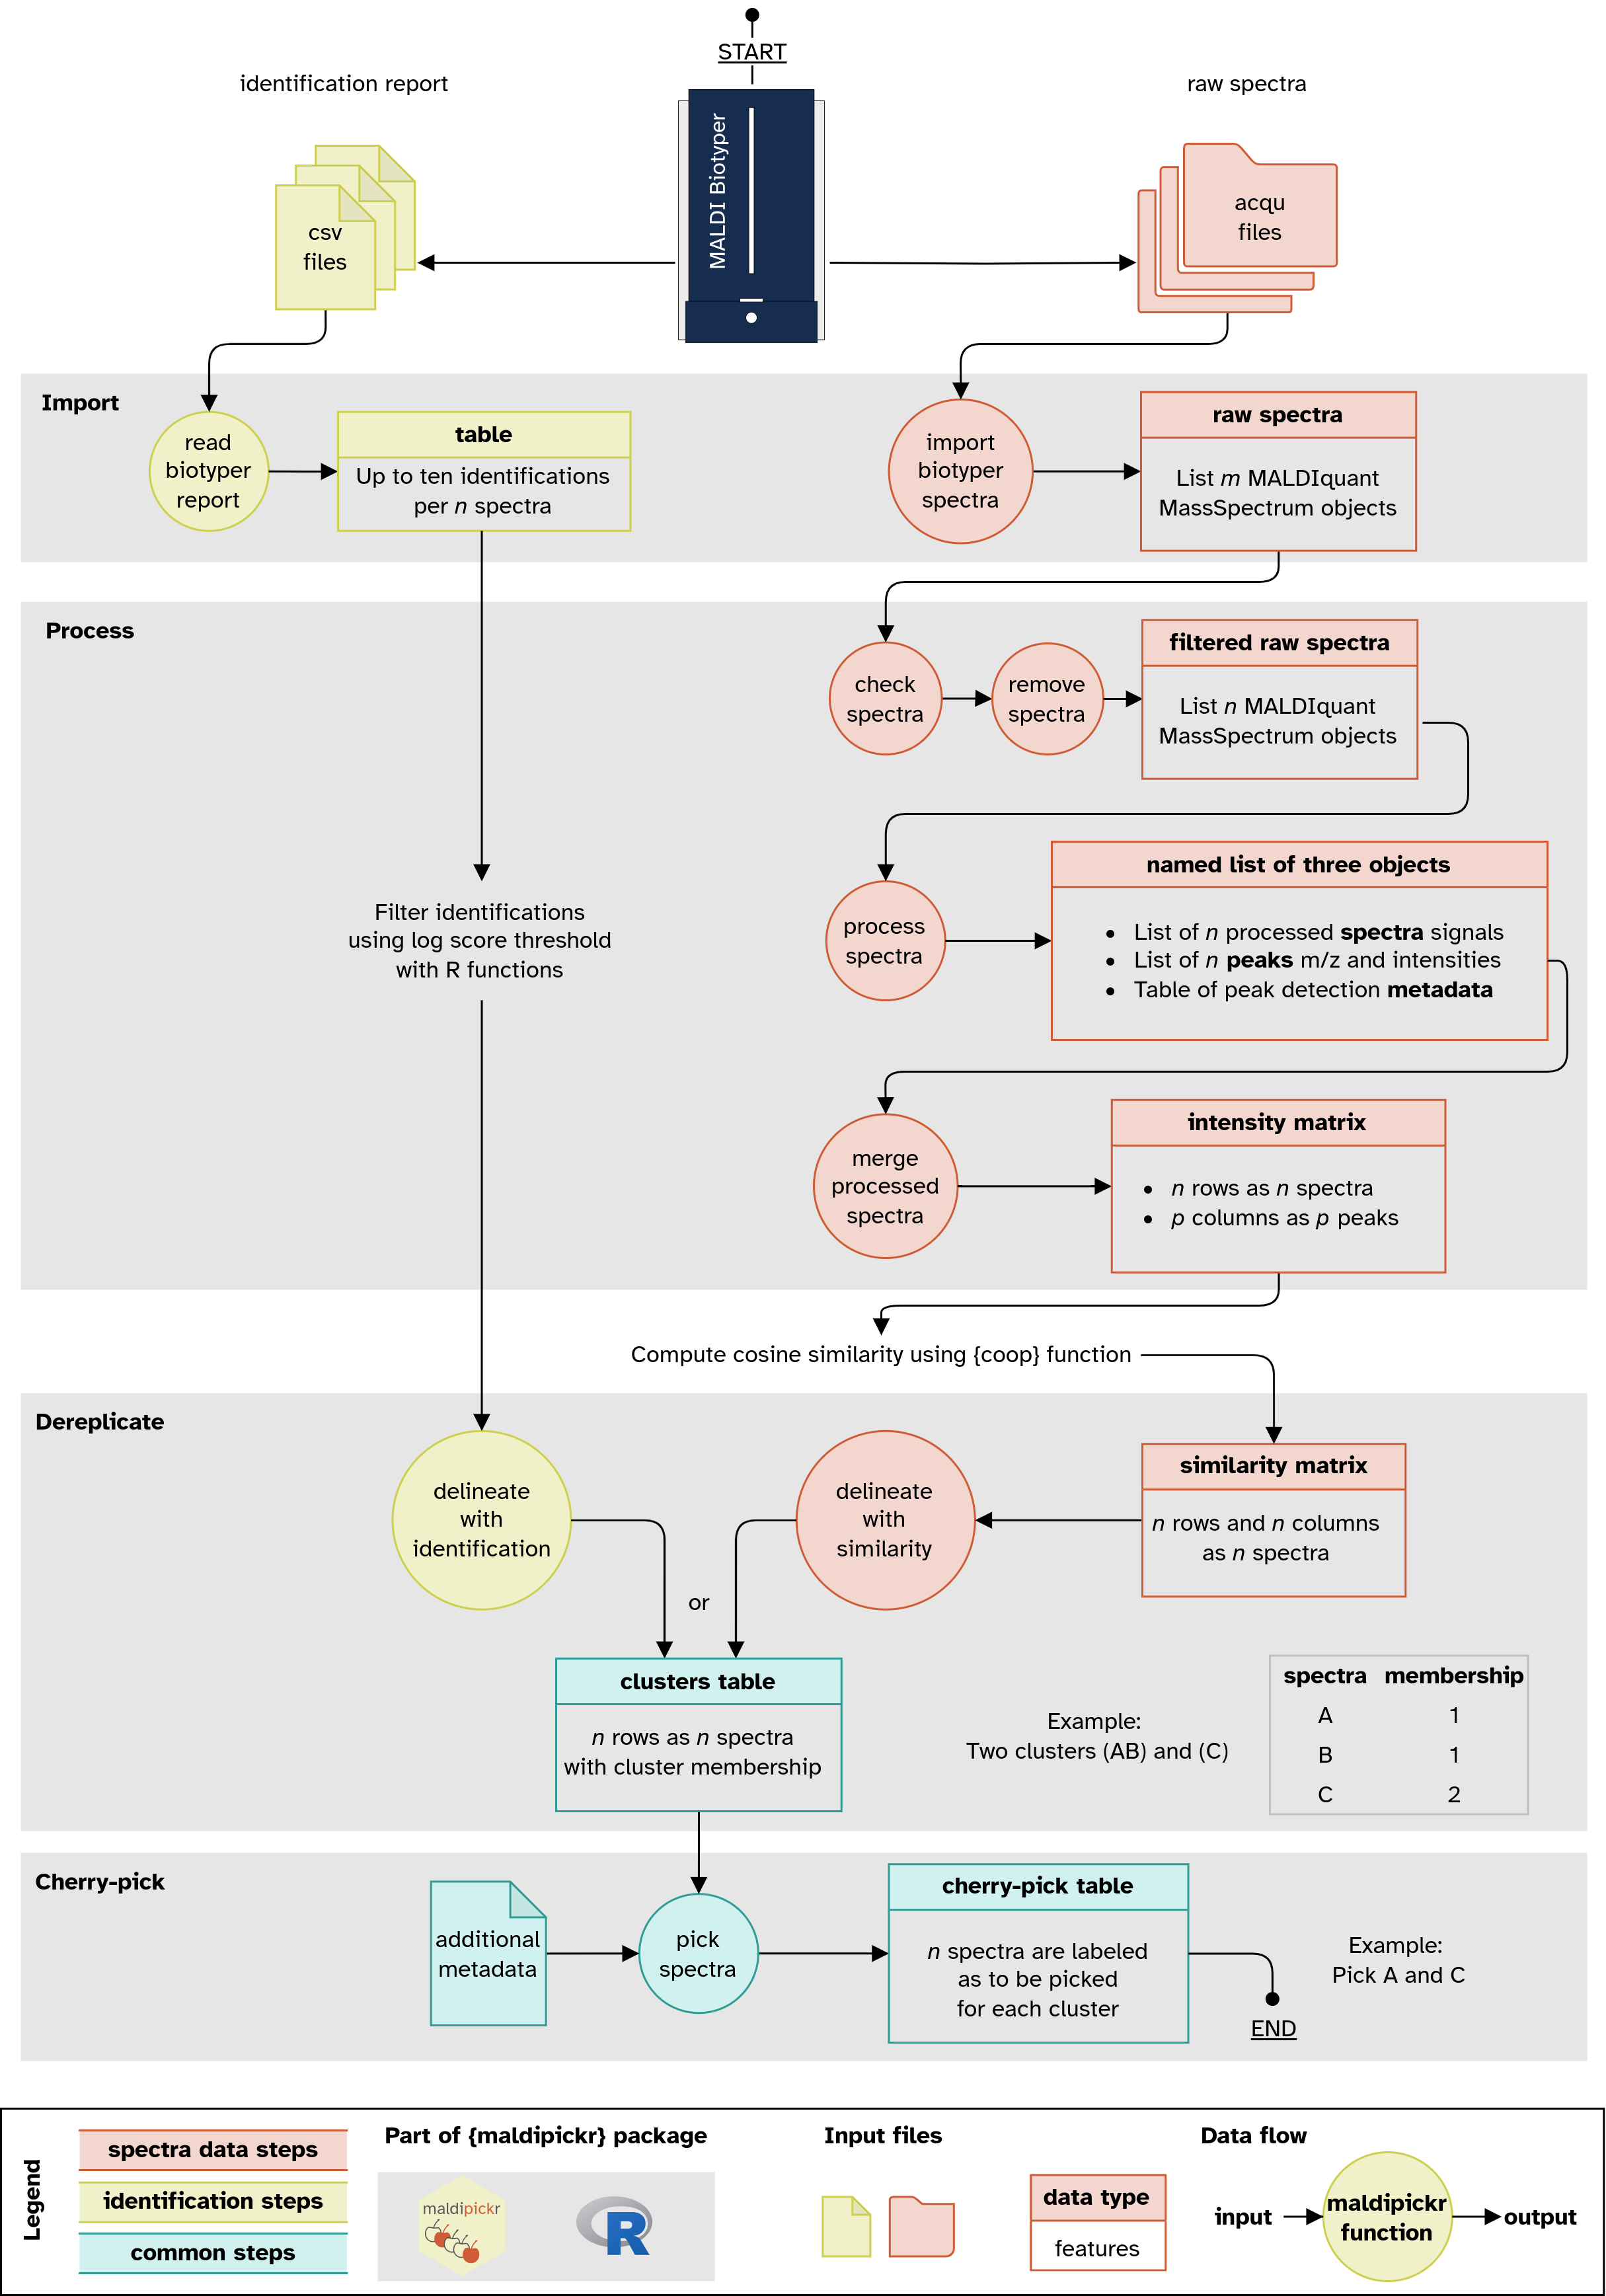
Illustration (click for a bigger version) of the data flow when using {maldipickr} to cherry-pick bacterial isolates with MALDI Biotyper. It depicts the two possible approaches using either taxonomic identification reports (left) or spectra data (right).

Quickstart

How to cherry-pick bacterial isolates with MALDI Biotyper:

Using taxonomic identification report

library(maldipickr)
# Import Biotyper CSV report
#  and glimpse at the table
report_tbl <- read_biotyper_report(
  system.file("biotyper_unknown.csv", package = "maldipickr")
)
report_tbl %>%
  dplyr::select(name, bruker_species, bruker_log)
#> # A tibble: 4 × 3
#>   name              bruker_species               bruker_log
#>   <chr>             <chr>                             <dbl>
#> 1 unknown_isolate_1 not reliable identification        1.33
#> 2 unknown_isolate_2 not reliable identification        1.4 
#> 3 unknown_isolate_3 Faecalibacterium prausnitzii       1.96
#> 4 unknown_isolate_4 Faecalibacterium prausnitzii       2.07


# Delineate clusters from the identifications after filtering the reliable ones
#   and cherry-pick one representative spectra.
#   The chosen ones are indicated by `to_pick` column
report_tbl <- report_tbl %>%
  dplyr::mutate(
      bruker_species = dplyr::if_else(bruker_log >= 2, bruker_species,
                                      "not reliable identification")
  )
report_tbl %>%
  delineate_with_identification() %>%
  pick_spectra(report_tbl, criteria_column = "bruker_log") %>%
  dplyr::relocate(name, to_pick, bruker_species)
#> Generating clusters from single report
#> # A tibble: 4 × 11
#>   name       to_pick bruker_species membership cluster_size sample_name hit_rank
#>   <chr>      <lgl>   <chr>               <int>        <int> <chr>          <int>
#> 1 unknown_i… TRUE    not reliable …          2            1 <NA>               1
#> 2 unknown_i… TRUE    not reliable …          3            1 <NA>               1
#> 3 unknown_i… TRUE    not reliable …          4            1 <NA>               1
#> 4 unknown_i… TRUE    Faecalibacter…          1            1 <NA>               1
#> # ℹ 4 more variables: bruker_quality <chr>, bruker_taxid <dbl>,
#> #   bruker_hash <chr>, bruker_log <dbl>

Using spectra data

library(maldipickr)
# Set up the directory location of your spectra data
spectra_dir <- system.file("toy-species-spectra", package = "maldipickr")

# Import and process the spectra
processed <- spectra_dir %>%
  import_biotyper_spectra() %>%
  process_spectra()

# Delineate spectra clusters using Cosine similarity
#  and cherry-pick one representative spectra.
#  The chosen ones are indicated by `to_pick` column
processed %>%
  list() %>%
  merge_processed_spectra() %>%
  coop::tcosine() %>%
  delineate_with_similarity(threshold = 0.92) %>%
  set_reference_spectra(processed$metadata) %>%
  pick_spectra() %>%
  dplyr::relocate(name, to_pick)
#> # A tibble: 6 × 7
#>   name         to_pick membership cluster_size   SNR peaks is_reference
#>   <chr>        <lgl>        <int>        <int> <dbl> <int> <lgl>       
#> 1 species1_G2  FALSE            1            4  5.09    21 FALSE       
#> 2 species2_E11 FALSE            2            2  5.54    22 FALSE       
#> 3 species2_E12 TRUE             2            2  5.63    23 TRUE        
#> 4 species3_F7  FALSE            1            4  4.89    26 FALSE       
#> 5 species3_F8  TRUE             1            4  5.56    25 TRUE        
#> 6 species3_F9  FALSE            1            4  5.40    25 FALSE

Installation

{maldipickr} is available on the CRAN and on GitHub.

To install the latest CRAN release, use the following command in R:

install.packages("maldipickr")

To install the development version, use the following command in R:

remotes::install_github("ClavelLab/maldipickr", build_vignettes = TRUE)

Usage

The comprehensive vignettes will walk you through the package functions and showcase how to:

  1. Import spectra data and identification reports from Bruker MALDI Biotyper into R.
  2. Process, dereplicate and cherry-pick representative spectra, from simple to complex design.

Troubleshoot

If something unexpected happened when using this package, please first search the current open or closed issues to look for similar problems. If you are the first, you are more than welcome to open a new issue using the “Bug report” template with a minimal reprex.

Contribute

All contributions are welcome and the CONTRIBUTING.md documents how to participate.

Please note that the {maldipickr} package is released with a Contributor Code of Conduct. By contributing to this project, you agree to abide by its terms.

Credits

Acknowledgements

This R package is developed for spectra data generated by the Bruker MALDI Biotyper device. The {maldipickr} package is built from a suite of Rmarkdown files using the {fusen} package by Rochette S (2023). It relies on:

  1. the {MALDIquant} package from Gibb & Strimmer (2012) for spectra functions
  2. the work of Strejcek et al. (2018) for the dereplication procedure.

Disclaimer

The developers of this package are part of the Clavel Lab and are not affiliated with the company Bruker, therefore this package is independent of the company and is distributed under the GPL-3.0 License.

The hexagonal logo was created by Charlie Pauvert and uses the Atkinson Hyperlegible font font and a color palette generated at coolors.co.

References

Footnotes

  1. Matrix-Assisted Laser Desorption/Ionization-Time-Of-Flight (MALDI-TOF)

maldipickr's People

Contributors

cpauvert avatar

Stargazers

 avatar  avatar

Watchers

 avatar

maldipickr's Issues

codecov coverage not updated despite GitHub Actions CI/CD success

[2023-10-24T15:35:03.710Z] ['error'] There was an error running the uploader:
Error uploading to https://codecov.io
Error: There was an error fetching the storage URL during POST:
404 - {'detail': ErrorDetail(string='Unable to locate build via Github Actions API.
Please upload with the Codecov repository upload token to resolve issue.', code='not_found')}

https://github.com/ClavelLab/maldipickr/actions/runs/6629129466/job/18007735293#step:8:39

use a standardised format to store the raw spectra and the processed spectra

Currently, the spectra and peaks are stored as RDS files containing MassSpectrum or MassPeaks R objects. These objects are metadata-rich which is fundamental.

There is indeed a couple of standard file format (e.g., mzML) to which these objects can be exported using MALDIquantForeign, but the metadata are loss in the process..

add function to gather spectra checks stats

Is your feature request related to a problem? Please describe.
I'm always frustrated when I need to compute how many raw spectra were analyzed, how many valid, and why they were rejected.

Describe the solution you'd like
This function below is an untested, undocumented attempt:

gather_spectra_stats <- function(check_vectors){
  # check_vectors from maldipickr::check_spectra
  # src: https://stackoverflow.com/a/51140480/21085566
  aggregated_checks <- Reduce(`|`, check_vectors)
  check_stats <- vapply(check_vectors, sum, FUN.VALUE = integer(1)) %>%
    tibble::as_tibble_row()
  tibble::tibble(
    "n_spectra" = length(aggregated_checks),
    "n_valid_spectra" = n_spectra - sum(aggregated_checks)
  ) %>%
    dplyr::bind_cols(check_stats) %>% 
    return()
}

Release maldipickr 1.1.1

First release:

Prepare for release:

  • git pull
  • urlchecker::url_check()
  • devtools::build_readme()
  • devtools::check(remote = TRUE, manual = TRUE)
  • devtools::check_win_devel()
  • git push
  • Draft blog post

Submit to CRAN:

  • usethis::use_version('major')
  • devtools::submit_cran()
  • Approve email

Wait for CRAN...

  • Accepted 🎉
  • Add preemptive link to blog post in pkgdown news menu
  • usethis::use_github_release()
  • usethis::use_dev_version(push = TRUE)
  • Finish blog post
  • Tweet

`reframe()` instead of `summarise()` when dplyr > 1.1.0

In the example of pick_spectra(), reproduced below:

# 4.2 Pick the spectra from clusters without spectra
#   labelled as `picked_before` (hard masking).
pick_spectra(clusters, metadata, "OD600",
  hard_mask_column = "picked_before"
)

A warning advocating for the replacement of summarise() by reframe() :

#> Warning: Returning more (or less) than 1 row per `summarise()` group was deprecated in
#> dplyr 1.1.0.
#> ℹ Please use `reframe()` instead.
#> ℹ When switching from `summarise()` to `reframe()`, remember that `reframe()`
#>   always returns an ungrouped data frame and adjust accordingly.
#> ℹ The deprecated feature was likely used in the maldipickr package.
#>   Please report the issue at <https://github.com/ClavelLab/maldipickr/issues>.

but current dplyr version used is 1.0.10

improve handling of empty spectra

Consider adding a remove_empty() function to clean up the spectra, the peaks and the metadata files from the object returned by process_spectra().

Could be coupled with check_spectra() to flag the elements of the list.

Refactor vignettes using diataxis principles

A possible option to reduce the length of the vignettes is to split into 3 vignettes:

  • Import data
  • Process data
  • Cherry-pick

While examples are part of the vignettes, additional examples could be added that would not make it to the examples section of the function but "just" in the vignettes.

Make sure to distinguish tutorials from how-to using https://diataxis.fr/

Release maldipickr 1.3.0

Prepare for release:

  • git pull
  • Check current CRAN check results
  • Check if any deprecation processes should be advanced, as described in Gradual deprecation
  • Polish NEWS
  • urlchecker::url_check()
  • devtools::build_readme()
  • devtools::check(remote = TRUE, manual = TRUE)
  • devtools::check_win_devel()
  • revdepcheck::revdep_check(num_workers = 4) no rev deps
  • Update cran-comments.md
  • git push
  • Draft blog post

Submit to CRAN:

  • usethis::use_version('minor')
  • devtools::submit_cran()
  • Approve email

Wait for CRAN...

  • Accepted 🎉
  • Add preemptive link to blog post in pkgdown news menu
  • usethis::use_github_release()
  • usethis::use_dev_version(push = TRUE)
  • Finish blog post
  • Tweet

Find connected components without `{igraph}` or `{tidygraph}`

The packages {igraph} and {tidygraph} are conveniently imported for the dereplication but are only used to detect connected components.

There should be an easy way to recode an equivalent of the connected components algorithm, seeing as we only use limited options there.

This would certainly drastically reduce the number of dependencies!

warning in `pick_spectra` example with summarise/reframe when using the dry-run

pick_spectra

pick_spectra(clusters, discard_regex = "E11", only_show_discarded = TRUE)
#> Warning: Returning more (or less) than 1 row per `summarise()` group was deprecated in
#> dplyr 1.1.0.
#> ℹ Please use `reframe()` instead.
#> ℹ When switching from `summarise()` to `reframe()`, remember that `reframe()`
#>   always returns an ungrouped data frame and adjust accordingly.
#> ℹ The deprecated feature was likely used in the maldipickr package.
#>   Please report the issue at <https://github.com/ClavelLab/maldipickr/issues>.
#> This warning is displayed once every 8 hours.
#> Call `lifecycle::last_lifecycle_warnings()` to see where this warning was
#> generated.

Release maldipickr 1.2.0

Prepare for release:

Submit to CRAN:

  • usethis::use_version('minor')
  • devtools::submit_cran()
  • Approve email

Wait for CRAN...

  • Accepted 🎉
  • Add preemptive link to blog post in pkgdown news menu
  • usethis::use_github_release()
  • usethis::use_dev_version(push = TRUE)
  • Finish blog post
  • Tweet

`to_pick` column is masked in the vignette

The example tables in the vignette are limited in width and some relevant columns are masked.

Could be solved by adding a dplyr::relocate() to some of the examples

example_df %>% dplyr::relocate(name, to_pick)

deprecate `rds_prefix` option in `process_spectra()` because of `{targets}`

Recommend Projects

  • React photo React

    A declarative, efficient, and flexible JavaScript library for building user interfaces.

  • Vue.js photo Vue.js

    🖖 Vue.js is a progressive, incrementally-adoptable JavaScript framework for building UI on the web.

  • Typescript photo Typescript

    TypeScript is a superset of JavaScript that compiles to clean JavaScript output.

  • TensorFlow photo TensorFlow

    An Open Source Machine Learning Framework for Everyone

  • Django photo Django

    The Web framework for perfectionists with deadlines.

  • D3 photo D3

    Bring data to life with SVG, Canvas and HTML. 📊📈🎉

Recommend Topics

  • javascript

    JavaScript (JS) is a lightweight interpreted programming language with first-class functions.

  • web

    Some thing interesting about web. New door for the world.

  • server

    A server is a program made to process requests and deliver data to clients.

  • Machine learning

    Machine learning is a way of modeling and interpreting data that allows a piece of software to respond intelligently.

  • Game

    Some thing interesting about game, make everyone happy.

Recommend Org

  • Facebook photo Facebook

    We are working to build community through open source technology. NB: members must have two-factor auth.

  • Microsoft photo Microsoft

    Open source projects and samples from Microsoft.

  • Google photo Google

    Google ❤️ Open Source for everyone.

  • D3 photo D3

    Data-Driven Documents codes.