GithubHelp home page GithubHelp logo

cutecharts / cutecharts.py Goto Github PK

View Code? Open in Web Editor NEW
752.0 19.0 76.0 57 KB

📉 Hand drawing style charts library for Python

License: MIT License

Python 94.78% HTML 4.18% Batchfile 0.52% Shell 0.52%
charts python

cutecharts.py's Introduction

cutecharts.py logo

📉 Hand drawing style charts library for Python.

Travis Build Status Appveyor Build Status Codecov Package version PyPI - Python Version

PyPI - Format Contributions welcome License

📣 Idea

chart.xkcd is an interesting visualization library written in Javascript, the chart style of chart.xkcd is so cute that I love it at first sight.

There is no doubt that Javascript has more advantages in interaction as well as visual effect. Besides that, as we all know, Python is an expressive language and is loved by data science community. Hence I want to combine the strength of both technologies, as the result of this idea, cutecharts.py is born.

Unfortunately, chart.xkcd only supports a few chart types as a visualization libraray, thus if you have more needs in various kind of chart, pyecharts is better.

What's worth pointing out is that cutecharts is more about a library used to learn how to combine Javascript world with Python/notebook. The project structure of cutecharts is the same as pyecharts and it supports all core features with pyecharts while being more lightweight also more concise overall.

The aim of this project is showing others that it's not difficult to write a pyecharts-like project. In fact, pyecharts does have no magic in its source code. As a member of Python cummunity, I sincerely hope more and more developers can use their creativity to make lots of related projects for our favorite Python world.

🔰 Installation

pip install

$ pip(3) install cutecharts

install from source

$ git clone https://github.com/cutecharts/cutecharts.py.git
$ cd cutecharts.py
$ pip install -r requirements.txt
$ python setup.py install

📝 Usage

Render HTML

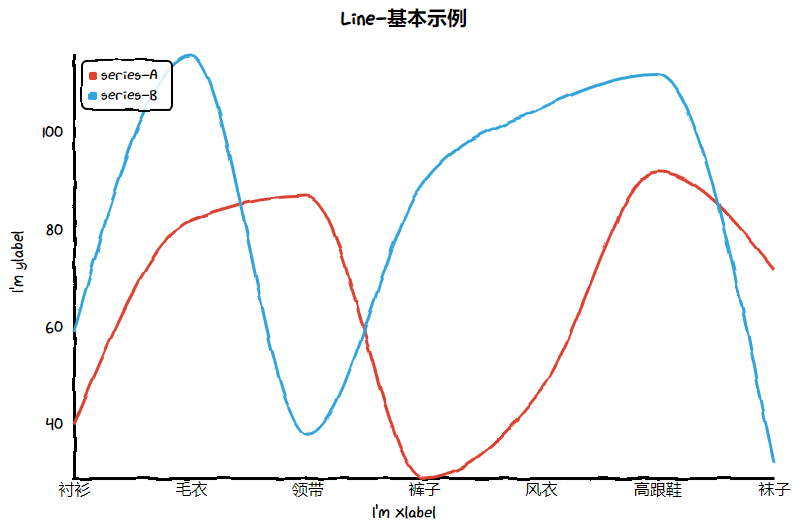
from cutecharts.charts import Line


chart = Line("某商场销售情况")
chart.set_options(
    labels=["衬衫", "毛衣", "领带", "裤子", "风衣", "高跟鞋", "袜子"], 
    x_label="I'm xlabel", 
    y_label="I'm ylabel",
)
chart.add_series("series-A", [57, 134, 137, 129, 145, 60, 49])
chart.add_series("series-B", [114, 55, 27, 101, 125, 27, 105])
chart.render()

And the render.html is rendered as below. Isn't that cool!

Notebook

Jupyter Notebook

JupyterLab

There are some jupyterlab details that you should pay attention to.

# 1. imoport this on the top.
from cutecharts.globals import use_jupyter_lab; use_jupyter_lab()

# 2. call the `load_javascript` function when you renders chart first time.
chart.load_javascript()

🔖 Demo

All demo codes are under examples directory.

⛏ Software development

Unit tests

$ pip install -r tests/requirements.txt
$ test

CI/CD

Travis CI and AppVeyor is place for continuous integration.

Coding styles

flake8, Codecov and pylint are used.

📃 License

MIT ©chenjiandongx

cutecharts.py's People

Contributors

0xflotus avatar ayu-exorcist avatar chenjiandongx avatar dependabot[bot] avatar

Stargazers

 avatar  avatar  avatar  avatar  avatar  avatar  avatar  avatar  avatar  avatar  avatar  avatar  avatar  avatar  avatar  avatar  avatar  avatar  avatar  avatar  avatar  avatar  avatar  avatar  avatar  avatar  avatar  avatar  avatar  avatar  avatar  avatar  avatar  avatar  avatar  avatar  avatar  avatar  avatar  avatar  avatar  avatar  avatar  avatar  avatar  avatar  avatar  avatar  avatar  avatar  avatar  avatar  avatar  avatar  avatar  avatar  avatar  avatar  avatar  avatar  avatar  avatar  avatar  avatar  avatar  avatar  avatar  avatar  avatar  avatar  avatar  avatar  avatar  avatar  avatar  avatar  avatar  avatar  avatar  avatar  avatar  avatar  avatar  avatar  avatar  avatar  avatar  avatar  avatar  avatar  avatar  avatar  avatar  avatar  avatar  avatar  avatar  avatar  avatar  avatar

Watchers

 avatar  avatar  avatar  avatar  avatar  avatar  avatar  avatar  avatar  avatar  avatar  avatar  avatar  avatar  avatar  avatar  avatar  avatar  avatar

cutecharts.py's Issues

要是能嵌入markdown就更好了

https://github.com/Python-Markdown/markdown 可以将markdwon文件转换为html,它有插件机制,能够支持流程图等等

要是可以写下面这样,然后在整个转换的文档中嵌入画图就更方便了

这是某商场销售情况报告

​```cutecharts


chart = Line("某商场销售情况")
chart.set_options(
    labels=["衬衫", "毛衣", "领带", "裤子", "风衣", "高跟鞋", "袜子"], 
    x_label="I'm xlabel", 
    y_label="I'm ylabel",
)
chart.add_series("series-A", [57, 134, 137, 129, 145, 60, 49])
chart.add_series("series-B", [114, 55, 27, 101, 125, 27, 105])
chart.render()
​```

可以看出xxxx

background color

A noob question: Is there a way to change background color, edge color , edge width and further such customizations?

bar的问题

请问如何使bar中的条形图自动填充上颜色,而不是点击时才有颜色
How to make bar graph in bar automatically fill with color instead of color when clicking

Cutecharts does not render in Jupyter notebook run in JupyterLite

I am writing code to display a simple Pie chart using cutecharts, and I am running into an error that I do not entirely understand. The following code runs without error, but no chart is actually rendered:

import piplite
await piplite.install('cutecharts')
await piplite.install('pandas')

import pandas as pd
df = pd.DataFrame({'testLabel':['testLabel1'], 'testData':[1]})

from cutecharts.charts import Pie
chart = Pie(str.upper('test'))
chart.set_options(
    labels=list(df['testLabel']),
    inner_radius=0
)
chart.add_series(list(df['testData']))
chart.render_notebook()

I am running this in Jupyter lite. I appreciate any help!

使用汉字手写体

原系统中使用的是xkcd这样的名称,它是用内嵌的字体的,见
https://github.com/timqian/chart.xkcd/blob/master/src/utils/addFont.js
我试着加上以下的手写汉字字体(851是可以免费下载的)。

		<style>
		@font-face
		{
			font-family: xkcd;
			src: url('851.ttf') format('truetype');
			font-weight:bold;
		}
		</style>

但是有的部分(如图表标题、鼠标指上去后变手写体),有的部分却不变(如刻度上的汉字仍为黑体)。不知为什么?
(我想插入个截图在这里,但插入总是不成功,被墙了?)

图表无法正常显示

jupyter-lab
无法运行的 notebook 无法正常显示

image

如果直接运行 ipython notebook 生成的notebook 可以正常显示

image

Export and save as [png|pdf]

Is it possible to save the plotted graph as a png format and not generate html file assuming, of course, that I don't need the interactive functionality?

Recommend Projects

  • React photo React

    A declarative, efficient, and flexible JavaScript library for building user interfaces.

  • Vue.js photo Vue.js

    🖖 Vue.js is a progressive, incrementally-adoptable JavaScript framework for building UI on the web.

  • Typescript photo Typescript

    TypeScript is a superset of JavaScript that compiles to clean JavaScript output.

  • TensorFlow photo TensorFlow

    An Open Source Machine Learning Framework for Everyone

  • Django photo Django

    The Web framework for perfectionists with deadlines.

  • D3 photo D3

    Bring data to life with SVG, Canvas and HTML. 📊📈🎉

Recommend Topics

  • javascript

    JavaScript (JS) is a lightweight interpreted programming language with first-class functions.

  • web

    Some thing interesting about web. New door for the world.

  • server

    A server is a program made to process requests and deliver data to clients.

  • Machine learning

    Machine learning is a way of modeling and interpreting data that allows a piece of software to respond intelligently.

  • Game

    Some thing interesting about game, make everyone happy.

Recommend Org

  • Facebook photo Facebook

    We are working to build community through open source technology. NB: members must have two-factor auth.

  • Microsoft photo Microsoft

    Open source projects and samples from Microsoft.

  • Google photo Google

    Google ❤️ Open Source for everyone.

  • D3 photo D3

    Data-Driven Documents codes.