GithubHelp home page GithubHelp logo

dfsp-spirit / fsbrain Goto Github PK

View Code? Open in Web Editor NEW
59.0 3.0 12.0 383.73 MB

R library for structural neuroimaging. Provides high-level functions to access (read and write) and visualize surface-based brain morphometry data for individuals and groups.

License: Other

R 98.62% Shell 0.03% Dockerfile 1.35%
neuroimaging freesurfer visualization brain r mri surface voxel research 3d

fsbrain's Introduction

Hi, I'm Tim Schäfer. I am a bioinformatician and currently a Research Software Engineer in the department of Biodiversity Informatics at Senckenberg Society for Nature Research.

  • 🚀 I enjoy using tools like Python, Julia, C++, Docker and R to solve scientific problems, build high quality scientific software and services, and promote open science and open research data.
  • 🌱 I’m currently working on open linked data, FAIR digital objects, and sustainable research data management at Senckenberg. We use an internal GitLab instance, so my activity here on GitHub will decline a bit, but I still have an eye on the software I maintain.

I get a ton of Github notifications and things do slip through once in a while, so if you want to contact me on something unrelated to my software projects, please write me an email.

fsbrain's People

Stargazers

 avatar  avatar  avatar  avatar  avatar  avatar  avatar  avatar  avatar  avatar  avatar  avatar  avatar  avatar  avatar  avatar  avatar  avatar  avatar  avatar  avatar  avatar  avatar  avatar  avatar  avatar  avatar  avatar  avatar  avatar  avatar  avatar  avatar  avatar  avatar  avatar  avatar  avatar  avatar  avatar  avatar  avatar  avatar  avatar  avatar  avatar  avatar  avatar  avatar  avatar  avatar  avatar  avatar  avatar  avatar  avatar  avatar

Watchers

 avatar  avatar  avatar

fsbrain's Issues

Error: rgl.viewpoint is depreciated

Describe the bug
Use of vis.() or export() functions results in error (below).
'rgl::rgl.viewpoint' is deprecated.
Use 'view3d' instead.

To Reproduce
Any of vis.() or export() functions reproduces this error.

Expected behavior
Printing of brain maps in pop-up.

Environment:

  • Operating System [e.g. MacOS10.13, or Ubuntu 20.04]:
    Windows 10
  • R version (output of R --version in system shell):
    R version 4.3.0 (2023-04-21 ucrt)
  • fsbrain version (output of packageVersion('fsbrain') in R):
    0.5.3
  • Rstudio version
    RStudio 2023.03.0+386 "Cherry Blossom" Release (3c53477afb13ab959aeb5b34df1f10c237b256c3, 2023-03-09) for Windows
    Mozilla/5.0 (Windows NT 10.0; Win64; x64) AppleWebKit/537.36 (KHTML, like Gecko) RStudio/2023.03.0+386 Chrome/108.0.5359.179 Electron/22.0.3 Safari/537.36

Backup nitestdata on public, scientific repo

The extra data one can download with fsbrain::opt_data() is hosted on my private server.

This is fine with me, but we should create a backup of all the files and make it available on some public, scientific data repository like Zenodo.

It would be idea if the data was not in a zip, but as single files which can be directly linked to (so we can actually pull from there in fsbrain), but a zip archive as a pure backup of the data would be better than nothing, I guess.

Support limiting the plotted data range

In vis functions like vis.data.on.subject, there should be an option to limit the plotted data range.

This should of course be reflected in the min and max values displayed on the colorbar (if any).

Meshes look garbled (like spiky abstract stuff) in the visualization

This happens if you are using fsbrain v0.0.1 in combination with the new freesurferformats version v0.1.4 and will be fixed in the upcoming fsbrain release v0.0.2.

Until the new release is on CRAN, you have the following workaround options (chose one):

  1. downgrade freesurferformats to v0.1.3 or
  2. leave freesurferformats at v0.1.4, but install the dev version of fsbrain from github

visualising group difference maps

Dear Mr. Schäfer,
first of all, thanks for the amazing package!
I am currently using group.morph.agg.standard.vertex to calculate group difference maps (i.e. agg.data.group1 - agg.data.group2) and display it using vis.data.on.fsaverage. I played around with RColorBrewer::brewer.pal(5, name = "RdBu")) as a diverging colour palette.
CC-SCavg_01

  1. The colour bar doesn't seem centred around 0 = white. The scale takes slightly off to the right/positive side. Is there a way to centre it manually?
    Edit: I managed this by adding the symm argument to makecmap_option = list('colFn'=RdBu,'symm'=TRUE)

  2. As you may also see, the differences are actually quite small. Do you have any recommendations on how to improve visibility? Can one for example increase the colour intervalls (small difference = stronger colour)?

  3. I tried using surface = inflated, which resulted in a overlay of both hemispheres. Do you have any suggestions on how to fix that?
    CC-SCavg_02

Thank you!

Error in setwd(dir) : cannot change working directory - while creating GIF movie using fsbrain locally

Describe the bug
I installed fsbrain in Rstudio locally (without using Docker) , seems successfully without any error shows up.
But while running vis.subject.morph.native to create GIF movie, but got error saying

Error in setwd(dir) : cannot change working directory

I did make sure the working directory is right.

Screenshots
image

Environment:

  • Operating System: Windows 10 Enterprise, Version 20H2
  • R version (output of R --version in system shell): 3.6.1
  • fsbrain version (output of packageVersion('fsbrain') in R): 0.5.0

Thank you very much.
Xin

Match the background vertices and results vertices

Thanks for the package!

I'm trying to visualize the results of the whole-brain vertex-wised analysis after the correction of multiple comparisons (.mgh file). Here's my code

vis.data.on.fsaverage(subjects_dir = subject_dir,
                      morph_data_lh = "freesurfer/mc-z.abs.th20.sig.cluster.mgh",
                      surface = "inflated", bg = "curv_light")

However, the # of vertices seems to be mismatched, which the .mgh file has 163842 vertices and the background has 655368.

Is there any way to match them?
Thanks!

Neuroconductor CI

We are trying to get the package into neuroconductor, but some of the unit tests still fail with their CI setup:

[ OK: 473 | SKIPPED: 30 | WARNINGS: 1 | FAILED: 4 ]
1. Error: Creating pub-ready figure export from coloredmeshes works. (@test-brainview_magic.R#12) 
2. Error: Visualizing a single image for a group of subjects works for native space morph data. (@test-vis_group.R#11) 
3. Error: Visualizing a single image for a group of subjects works for standard space morph data. (@test-vis_group.R#31) 
4. Error: Visualizing a single image for a group of subjects works for atlas data. (@test-vis_group.R#53)

See https://travis-ci.com/github/neuroconductor/fsbrain/ for details.

We need to investigate why that happens and fix it or find out how to disable the tests on their CI. It could be that this is related to file storage permissions, as the tests for these functions write image files to the current working directory.

Problem with basic visualization in tutorial

Hi,
I am a new FSbrain user and I am trying to get a simple basic visualization using the tutorial.

I used this script:
fsbrain::download_optional_data();
subjects_dir = fsbrain::get_optional_data_filepath("subjects_dir");
subject_id = 'subject1';
surface = 'white';
hemi = 'both';
label = 'cortex.label';
vis.subject.label(subjects_dir, subject_id, label, hemi, views="si")

I don't get any errors, but my only output is "list()".

The same when I try to visualize atlas regions on a surface mesh using:

vis.subject.annot(subjects_dir, 'subject1', 'aparc', 'both', views=c('si'));

Can you please help me resolve this issue?

fsaverage.path() should prefer FreeSurfer version over local download

fsaverage.path() should prefer FreeSurfer version over local download

Example:
run fsaverage.path() on a system that has a copy of fsaverage in a (discoverable) FreeSurfer installation, and in the package cache.

Expected result: the path to $FREESURFER_HOME/subjects/ is returned.

Result: the path to the version in the package cache is returned

fsbrain version used: 0.3.0, 0.3.1-dev

Issues to create a GIF file using fsbrain docker image

Describe the bug
The fabrain docker installation is succeed.

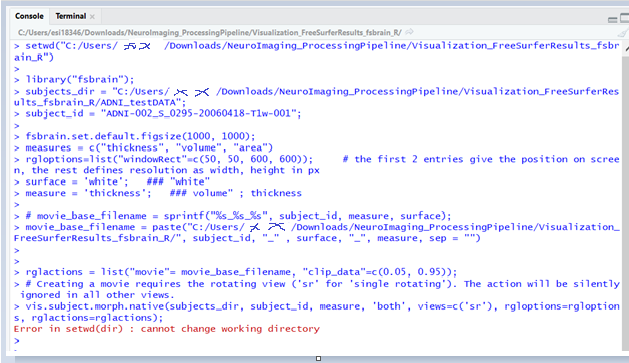
Within the Docker R console, I would like to create a GIF file using the demo code as below

library("fsbrain");
subjects_dir = "/home/input";
subject_id ='fsaverage'

rgloptions=list("windowRect"=c(50, 50, 600, 600));
surface = 'white';
measure = 'thickness';

movie_base_filename = paste("/home/output/", subject_id, "" , surface, "", measure, sep = "")

rglactions = list("movie"=movie_base_filename, "clip_data"=c(0.05, 0.95));
vis.subject.morph.native(subjects_dir, subject_id, measure, 'both', views=c('sr'), rgloptions=rgloptions, rglactions=rglactions);

To Reproduce
While the code is running, I can see some images are saved in the local folder.
However, the Docker R console is frozen at 200 images; showing message as "Writing '/home/output/fsaverage_white_thickness200.png' "

Then all the saved images in the local folder are all disappeared.
Then some message shows in the Docker R console as below:

Possible actions:
1: abort (with core dump, if enabled)
2: normal R exit
3: exit R without saving workspace
4: exit R saving workspace
Selection:
Selection:
Selection:

Expected behavior
A clear and concise description of what you expected to happen.

Screenshots
image

Environment:

  • Operating System :
    NAME="Ubuntu"
    VERSION="18.04.5 LTS (Bionic Beaver)"
    ID=ubuntu
    ID_LIKE=debian
    PRETTY_NAME="Ubuntu 18.04.5 LTS"
    VERSION_ID="18.04"

Here I use the fsbrain docker dfspspirit/fsbrain:0.4.3

  • R version (output of R --version in system shell): R version 3.6.3 (2020-02-29)
  • fsbrain version (output of packageVersion('fsbrain') in R): 0.4.3

Looking forward to your reply and thank you very much.
Xin

Fix white stripes in custom background of images exported with vis.export.from.coloredmeshes

Describe the bug
2 horizontal white stripes occur in custom background color when using the background_color parameter of vis.export.from.coloredmeshes

To Reproduce

library('fsbrain')
download_optional_data();
download_fsaverage(accept_freesurfer_license = TRUE);
subjects_dir = get_optional_data_filepath("subjects_dir");
coloredmeshes = vis.subject.morph.standard(subjects_dir, "subject1", "sulc", cortex_only=TRUE, views=NULL);
vis.export.from.coloredmeshes(coloredmeshes, background_color = "black");

Expected behavior
The background has the requested background color, no stripes.

Screenshots
If applicable, add screenshots to help explain your problem.
fsbrain_arranged

Environment:

  • Operating System [e.g. MacOS10.13, or Ubuntu 20.04]: Ubuntu 18.04
  • R version (output of R --version in system shell): 3.6.1
  • fsbrain version (output of packageVersion('fsbrain') in R): 0.4.3-dev from GitHub master

Additional context
This most likely occurs because of incorrect use of magick::image_append, which requires that images have the same height/width. Apparently the function still does something, but it first pads the smaller image with a non-configurable color (white). We may need to pad the smaller image manually with the background color before passing the images to magic::image_append to fix this bug.

makecmap_options 'range' return error and Additional view

Hi, great library, I've been looking for a long time for a brain surface visualization in R and this is it! congratulations!

I have two issues, the first one is that i get an error always that I try to use the option 'range' in makecmap_options. I'm trying to plot multiple t-maps (different groups) each one with different ranges (eg -3.111146 to 1.971525, from -2.832567 to 1.303646, and from -1.491863 to 2.467869). I want them to be visually comparable, so I tried to set a fixed color range between -3 and 3. for all of them.

This code that kind of works but changes the color range of the latter group:

  # colormap options:
  makecmap_options = list('colFn'=BlGrRd, 'symm'=TRUE) #, 'range'=c(-3,3)
  
  # surface visualization
  vis.region.values.on.subject(template_subjects_dir, template_subject, atlas, 
                               lh_region_value_list, rh_region_value_list, rglactions=list("trans_fun"=limit_fun(-3, 3)),
                               surface = 'pial', makecmap_options = makecmap_options, draw_colorbar = TRUE)

When I try:

makecmap_options = list('colFn'=BlGrRd, 'symm'=TRUE, 'range'=c(-3,3))

I get the following error:

 Error in if (data_range[1] < min(x)) { : 
  missing value where TRUE/FALSE needed 

The second issue is about the views, you currently provide the following output 2x2:
Left-lateral Right-lateral
Left-medial Right-medial

How could I make a horizontal view eg 1x4:
Left-lateral Left-medial Right-medial Right-lateral

thank you!

Symmetrical colorbars are drawn incorrectly

There is something wrong with the visualization of symmetric color legends. Needs investigation.

For an example, draw a colorbar using the unit test for vis.symmetric.data.on.subject that uses the cluster data.

Reproducible example:

subjects_dir = file.path(find.freesurferhome()$found_at, 'subjects');
subject_id = 'fsaverage';

lh_demo_cluster_file = system.file("extdata", "lh.clusters_fsaverage.mgz", package = "fsbrain", mustWork = TRUE);
rh_demo_cluster_file = system.file("extdata", "rh.clusters_fsaverage.mgz", package = "fsbrain", mustWork = TRUE);

lh_clust = freesurferformats::read.fs.morph(lh_demo_cluster_file);   # contains a single positive cluster (activation, group difference), the other values are 0
rh_clust = freesurferformats::read.fs.morph(rh_demo_cluster_file);   # contains two negative clusters

vis.symmetric.data.on.subject(subjects_dir, subject_id, lh_clust, rh_clust, bg="curv", draw_colorbar = T);

Colormap over BG + Saving

Hello,
Thank you for implementing the freesurfer background. I'm having trouble getting fsbrain to read my colorbar. My input is as follows:

vis.region.values.on.subject(template_subjects_dir, template_subject, atlas, lh_region_value_list, rh_region_value_list, colormap=squash::"bluered",bg="curv", surface="inflated",draw_colorbar = TRUE);

which plots successfully, but does not use "bluered" to plot values. I receive the error:

In makecmakeopts.merge(makecmap_options, colormap) : Two different colormap functions found in parameters 'makecmap_options' and 'colormap', using the one from 'makecmap_options'.

Also, I cannot find how to save this image to PNG.

Thanks again

MacOS support of fsbrain

Problem: There are increasing numbers of technical problems being reported under Mac OS, and I do not have access to a Mac anymore since I changed labs.

The issues are all downstream rgl problems, where no figures are shown (e.g., #46, #37) or similar issues.

I feel that since OpenGL is not officially supported by Apple anymore, it is a matter of time when we will stop supporting MacOS. The problem is that rgl, the renderer used by fsbrain, is based on OpenGL. I am not aware of any alternative renderer we could use under MacOS. If people have ideas, please let me know. That being said, even though OpenGL has been deprecated, it should still work right now, but we will have to come up with an idea for the future.

I considered writing a renderer myself (or rather wrapping an existing C++ renderer into an R package), but given that I am currently leaving R behind for Python and Julia, this seems to be way too much work. For now, we will wait what the R community comes up with.

Snapshot at an angle?

I love some of the new updates and the new advanced visualization notebooks! I'm now using fsbrain for pretty much all my visualization, and I noticed you can now rotate hemispheres with your mouse when plotting in t4 and t9 layouts as well as the usual si. So cool. I want a snapshot at a very specific angle of one hemisphere, and couldn't figure out how to feed that into any of the visualization functions so that when the snapshot is taken, it's already at this specific angle that I can rotate it to, rather than the straight-on medial views. Am I missing something?

I dug a little bit but concluded I'd have to modify a deep-down parameter/function, and thought I'd ask if there was a more elegant way to achieve this.

Support writing subject metadata to separate MD file when saving cached data for groups

Currently there is a risk of unexpected subject count/order when loading a SF cached file, e.g.:

# write data with sjl on one day
full_data_std_space = group.morph.standard(sjd, sjl, measure, fwhm=fwhm, cortex_only = T, df=T);   
write.group.morph.standard.sf(file.path(sjd, sprintf("group.%s.fwhm%s.fsaverage.mgh", measure, fwhm)), full_data_std_space)

If we now change the order of subjects in the sjl and reload a few days later without thinking about it:

 stddata[[fwhm_tag]] = group.morph.standard.sf(file.path(sjd, sprintf("group.%s.fwhm%s.fsaverage.mgh", measure, fwhm))); 

We may not notice that the data order does not match the saved subjects order, which could be fatal.

Therefore, I suggest to save subject order (ids) in a separate metadata file automatically, and verify it on load if that file is available.

Getting error that the subject file is missing even though the subject file is present in the subjects directory.

Getting the following error:

sjd= '~/Desktop/InMedPro/cortical_pipelines/Fsbrain/Subjects'
sj= 'subject1'
fsbrain.set.default.figsize(700, 700);
cm = vis.subject.morph.standard(sjd, sj, 'thickness', fwhm='10', cortex_only = T, views=NULL);

Error in check.subjectslist(subject_id, subjects_dir = subjects_dir) :
Directories for the following 1 subjects missing in subjects directory '~/Desktop/InMedPro/cortical_pipelines/Fsbrain/Subjects': subject1

THE SAID FILE IS PRESENT IN THE SUBJECTS DIRECTORY. Please help me know how to solve this error.
Screenshot from 2021-06-11 11-46-42

display p-values overlay

Describe the feature you are missing
A clear and concise description of the feature. Should include information on the expected inputs and output.

FSbrain should be able to load p-value or other MGH with surface data and display it. FDR correction would also be helpfule.

Use Cases

  • Your use case for the feature.
  • Why do you think that this feature is of general interest, e.g., not only relevant to you.

Automatic p-values maps is very useful when publishing neuroimaging from Fressurfer data.

Inflated views intertwined

When I display inflated views the left and right hemispheres intertwine for the anterior/posterior and superior/inferior views.

I can't figure out how to display them on their own or get an angled view as in Figure 5B here https://cran.r-project.org/web/packages/fsbrain/vignettes/fsbrain.html

I am using vis.region.values.on.subject and export functions -- the 'si' view also intertwines the two hemispheres. and those functions don't have a hemi option.

coloredmesh from Brain surface trimesh and values vector

Hi, I would like to visualize custom made surfaces in GIFTI format which do not follow the default Freesurfer organization (SUBJECTS_DIR/subject-identifier).

I was able to read the left and right surfaces with read.fs.surface.gii, and I have a vector with the associated vertex value. So I have two brain surface trimesh, one for each hemisphere (lh.mysurf and rh.mysurf) and the associated vertex value in a variable called vtx.val.

> lh.mysurf
Brain surface trimesh with 32492 vertices and 64980 faces.
-Surface coordinates: minimal values are (-61.21, -102.58, -35.97), maximal values are (1.40, 62.72, 67.89).

Essentially, I would like to build a coloredmesh from lh.mysurf, rh.mysurf and vtx.val.
to be able to use a function like vis.coloredmeshes() and visualize my custom surface with all the option rgl actions that you've implemented.
I tried several things but I couldn't figure out how to do this.

I would really appreciate your help

best

highlighting directly adjacent vertices fails with error

Describe the bug

Trying to highlight 2 adjacent vertices using the function highlight.vertices.on.subject.spheres() leads to the following error message:

Error in rgl.material(...) : There must be at least one color
In addition: Warning messages:
1: In coloredmesh.from.color(subjects_dir, subject_id, color_data$rh,  :
  Data mismatch: surface has 163842 vertices, but 0 color values passed in argument 'color_data'.

2: In fs.coloredmesh(mesh, color_data, hemi, metadata = metadata) :
  The mesh3d instance from parameter 'mesh' has 163842 vertices, but 0 colors passed in parameter 'col'.

3: In cbind(x, 1) :
 
 Error in rgl.material(...) : There must be at least one color 

To Reproduce

devtools::install_github('dfsp-spirit/fsbrain', ref="geodesic");
fsbrain::download_optional_data();
    fsbrain::download_fsaverage(accept_freesurfer_license = TRUE);
    subjects_dir = fsbrain::get_optional_data_filepath("subjects_dir");
    subject_id = 'fsaverage';

    vertices = c(32258, 171); # These are directly adjacent
    highlight.vertices.on.subject.spheres(subjects_dir, subject_id, vertices = vertices);

Expected behavior
The 2 vertices get highlight in a plot.

Screenshots
none

Environment:

  • Operating System [e.g. MacOS10.13, or Ubuntu 20.04]: Ubuntu 20.04
  • R version (output of R --version in system shell): 3.6.3
  • fsbrain version (output of packageVersion('fsbrain') in R): 0.5.0-dev (unsupported)

Additional context
Add any other context about the problem here.

Gray/Black inflated brain (like freesurfer)

Hello,
First, thank you for developing a great tool. I was wondering if, instead of the white brain used for visualization, the gray/black freesurfer brain could be used instead? is this possible?
thumbnail_image

Thank you,
Daniel Brennan

Multi-layer transparency

We should have a look at multi-layer transparency when stacking (semi-transparent) color layers for surfaces.

When combining more than 2 layers, the last one is not rendered properly atm. Most likely because an opaque background gets added in the first merging step that combines layers 1 and 2.

New fsbrain installation on M1 Mac does not show colorbar

Describe the bug
No colorbar appears when using vis.region.values.on.subject, and I get the error below.

FALLBACK (log once): Fallback to SW fragment processing (outputInfo.polygonModeMismatch)
FALLBACK (log once): Fallback to SW fragment processing, m_disable_code: 800000

To Reproduce
Steps to reproduce the behavior:
Use draw_colorbar=T with vis.region.values.on.subject. Without draw_colorbar=T, no error.

Expected behavior
A clear and concise description of what you expected to happen.

Colorbar appearing, no error.
Screenshots
If applicable, add screenshots to help explain your problem.

Environment:

  • Operating System [e.g. MacOS10.13, or Ubuntu 20.04]: MacOS Monterey 12.2.1
  • R version (output of R --version in system shell): R version 4.1.2 (2021-11-01) -- "Bird Hippie"
  • fsbrain version (output of packageVersion('fsbrain') in R):‘ 0.5.3’

Additional context
Add any other context about the problem here.

Export directly

Hello,
Thank you for the great visualization package. I would like to use this package with our high performance cluster as part of a pipeline. Currently, I have it working on my desktop locally, but run into issues when not being able to render images. Is it possible to create the 2D images and save directly without opening up the RGL windows? This is the point of failure when I try to script it on the cluster.
Thanks!
Matt

Support plotting on log scale

Describe the feature you are missing
It should be possible to plot data on a log scale. The x axis labels on the colorbar should also reflect this.

Use Cases
Plotting data like curvature that is better displayed on a log scale.

Additional context
Request submitted via email to devs by N Lois, see the email for details.

Tight layout with 9 view inflated

I am trying to get a tight layout with the inflated brain on the 9 view. I was reading the FAQ which pointed me to use vislayout.from.coloredmeshes and to use shift_hemis_apart so the hemispheres on inflated don't overlap. My issue, is that when I use export, it recognizes the rglaction correctly and the hemispheres are seperated. However, when I use vislayout.from.coloredmeshes it does not separate the hemispheres. On the other hand, when I use the vislayout.from.coloredmeshes, I get the type of spacing that I would like whereas export has a lot of white space. Wondering if I am doing something wrong in my vislayout call or export calls. Pictures and code below:

Export image:
combined loglate YMb_inflated

vislayout.from.coloredmeshes image

combined loglate YMb_inflated2

code:
`x<-vis.symmetric.data.on.subject(subjects_dir, subject_id, lh_clust, rh_clust, bg="curv", surface = "inflated", rglactions = list('shift_hemis_apart'=TRUE), views = NULL)

export(x, img_only = TRUE, output_img = output_saveinflated,rglactions = list('shift_hemis_apart'=TRUE),view_angles=c("t9"),colorbar_legend= legendname)

vislayout.from.coloredmeshes(x,output_img = output_saveinflated2, view_angles = get.view.angle.names(angle_set = "t9"),rglactions = list('shift_hemis_apart'=TRUE))`

Views other than t4 garbled for inflated and vis.x.on.subject

Somehow, rgl seems to be trying to render both inflated surfaces on top of each other when using vis.data.on.subject or vis.region.values.on.subject with any views other than t4 and the inflated surface. This does not occur with pial or white surfaces. Commands used are below. This has always been the case while I've been using fsbrain (which otherwise I find incredibly beautiful, easy-to-use, and appealing, so THANK you!).

vis.data.on.subject(subjects_dir, 'fsaverage6',overlap_lh, overlap_rh, "inflated", colormap = colorRampPalette(c("white", "white", "pink", "blue")),  views="si", rgloptions = rgloptions, draw_colorbar = T)

Screen Shot 2020-06-15 at 4 03 14 PM

vis.region.values.on.subject(subjects_dir, 'fsaverage6', 'Schaefer2018_400Parcels_7Networks_order',  freq_lh, 
                             freq_rh, colormap=colorRampPalette(c("white","burlywood3","burlywood4")), "inflated", views="t9", rgloptions = rgloptions, rglactions = rglactions, draw_colorbar = T)

Screen Shot 2020-06-15 at 4 02 37 PM

annot.outline as a background

I am trying to combine annot.outline (as a background) with a glm result as an overlay (specifically a cluster-masked sig).

annot.outline looks great on its own, but when used as a background in vis.symmetric.data.on.subject the outlines appear monochrome black. I don't hate this, but it would be good to have the colour.

Apologies if I've misread/misunderstood the docs or missed a known bug that explains this.

Bonus Question: is there a way to make the overlays in vis[.symmetric].data.on.subject semi-transparent? E.g. an alpha argument akin to desaturate? I guess this is not that easy with rgl, but I didn't see it in the faqs.

Thanks in advance,

Andrew


The expected background:
cm1

The result I get with vis.symmetric.data.on.subject
cm2

Environment:
Windows 10
R 4.0.3
fslbrain 0.5.0 (from github)

Script

library(fsbrain)
library(freesurferformats)

# fsbrain::download_fsaverage(accept_freesurfer_license = TRUE)
avpath <- fsbrain::fsaverage.path()

lh_annot <- subject.annot(avpath, "fsaverage", "lh", "aparc")
rh_annot <- subject.annot(avpath, "fsaverage", "rh", "aparc")
lh_inf <- subject.surface(avpath, "fsaverage", "inflated", "lh")
rh_inf <- subject.surface(avpath, "fsaverage", "inflated", "rh")

aparc_outline <- list(
  lh = fsbrain::annot.outline(annotdata = lh_annot,
                              surface_mesh = lh_inf,
                              outline_color = NULL),
  rh = fsbrain::annot.outline(annotdata = rh_annot,
                              surface_mesh = rh_inf,
                              outline_color = NULL)
)

lh_demo_cluster_file = system.file("extdata", "lh.clusters_fsaverage.mgz", package = "fsbrain", mustWork = TRUE);
rh_demo_cluster_file = system.file("extdata", "rh.clusters_fsaverage.mgz", package = "fsbrain", mustWork = TRUE);
lh_clust = freesurferformats::read.fs.morph(lh_demo_cluster_file);   # contains a single positive cluster
rh_clust = freesurferformats::read.fs.morph(rh_demo_cluster_file);   # contains two negative clusters


# atlas borders have colour:
cm1 <- vis.color.on.subject(avpath, "fsaverage",
                     color_lh = aparc_outline$lh,
                     color_rh = aparc_outline$rh,
                     surface = "inflated",
                     views = "t4",
                     rglactions = list(no_vis = TRUE))

# atlas Borders are black:
cm2 <- vis.symmetric.data.on.subject(avpath, "fsaverage",
                              lh_demo_cluster_file,
                              rh_demo_cluster_file,
                              surface = "inflated",
                              views = "t4",
                              bg=aparc_outline,
                              rglactions = list(no_vis = TRUE))

# write out images:
vis.export.from.coloredmeshes(cm1, output_img = "cm1.png", img_only = T)
vis.export.from.coloredmeshes(cm2, output_img = "cm2.png", img_only = T)

datastructure returned by label.to.annot does not have 'fs.annot' class

Describe the bug
The datastructure returned by label.to.annot does not have 'fs.annot' class.
To Reproduce
Steps to reproduce the behavior:

Run the example for label.to.annot, then run: class (annot)

Expected behavior
the list of returned classes should include fs.annot

Screenshots
n/a

Environment:

  • Operating System [e.g. MacOS10.13, or Ubuntu 20.04]: Ubuntu 20.04
  • R version (output of R --version in system shell): 4.1.1
  • fsbrain version (output of packageVersion('fsbrain') in R): 0.5.2

Additional context
Add any other context about the problem here.

9 view inflated surface

Hi Tim,
I am attempting to view the inflated surface in 9 views instead of 4 with some results from a model in the overlay. I'm having some issues where the hemispheres from the inflated image overlap each other in the additional views (images attached). Do you know if this is a limitation or something I am doing incorrectly with the inflated image? When I use the 'white' surface instead of 'inflated', the image is displayed correctly. Here is the code I am using:
`x<-vis.symmetric.data.on.subject(subjects_dir, subject_id, lh_clust, rh_clust, bg="curv_light", surface = "inflated", views = c("t9"))
export(x, img_only = TRUE, output_img = output_saveinflated, view_angles = c("t9"),colorbar_legend= legendname)

z<-vis.symmetric.data.on.subject(subjects_dir, subject_id, lh_clust, rh_clust, bg="curv_light", surface = "white", views = c("t9"))
export(z, img_only = TRUE, output_img = output_savewhite, view_angles = c("t9"),colorbar_legend=legendname)`

No figure output

I appear to have lost the ability to plot image, when I run the tutorial code below it does not produce any image (either in the viewer window nor does it open a new window)... I've updated the installation, updated rgl, checked that my Quartz is up to date and nothing seems to make much difference... I'm running R version 4.0.3 on a Mac...

subjects_dir = fsbrain::get_optional_data_filepath("subjects_dir");
subject_id = 'subject1';
surface = 'white';
hemi = 'both';
label = 'cortex.label';
vis.subject.label(subjects_dir, subject_id, label, hemi, views="si")
vis.subject.annot(subjects_dir, 'subject1', 'aparc', 'both', views=c('si'));

In addition, when I try and run vis.export.from.coloredmeshes with some of my own data I get the following error:

Error in magick_image_trim(image, fuzz) : 
  rsession: GeometryDoesNotContainImage `/private/var/folders/mg/mtwws03n2492cyzkbphbvt5m0000gn/T/Rtmp5TvJWr/sd_lateral_lhd98779fe97c9.png' @ warning/attribute.c/GetImageBoundingBox/532

I suspect these are somehow related problems, but no clue where to even start troubleshooting...

Create fsbrain API cheat sheet

Describe the feature you are missing
It would be great to have an Create fsbrain API cheat sheet, i.e., a single page PDF file with a table that lists functions by API (adhoc/export), data type (morph/annot/cluster), etc.

Use Cases

  • Allow users to quickly get to gribs with fsbrain
  • Can be printed and used as quick reference to save screen space

Additional context
Similar cheat sheets exist for other visualization libs, like ggplot.

I have a question about lh_region_value_list & rh_region_value_list

My code Like This...

subjects_dir = fsbrain::get_optional_data_filepath("subjects_dir");
subjects_list = c("subject1", "subject2");
subject_id = 'subject1';

root_path = '/home/'

surface = 'white';
atlas = 'aparc';
colmap = colorRampPalette(rev(RColorBrewer::brewer.pal(9, name="Reds")))

## Visualization
file_path = paste(root_path,'result.png')
lh_region_value_list = list("unknown"=1);
rh_region_value_list = list("lateraloccipital"=0);
vis.region.values.on.subject(subjects_dir, subject_id, atlas, lh_region_value_list, rh_region_value_list,
                             draw_colorbar=FALSE, makecmap_options = list('colFn'=colmap,'range'=c(0, 0.05)), views = 't9');

How can I avoid putting any values ​​in lh_region_value_list?

lh_region_value_list = list();

Or if i don't put "lh_region_value_list" it won't work.

I couldn't find it in the manual, so I left it as an Issue....

Visualising volume data with surface boundaries

First up - amazing package, thank you so much for making this - it has been much needed and is very welcomed!
I was wondering if there is currently a way to visualize volume data with the surface boundaries overlaid like the image below:

image

Thanks!

Render with R-shiny

Wow, amazing package!

I was trying to incorporate fsbrain into our R-shiny application called RAVE (https://rave.wiki). However, I found that rgl::renderRglwidget cannot render the interactive brain. Instead, fsbrain visualizes the results to xQuartz instead of to the web widget. Would you mind instructing on how I could show them in R-shiny instead of xQuartz?

Thanks : )

library(shiny)
library(fsbrain)

ui <- fluidPage(
  rgl::rglwidgetOutput("viewer")
)

server <- function(input, output, session) {
  output$viewer <- rgl::renderRglwidget({
    subjects_dir = fsbrain::get_optional_data_filepath("subjects_dir");
    subjects_list = c("subject1", "subject2");
    subject_id = 'subject1';   
    vis.subject.annot(subjects_dir, 'subject1', 'aparc', 'both', views=c('si'));
  })
}

shinyApp(ui, server)

Min/Max setting in plotting

I noticed I can set min/max values using limit_fun, but it seem that this is overridden by the actual min and max if they are smaller. I'm generating a series of plots and would ideally like them all to be on the same scale and also all symmetric, is there a way to do so? This is my rough code so far (where cc is simply the contrast I'm plotting in this loop and the colormap is a divergent RdBu map generated with colorbrewer):

  coloredmeshes = vis.symmetric.data.on.subject(subjects_dir,  subject_id,
                                              lh_clust, rh_clust, bg='sulc', rglactions=list( "trans_fun"=limit_fun(-4, 4),'no_vis'=T),
                                              makecmap_options = list('colFn'=colmap))
  img = vis.export.from.coloredmeshes(coloredmeshes, 
                                      colorbar_legend=paste0("Surface Area (t) - ", cc, " - s",smoothness), 
                                      output_img=paste0('./Figures/FS_adult/SA_',cc,'_FWMH',smoothness,'.png'))

No picture out after running "vis.subject.annot" code in Ubuntu 20.04

Well, I succeed in making brain picture in my windows computer (vis.subject.annot(subjects_dir, 'subject1', 'aparc', 'both', views=c('si'))). However, when I ran the same code in linux system(Ubuntu 20.04), the brain picture didn't skip out. In fact, no thing happended in my rstudio on linux system.
I wonder it could be the packages lacking issues. Then, I re-installed "rgl", "oro.nifti", "Rvcg", but there still hasn't brain picture coming out. Besides, there hasn't any error message in my linux terminal.
I am very ensure this isn't my code problem, and I also know this isn't an BUG. But could you please tell me how to deal with it in my linux system?
I would be much appreciated if you could provide me some help or problem directions.

Saving annotation to file

Hi,

We're using vis.subject.annot() to save custom annotations. Supposedly, a custom annotation is made (using freesurfer tools?) and this is saved to an image. Would it be possible to also output the custom annotation (in gii or cifti or .annot) and not just it's image?

Thank you for the great tool!

-joost

Rendering of standard space morphometry data looks off

Rendering of standard space morph data using vis.subject.morph.standard leads to unexpected results. The colors seems to be distributed incorrectly over the surface, and no clear pattern is visible.

It looks like the error is in coloredmesh.from.morph.standard, which does not load the template subject mesh, but the mesh for the subject for which the data was loaded. Should be an easy fix.

Problem with tutorial

Hi
I am a new FSbrain user and I am trying to go through your tutorial and when I entered the code below I get an error:
vis.subject.morph.native(sjd, sj, 'thickness')

I get the following error:

Error in subject.filepath.morph.native(subjects_dir, subject_id, measure, : Native space morphometry file '~/data/subject1_only/subject1/surf/lh.thickness' for subject 'subject1' measure 'thickness' hemi 'lh' cannot be accessed.

Can you please help me resolve this issue?

Recommend Projects

  • React photo React

    A declarative, efficient, and flexible JavaScript library for building user interfaces.

  • Vue.js photo Vue.js

    🖖 Vue.js is a progressive, incrementally-adoptable JavaScript framework for building UI on the web.

  • Typescript photo Typescript

    TypeScript is a superset of JavaScript that compiles to clean JavaScript output.

  • TensorFlow photo TensorFlow

    An Open Source Machine Learning Framework for Everyone

  • Django photo Django

    The Web framework for perfectionists with deadlines.

  • D3 photo D3

    Bring data to life with SVG, Canvas and HTML. 📊📈🎉

Recommend Topics

  • javascript

    JavaScript (JS) is a lightweight interpreted programming language with first-class functions.

  • web

    Some thing interesting about web. New door for the world.

  • server

    A server is a program made to process requests and deliver data to clients.

  • Machine learning

    Machine learning is a way of modeling and interpreting data that allows a piece of software to respond intelligently.

  • Game

    Some thing interesting about game, make everyone happy.

Recommend Org

  • Facebook photo Facebook

    We are working to build community through open source technology. NB: members must have two-factor auth.

  • Microsoft photo Microsoft

    Open source projects and samples from Microsoft.

  • Google photo Google

    Google ❤️ Open Source for everyone.

  • D3 photo D3

    Data-Driven Documents codes.