


emerge is a code analysis tool to gather insights about source code structure, metrics, dependencies and complexity of software projects. You can use it to scan the source code of a project, calculate metric results and statistics, map the source code to graph structures (e.g. a dependency graph or a filesystem graph), export the results in other file formats and even create an interactive web application for further exploration. emerge currently has scanning support for the following languages: C, C++, Groovy, Java, JavaScript, TypeScript, Kotlin, ObjC, Ruby, Swift, Python. The structure, coloring and clustering is calculated and based on the idea of combining a force-directed graph simulation and Louvain modularity. emerge is mainly written in Python 3 and is tested on macOS, linux and modern web browsers (i.e. latest Safari, Chrome, Firefox, Edge).
emerge (/ɪˈməːdʒ/)
- to appear by coming out of something or out from behind something
- to become known, especially as a result of examining something or asking questions about it
The main goal of this project is to create a free/ open source tool, that can easily be used by anyone with interest in software development, architecture, metrics and visualization to gather more insights about those topics. It should facilitate/ support getting a better understanding of a given software project.
- File scan support for the following languages:
C,C++,Groovy,Java,JavaScript,TypeScript,Kotlin,ObjC,Ruby,Swift,Python - Basic entity scan/extraction (e.g. classes) for the following languages:
Groovy,Java,Kotlin,Swift - Basic implementation of the following software metrics: SLOC, Number of Methods, Fan-In/Fan-Out, Modularity (Louvain)
- Logging support with configurable log levels
- Configuration support based on YAML syntax to configure multiple/specific analyses
- Export of scan results/ metrics/ statistics for the following formats/ outputs
- Code dependency, inheritance, complete and filesystem graph (enriched with scan results/metrics)
- GraphML
- Graphviz DOT format
- JavaScript format suited for a D3 force graph simulation
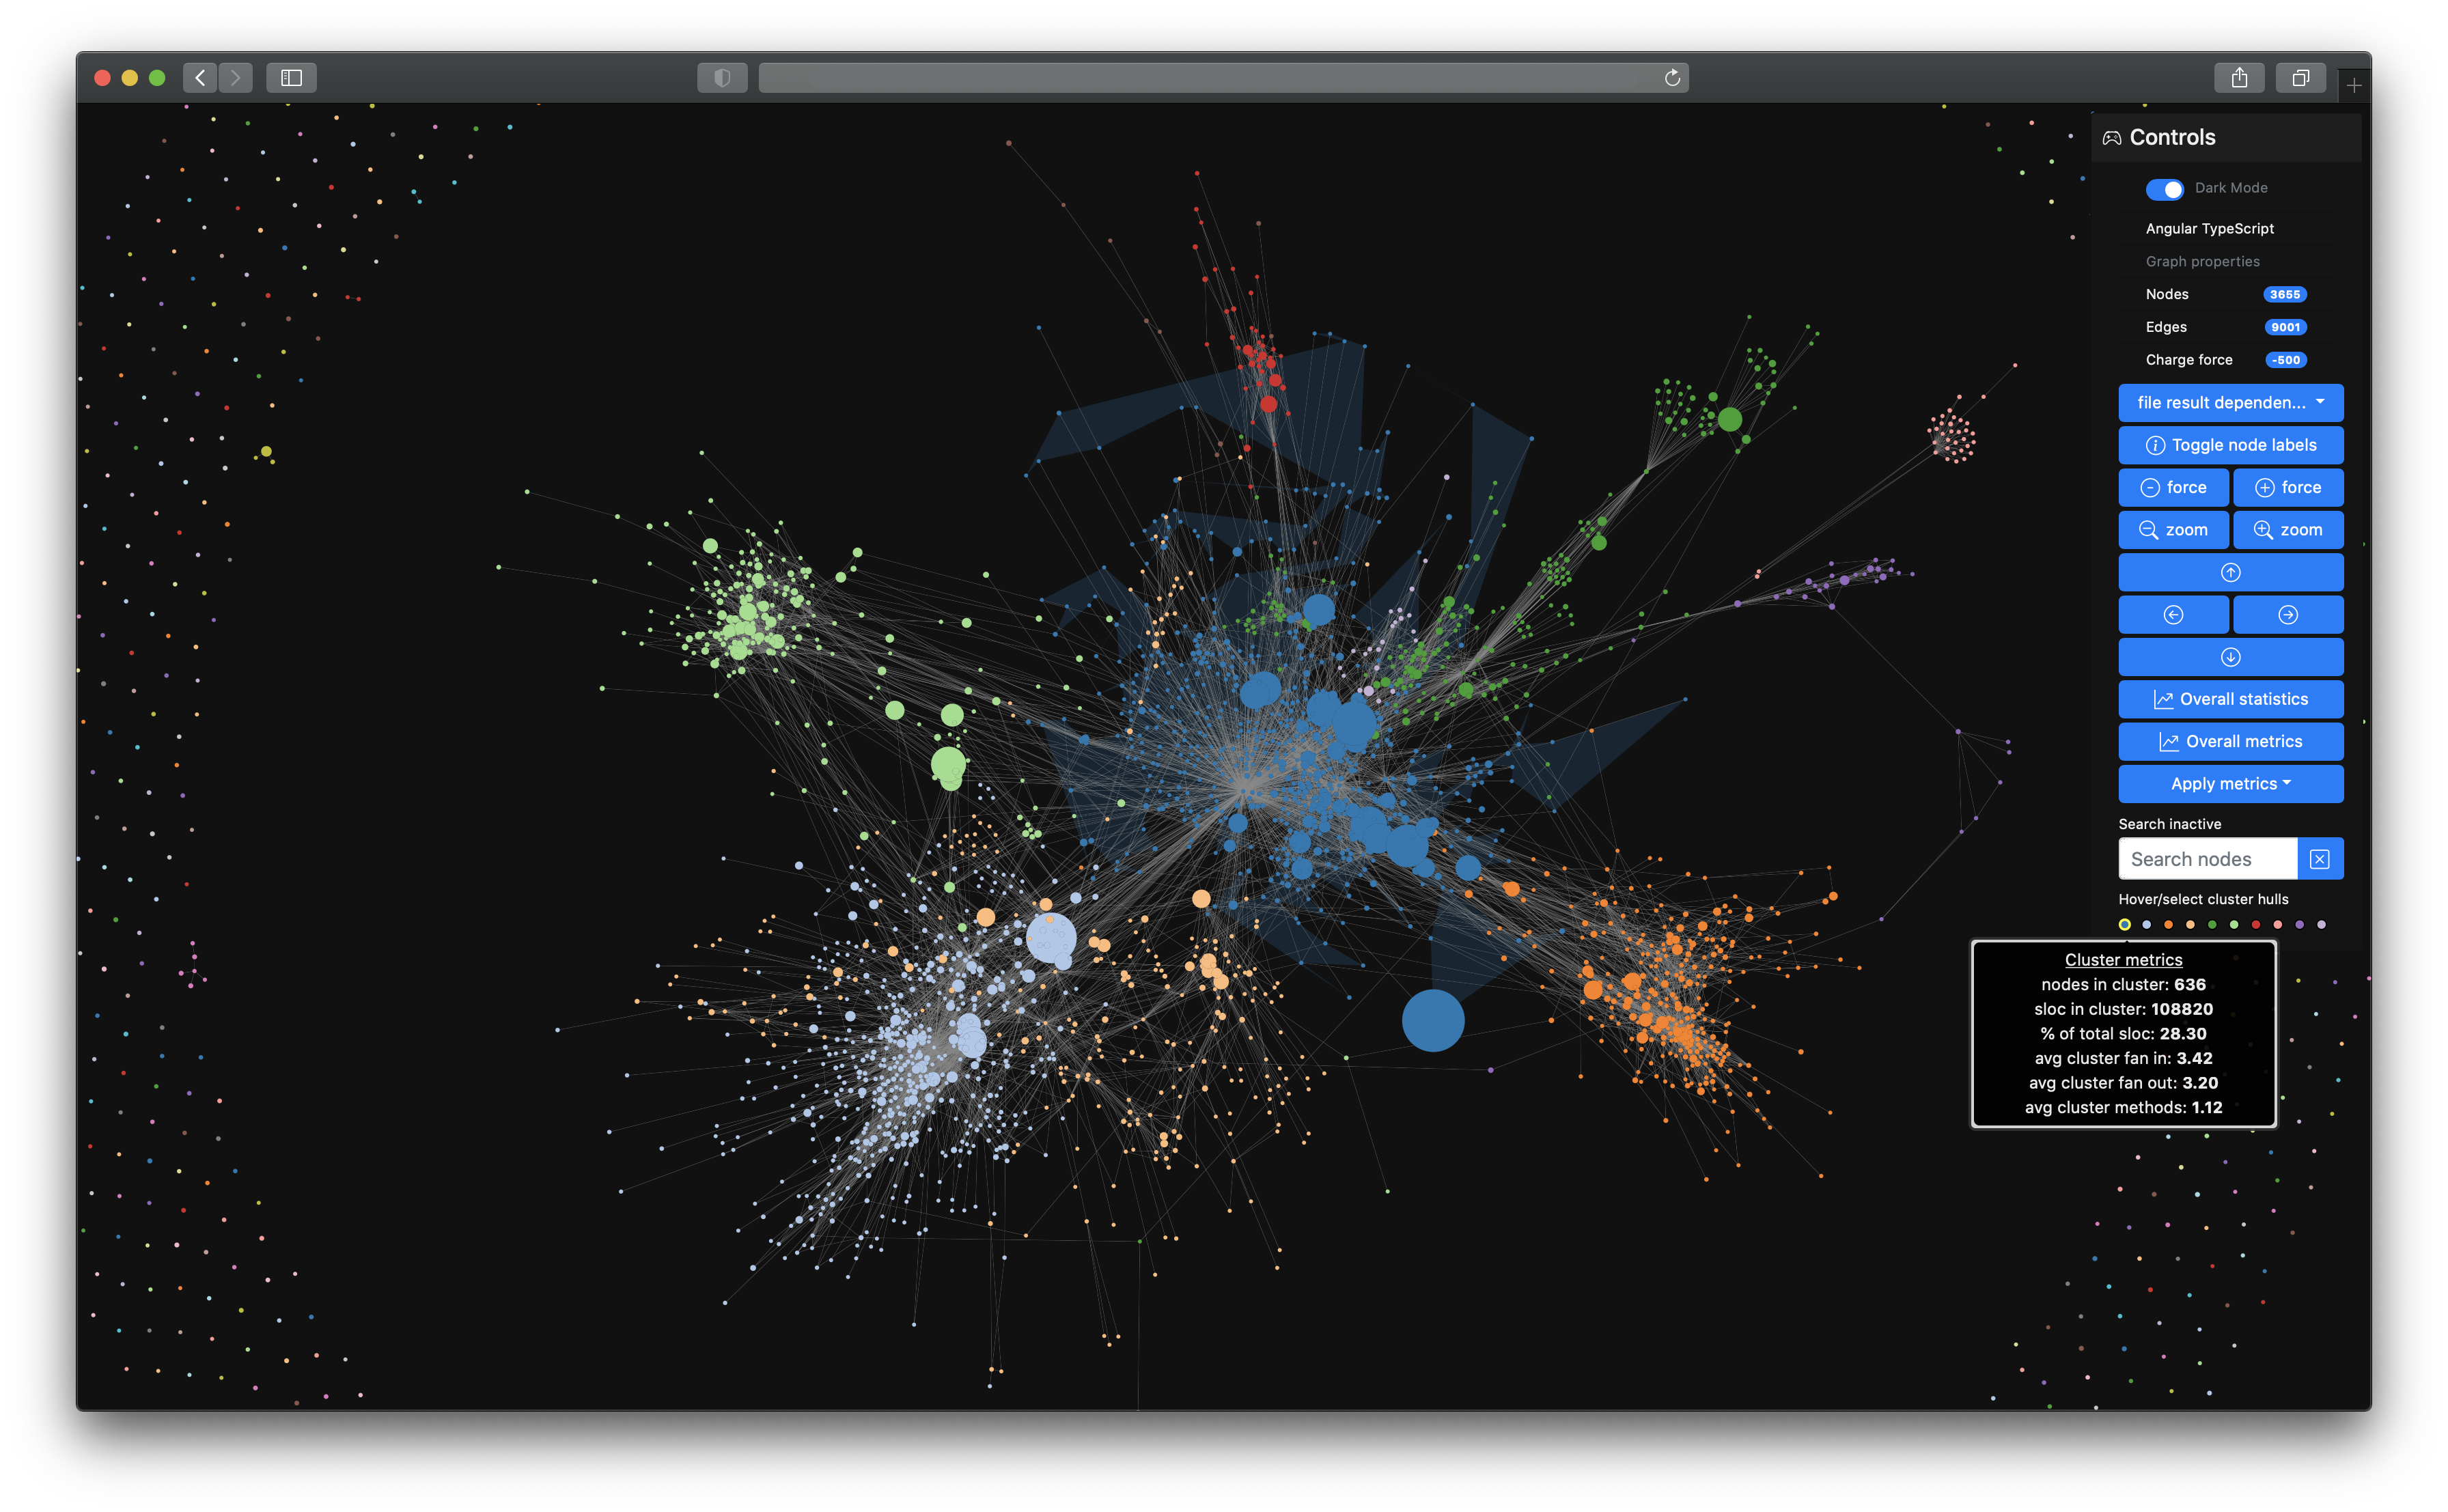
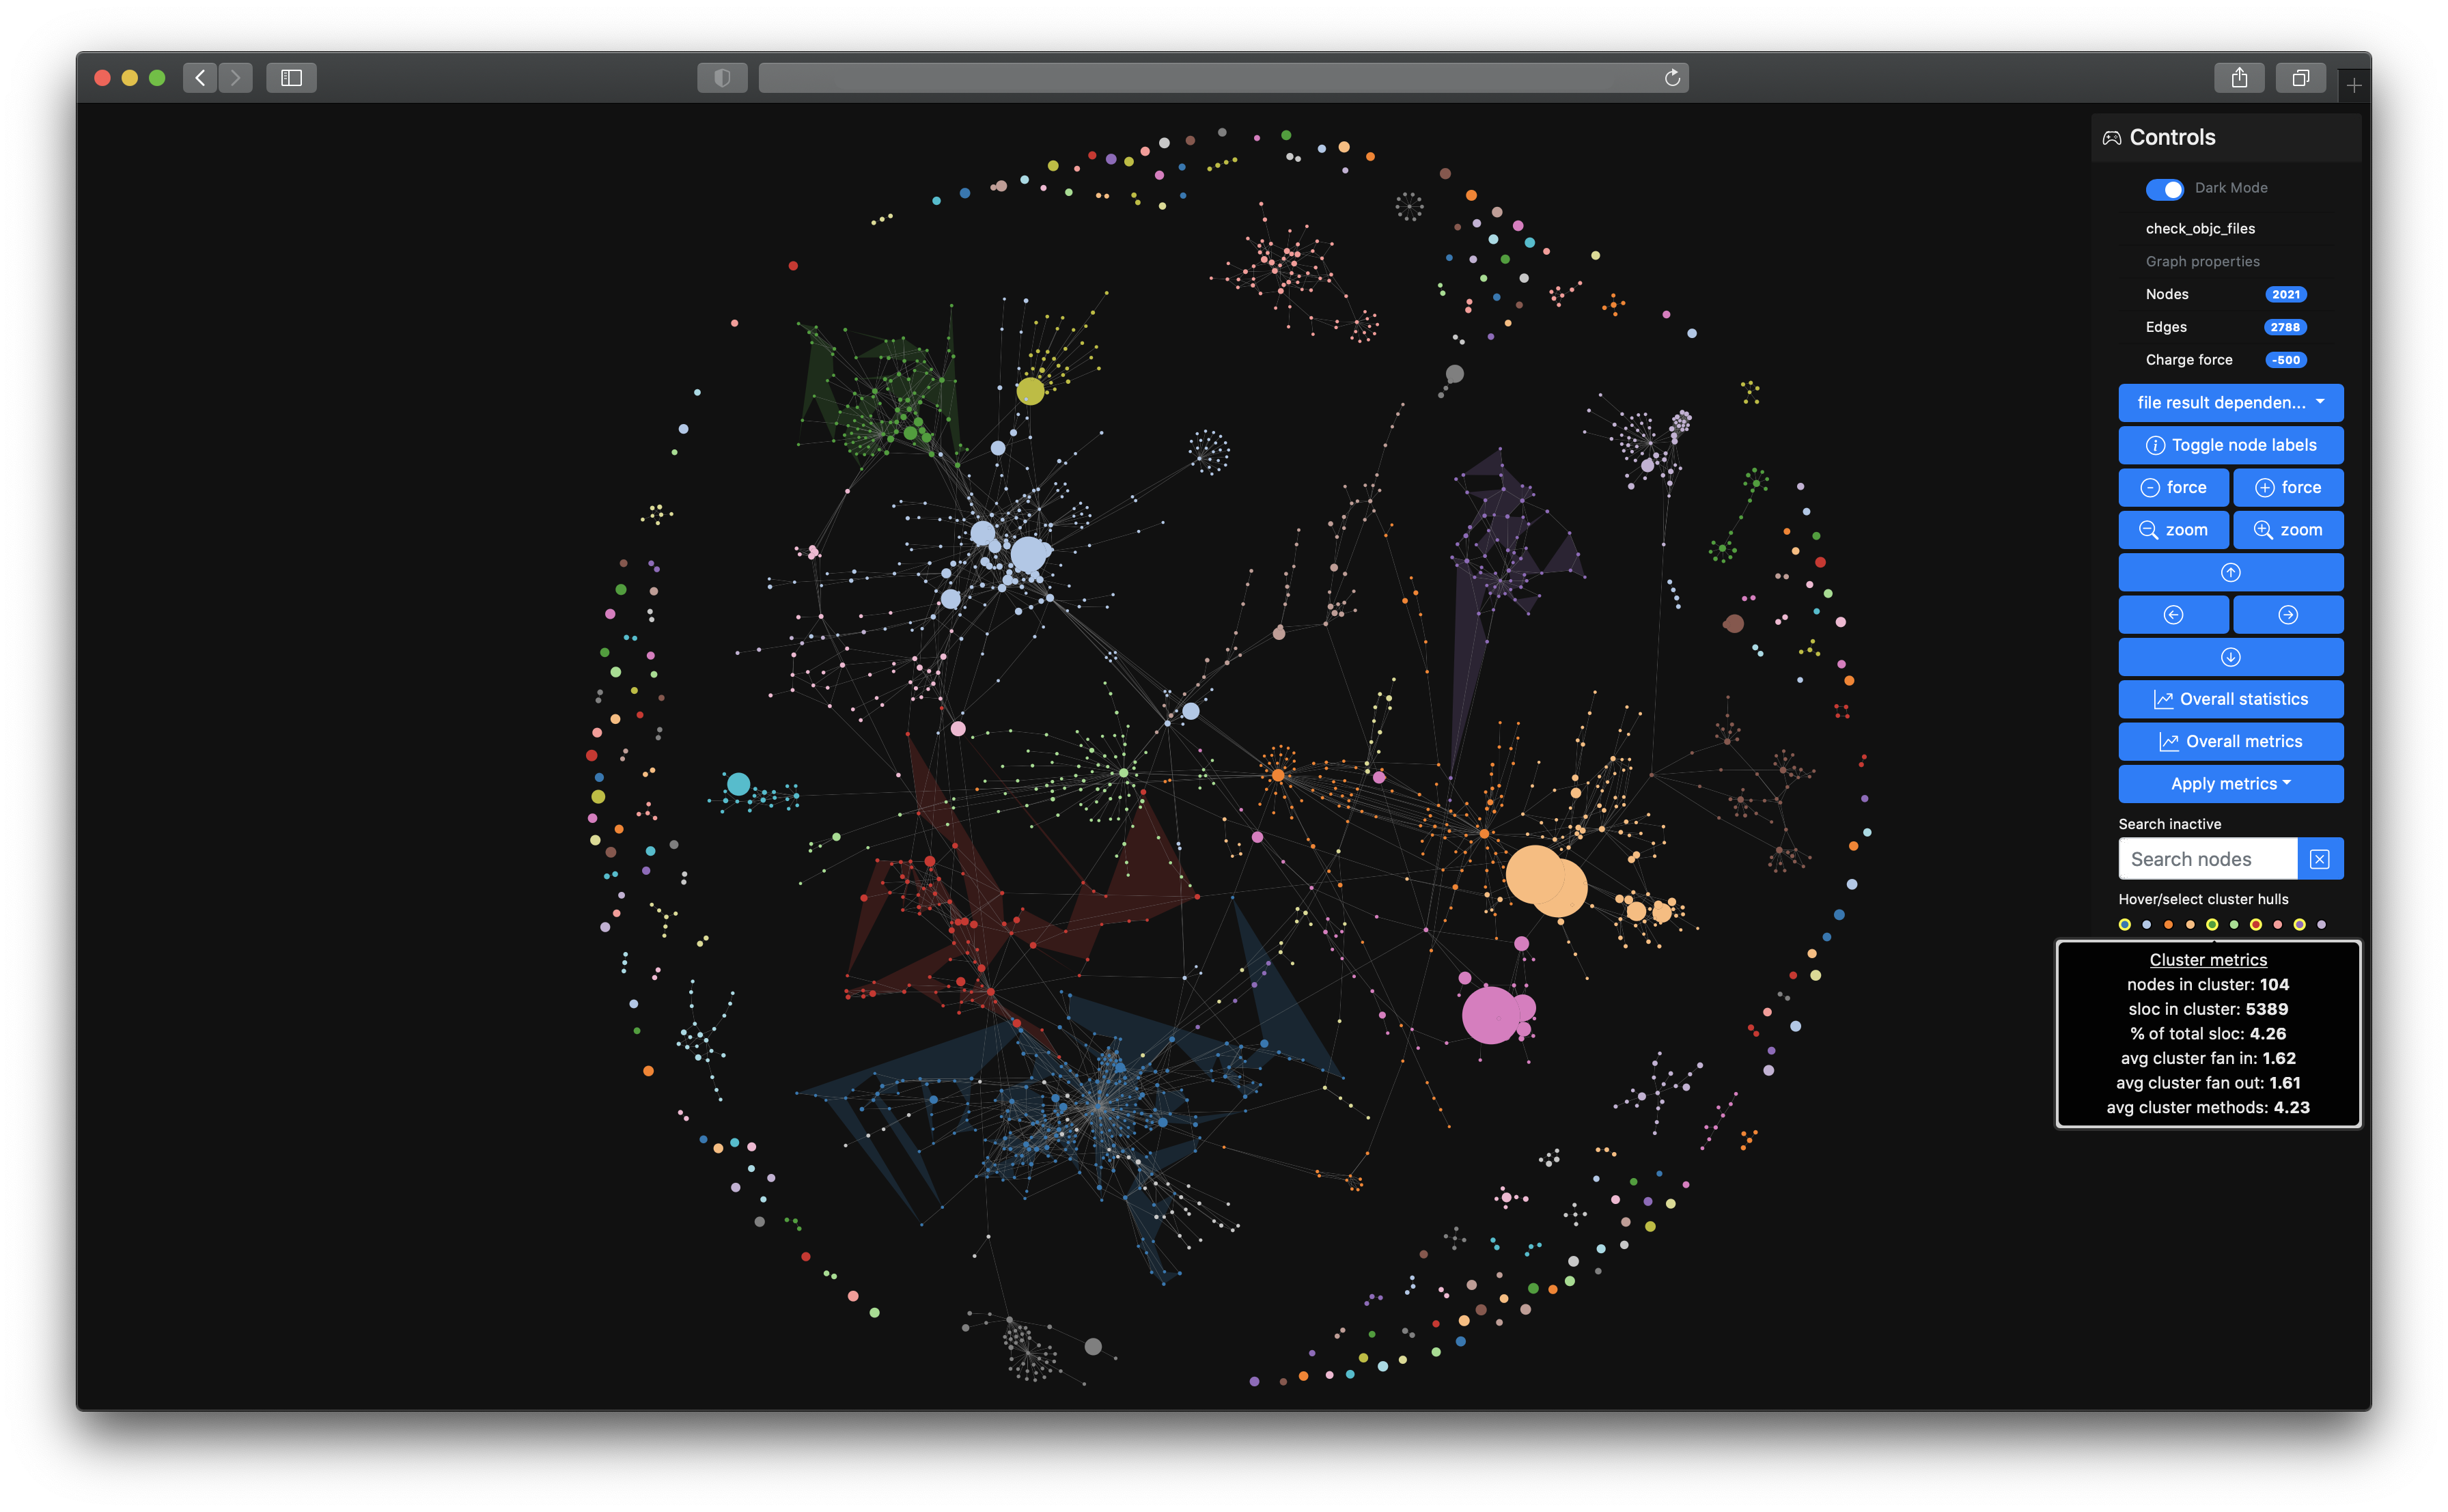
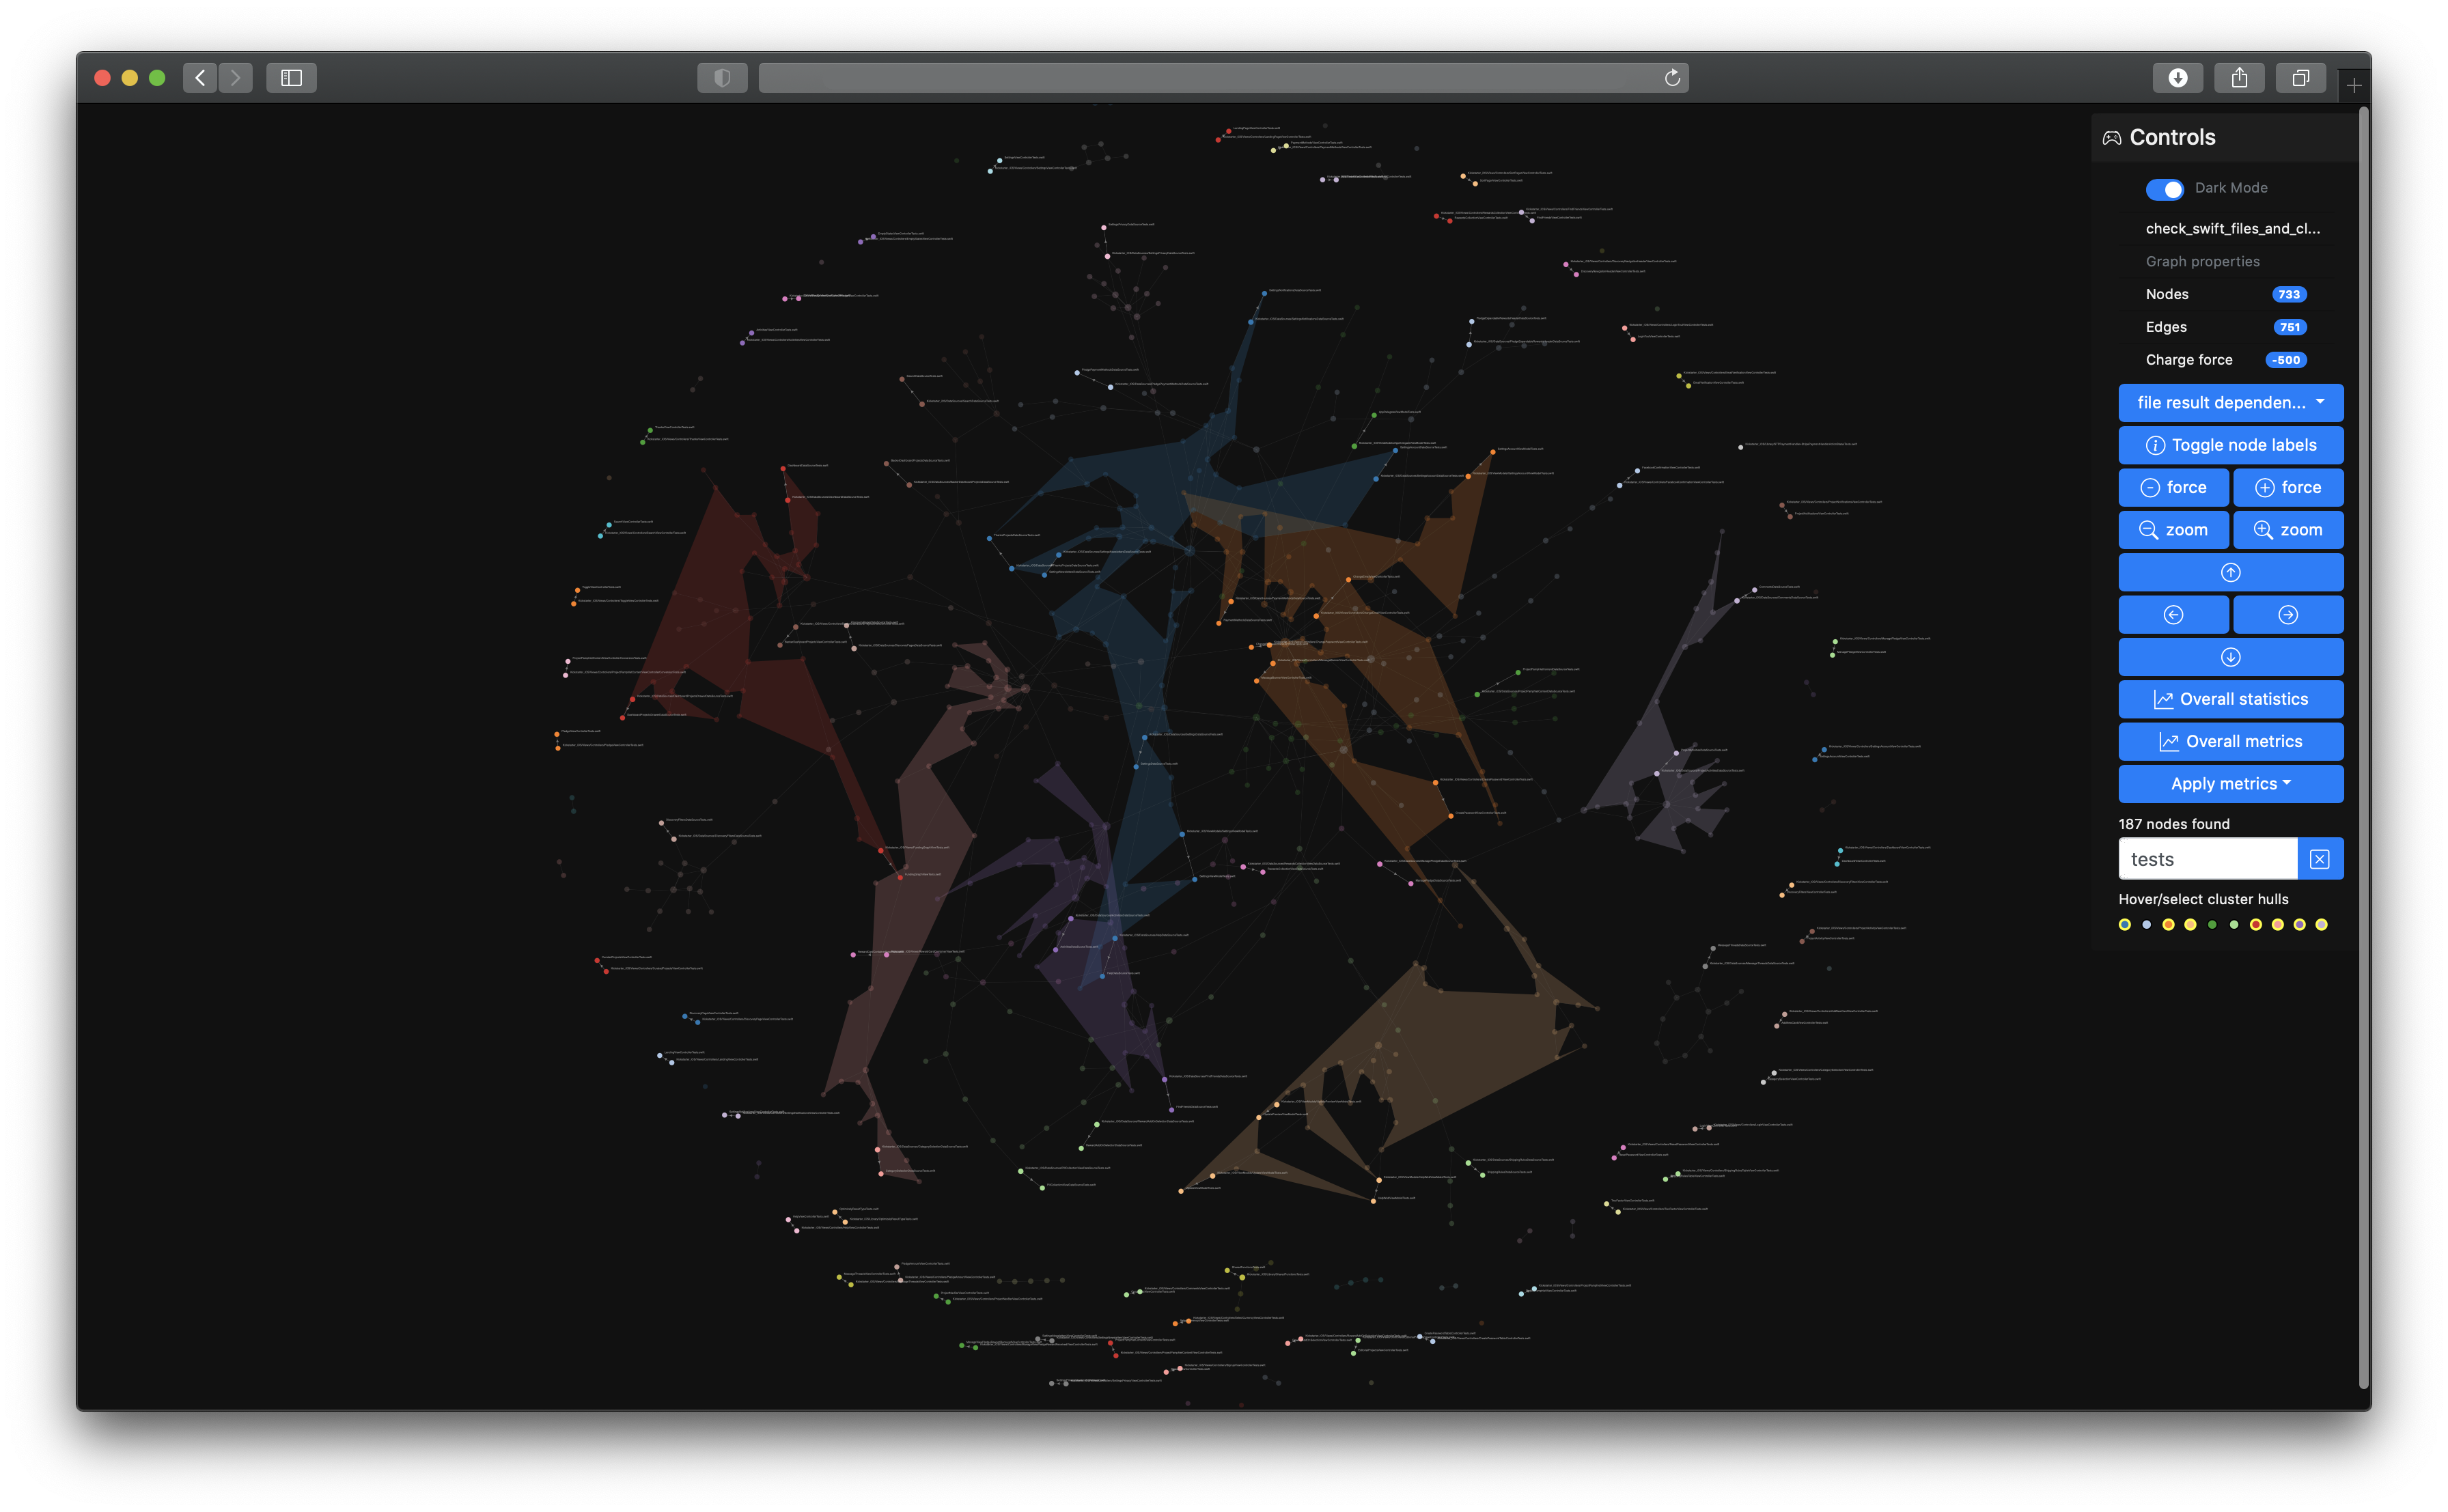
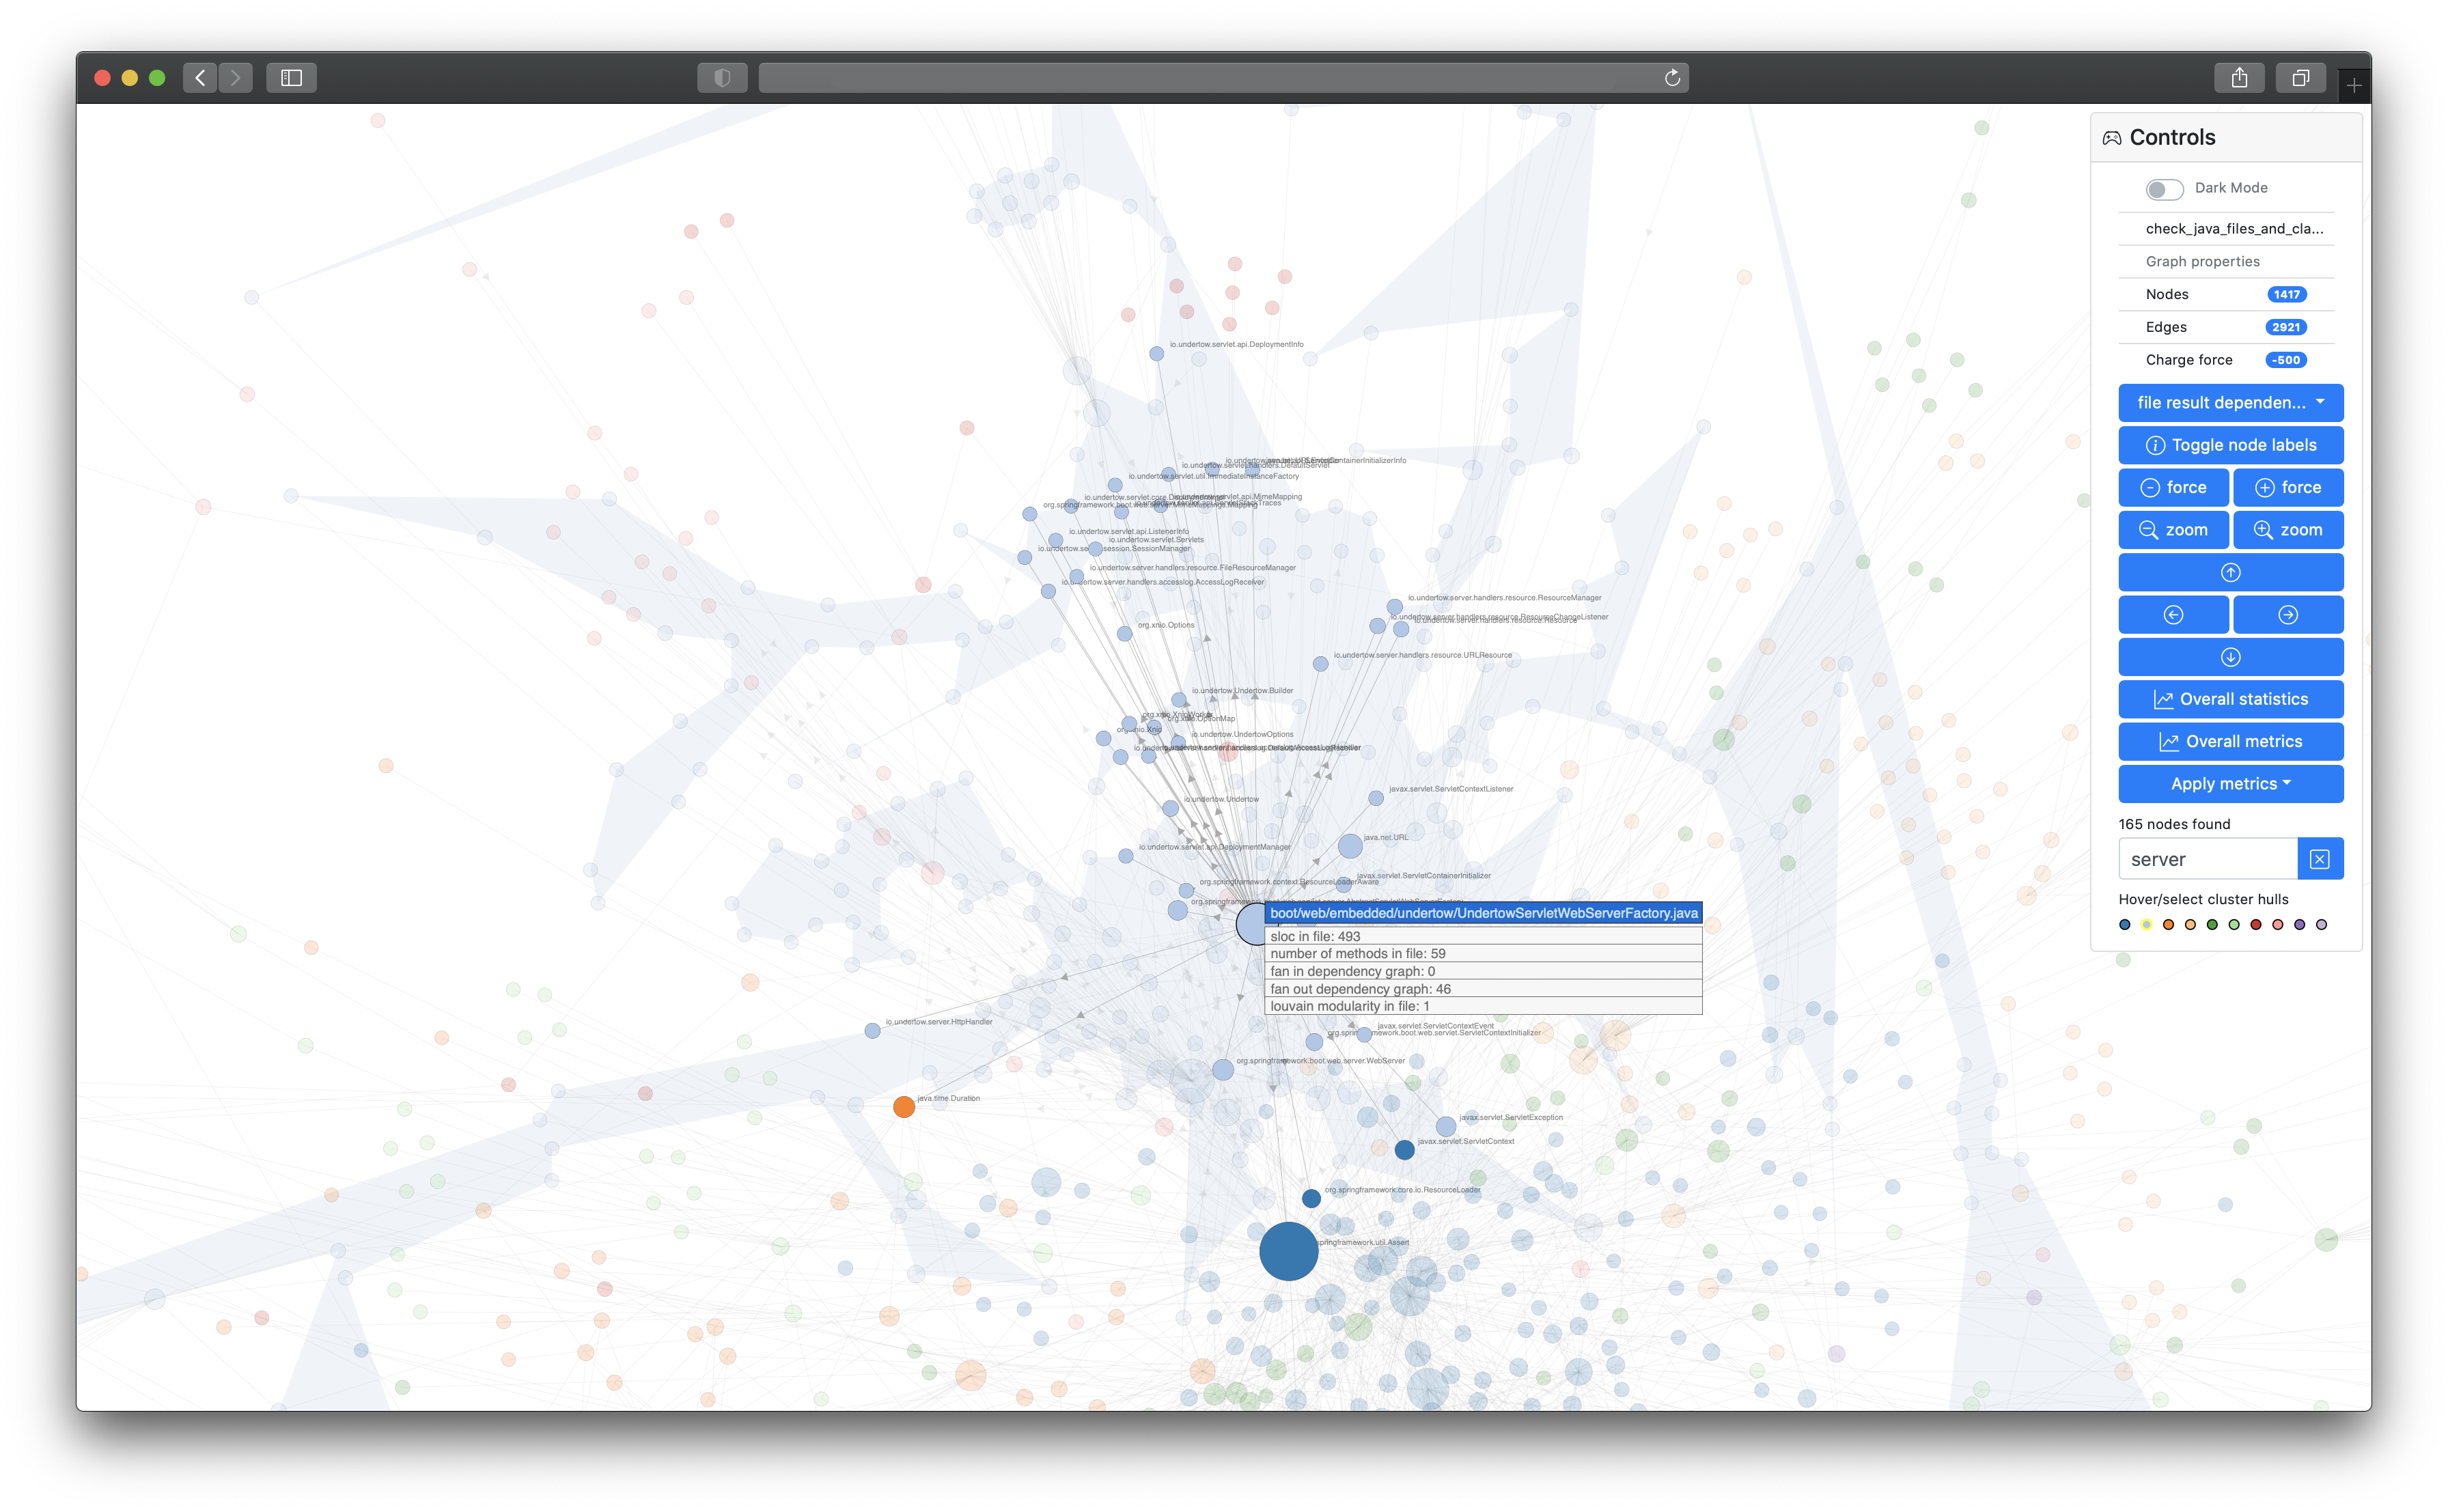
- Interactive HTML/ web application for interactive, exploratory analysis and data visualization of your project based on graph structures
- HTML app is based on Bootstrap
- Force-directed graph simulation by D3
- The node colors are based on Louvain modularity with a bit of post-processing to make the graph coloring more deterministic and stable
- Fast full-screen UI rendering on HTML canvas
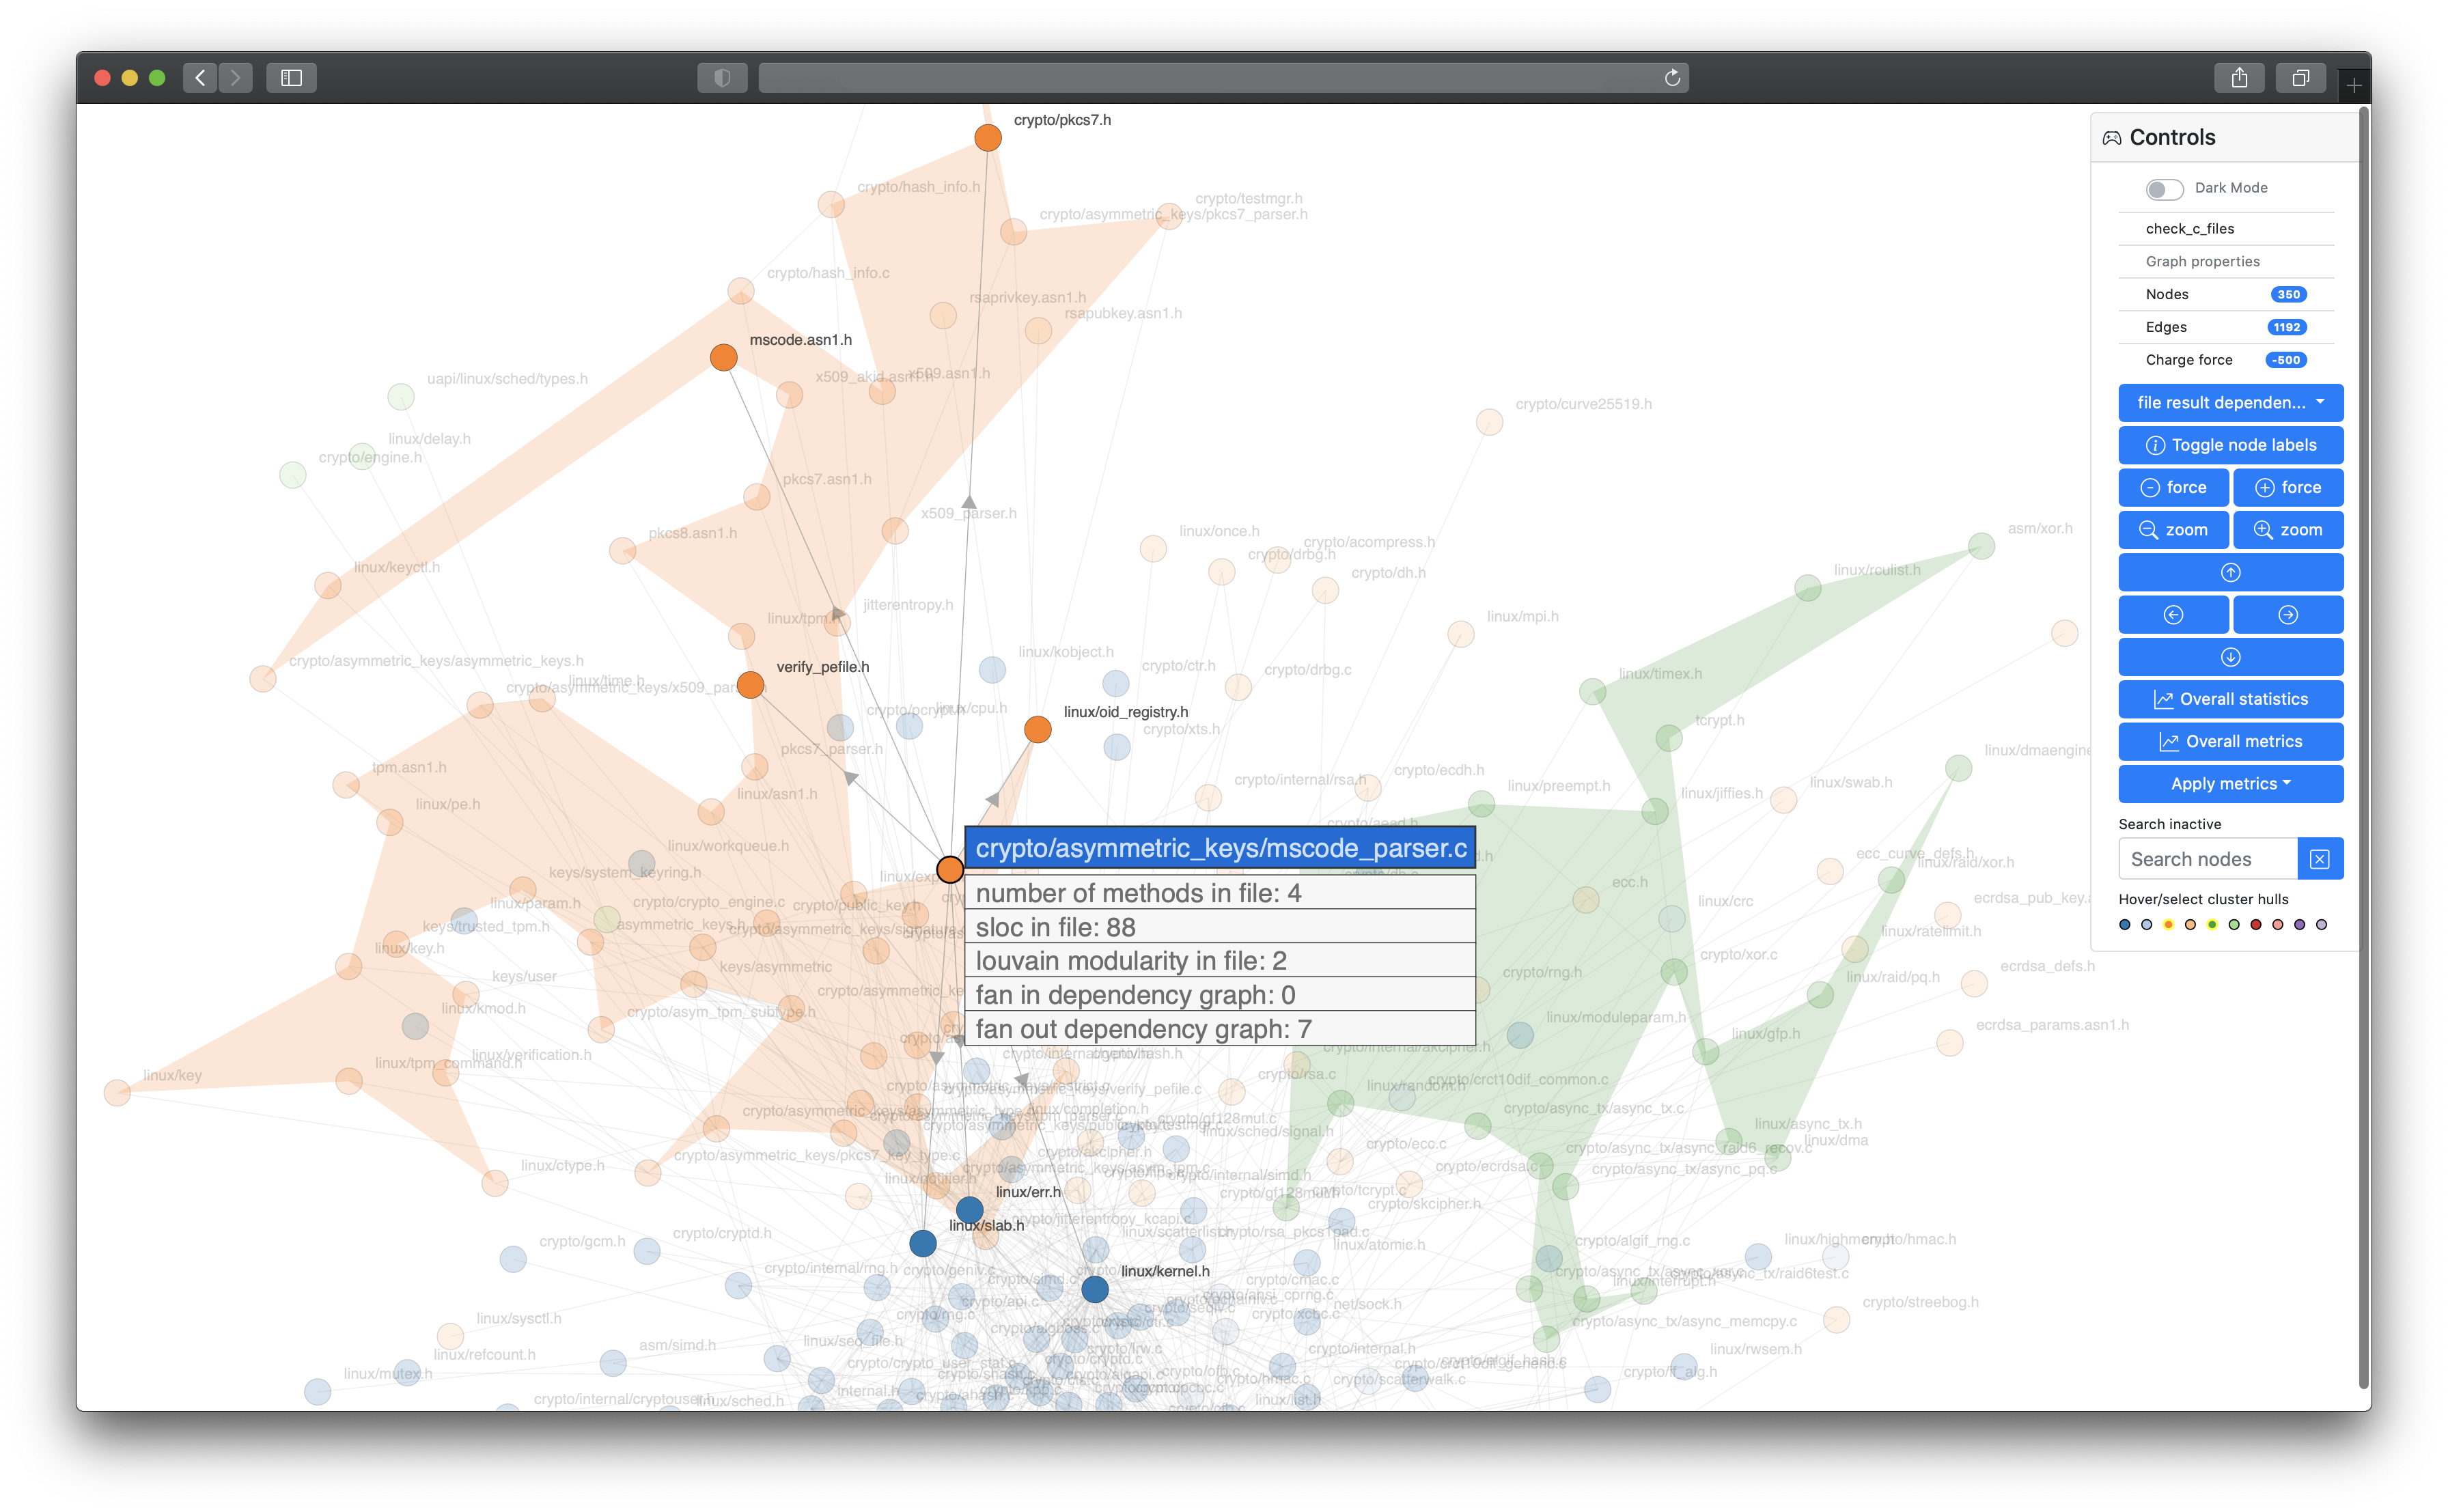
- Visualization of files, entities and given metrics
- dark mode support
- Reactive visual live search of files/ entities (e.g. classes)
- Concave hull visualization of single clusters
- Display of cluster metrics to facilitate comparability
- Interactivity given by translation, zooming, dragging and hovering over nodes
- Tabular console output
- Tabular file output
- JSON file output
At this time there is no simple installation by using pip (tbd), so the following steps should guide you how to install this tool and get it running.
git clone https://github.com/glato/emerge.git
brew install graphviz
Check of you have the latest Python 3 installed on your macOS. I recommend installing/using Python 3 from Homebrew. Create a Python 3 virtual environment (optionally within the project structure)
cd emerge
pip3 install virtualenv
virtualenv -p python3 venv
Install required packages and create a Python 3 virtual environment (optionally within the project structure)
apt-get install python3-venv python3-dev graphviz graphviz-dev
cd emerge
python3 -m venv venv
source venv/bin/activate
Install all required dependencies for the project with pip
pip install -r requirements.txt
Install the wheel package, after that install all required dependencies for the project with pip
pip install wheel
pip install -r requirements.txt
python run_tests.py
python emerge.py
usage: emerge.py [-h] [-c YAMLCONFIG] [-v] [-d] [-s]

Welcome to emerge x.y.z (yyyy-mm-dd hh:mm:ss).

optional arguments:
  -h, --help            show this help message and exit
  -c YAMLCONFIG, --config YAMLCONFIG
                        set yaml config file
  -v, --verbose         set logging level to INFO
  -d, --debug           set logging level to DEBUG
  -s, --silent          run silently without any console output
Let's quickly try to run emerge on its own codebase
python emerge.py -c configs/emerge.yaml
This should produce a similar output:
...   analysis I 👉 starting to analyze emerge
...   analysis I ⏩ performing analysis 1/1: self-check
...   analysis I 👉 starting to create filesystem graph in self-check
...   analysis I ⏩ starting scan at directory: .
...   ...
...   analysis I 👉 the following statistics were collected in self-check
+-------------------------------------+-------------------+
|                      statistic name | value             |
+-------------------------------------+-------------------+
|                    scanning_runtime | 00:00:00 + 61 ms  |
|                       scanned_files | 32                |
|                       skipped_files | 176               |
|                        parsing_hits | 313               |
|                      parsing_misses | 141               |
|              extracted_file_results | 32                |
|       file_results_creation_runtime | 00:00:00 + 538 ms |
|    number-of-methods-metric-runtime | 00:00:00 + 4 ms   |
| source-lines-of-code-metric-runtime | 00:00:00 + 11 ms  |
|   louvain-modularity-metric-runtime | 00:00:00 + 161 ms |
|           fan-in-out-metric-runtime | 00:00:00 + 4 ms   |
|                       total_runtime | 00:00:00 + 786 ms |
+-------------------------------------+-------------------+
...   analysis I 👉 the following overall metrics were collected in self-check
+----------------------------------------------+----------------------------+
|                                  metric name | value                      |
+----------------------------------------------+----------------------------+
|                avg-number-of-methods-in-file | 13.0                       |
|                             avg-sloc-in-file | 151.41                     |
|                          total-sloc-in-files | 4845                       |
|         louvain-communities-dependency-graph | 3                          |
|          louvain-modularity-dependency-graph | 0.21                       |
| louvain-biggest-communities-dependency-graph | 0.49, 0.46, 0.05, 0.0, 0.0 |
|                  avg-fan-in-dependency-graph | 5.55                       |
|                 avg-fan-out-dependency-graph | 5.55                       |
|                  max-fan-in-dependency-graph | 29                         |
|             max-fan-in-name-dependency-graph | typing                     |
|                 max-fan-out-dependency-graph | 19                         |
|            max-fan-out-name-dependency-graph | emerge/appear.py           |
+----------------------------------------------+----------------------------+
...   analysis I ✅ all your generated/exported data can be found here: /Volumes/projects/private/github/emerge/export/emerge
...   analysis I ✅ copy the following path to your browser and start your web app: file:///Users/user1/github/emerge/export/emerge/force-graph-html/d3-force-graph-template.html
...   analysis I ✅ total runtime of analysis: 00:00:00 + 786 ms
Now just copy the above mentioned file:// path to any modern web browser and interactively expore the emerge codebase 😉
And now let's make this more interesting ...
If you wand to use emerge on other projects, you can simple copy or customize one of the existing configuration templates from the emerge/configs directory.
For a quick run, it should be enough to adjust source_directory, directory in export.
---
project_name: c-example-project
loglevel: info
analyses:
- analysis_name: check_c_files
  source_directory: /Users/user1/emerge/project/source/github/linux-5.8.5/crypto
  only_permit_languages:
  - c
  only_permit_file_extensions:
  - .c
  - .h
  ignore_dependencies_containing:
  - string.h
  file_scan:
  - number_of_methods
  - source_lines_of_code
  - dependency_graph
  - louvain_modularity
  - fan_in_out
  export:
  - directory: /Users/user1/emerge/project/export
  - graphml
  - dot
  - json
  - tabular_file
  - tabular_console_overall
- d3After customizing a present config (e.g. config/c-template.yaml) or creating your own, just run emerge again with this new config
python emerge.py -c configs/c-template.yamlAfter the scan, your scan output (including your interactive web app) can be found at the directory that you created and set in the config parameter export -> directory, as seen in the logs above.
A full YAML configuration that contains both file and entity scan has the following format:
---
project_name: java_project_example
loglevel: info
analyses:
- analysis_name: check_java_files_and_classes
  source_directory: /Users/user1/emerge/project/source
  only_permit_languages:
  - java
  only_permit_file_extensions:
  - .java
  ignore_dependencies_containing:
  - java.util
  file_scan:
  - number_of_methods
  - source_lines_of_code
  - dependency_graph
  - fan_in_out
  - louvain_modularity
  entity_scan:
  - dependency_graph
  - source_lines_of_code
  - number_of_methods
  - fan_in_out
  - louvain_modularity
  export:
  - directory: /Users/user1/emerge/project/export
  - graphml
  - dot
  - json
  - tabular_file
  - tabular_console_overall
  - d3
The yaml configuration is basically defined at the following levels:
| key | value/ description |
|---|---|
project_name |
a project name for all analyses, scans and exports |
loglevel |
set a loglevel: error (silent, only errors), info (includes error) gives you basic logs about control flow, debug (includes info) will produce a lot of debug logs |
analyses |
an array of analyses that can be configured individually, thus a project can contain one to many analyses. |
| key | value/ description |
|---|---|
analysis_name |
a specific analysis name |
source_directory |
the source directory where the recursive file scan should start |
ignore_files_containing |
exclude file names from the scan that contain the given substrings |
ignore_directories_containing |
exclude directory names from the scan that contain the given substrings |
only_permit_languages |
possible values include: java, kotlin, objc, swift, ruby, groovy, javascript, c - explicitly prevents any other language from scanning besides the one you set here |
only_permit_file_extensions |
explicitly permit the following file extensions you set here, e.g. .java |
ignore_dependencies_containing |
ignore every dependency included in this list of substrings, e.g. java.util |
file_scan |
perform a file scan, contains the metrics that should be applied on every source file |
entity_scan |
perform an entity scan, contains the metrics that should be applied on every entity (e.g. on every class) |
export |
contains any export formats that should be create as output |
| key | value/ description |
|---|---|
dependency_graph |
create a dependency graph structure based on source files, additional metrics will be added to the graph nodes |
source_lines_of_code |
apply a source lines of code metric to every file, create an overall metric |
number_of_methods |
apply a number of methods metric to every file, create an overall metric |
fan_in_out |
apply a fan in/ fan out graph metric to every file, create an overall metric |
louvain_modularity |
apply a louvain modularity metric to every file, create an overall metric |
| key | value/ description |
|---|---|
dependency_graph |
create a dependency graph structure based on extracted entities from files, additional metrics will be added to the graph nodes |
inheritance_graph |
create an inheritance graph structure based on extracted entities from files, additional metrics will be added to the graph nodes |
complete_graph |
create a complete graph structure (union of dependency/ inheritance graph) based on extracted entities from files, additional metrics will be added to the graph nodes |
source_lines_of_code |
apply a source lines of code metric to every entity, create an overall metric |
number_of_methods |
apply a number of methods metric to every entity, create an overall metric |
fan_in_out |
apply a fan in/ fan out graph metric to every entity, create an overall metric |
louvain_modularity |
apply a louvain modularity metric to every entity, create an overall metric |
| key | value/ description |
|---|---|
directory |
the output directory for all specified export formats |
graphml |
create a graphML file that contains the graph structure and metric results mapped to the nodes of the graph |
tabular_file |
create a tabular formatted text file that contains every metric and statistic result |
tabular_console |
print a tabular formatted output to console that contains every metric and statistic result |
tabular_console_overall |
print a tabular formatted output to console that contains only overall metric and statistic results |
json |
create a JSON file that contains every metric and statistic result |
dot |
create a DOT file that contains the graph structure and metric results mapped to the nodes of the graph |
d3 |
create a Bootstrap/D3 web application in the subfolder force-graph-html for further visual and interactive/ exploratory analysis |
| Parsing | Groovy | Java | Kotlin | Swift | Ruby | JS | TS | ObjC | C/C++ | Python |
|---|---|---|---|---|---|---|---|---|---|---|
| Files | ✅ | ✅ | ✅ | ✅ | ✅ | ✅ | ✅ | ✅ | ✅ | ✅ |
| Entities | ✅ | ✅ | ✅ | ✅ | ❌ | ❌ | ❌ | ❌ | ❌ | ❌ |
- Parsing of further entity types for more languages is planned for further development. Contributions are welcome 👍
- Disclaimer: The current version (0.18.3) is not yet stable, probably still has some 🐞 and is probably not yet suited for productive usage.
- Everyone is invited to contribute to this project, whether the contribution is related with development, testing, bug reporting or any other support. I would appreciate any help 👍. See Contributing and Credits for further details.


