eth2-grafana
Here you can find dashboards for Ethereum 2 staking systems to allow you to monitor your staking hardware, software, and earnings. Each dashboard is specific to the Ethereum 2 client it serves, due to differences in available metrics.
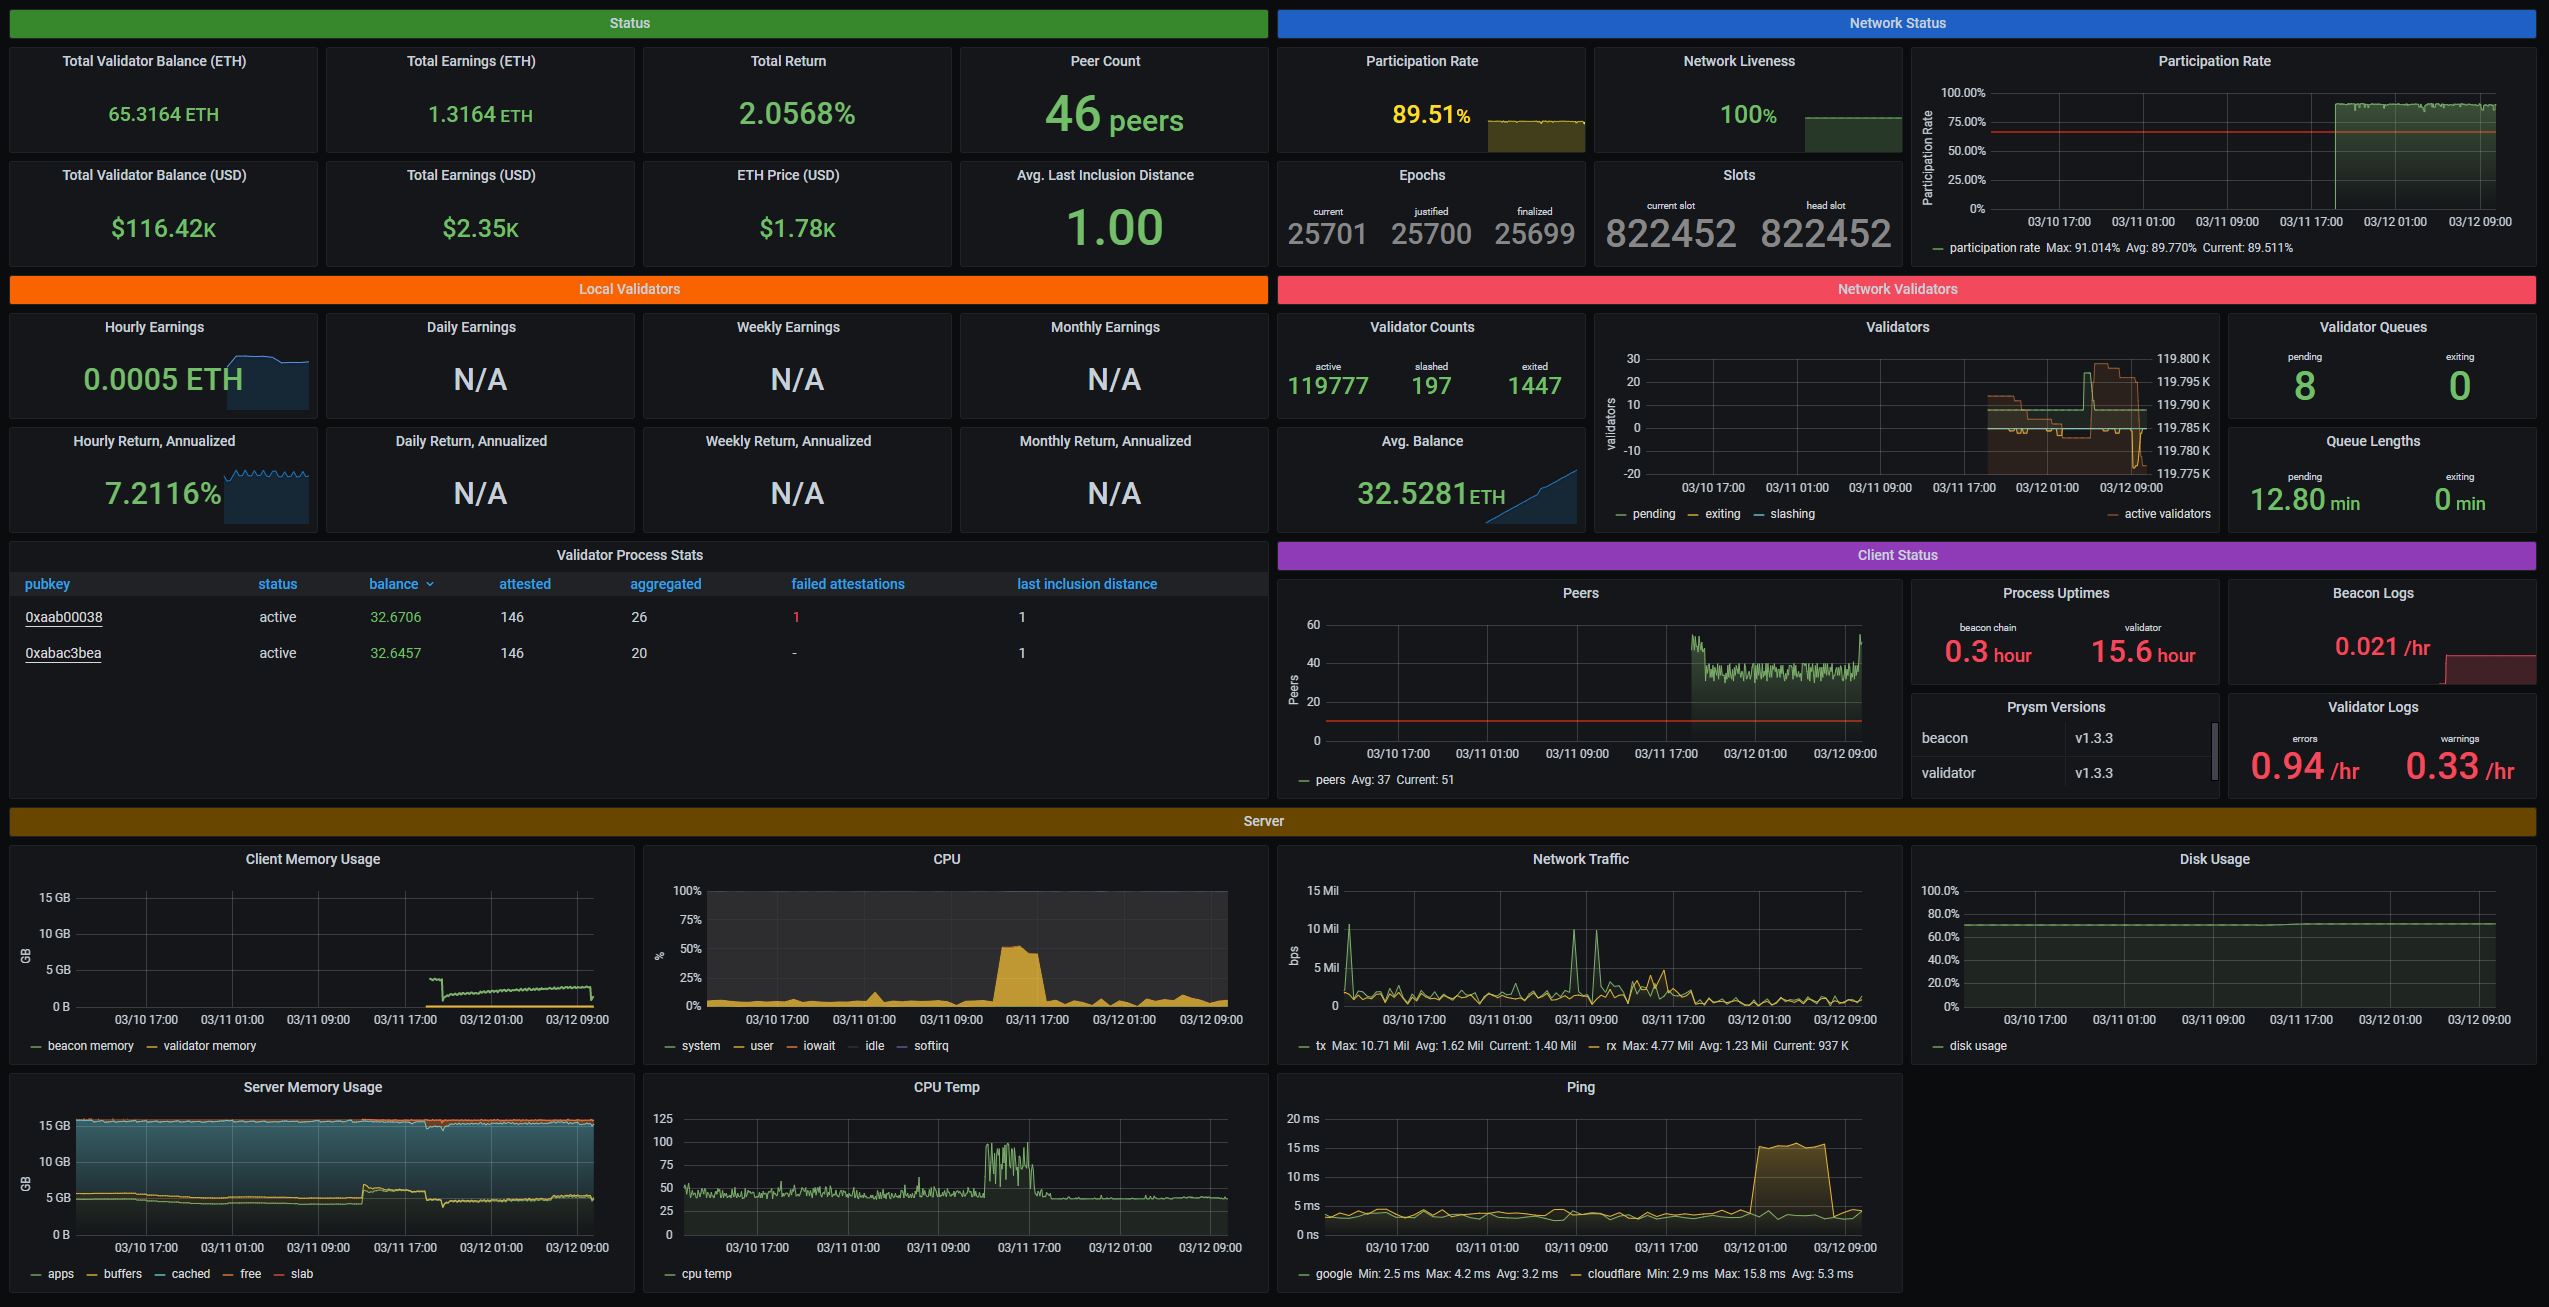
This document covers a staking dashboard for Prysmatic Labs Prysm. Other dashboards are presently available as follows:
Prysmatic Labs Prysm Dashboard
Host stats require node_exporter, ping stats require blackbox_exporter, and ETH price requires blackbox_exporter. Panels requiring these modules can be manually removed from the dashboard after installation if you choose not to install these additional components.
High Level Installation
This installation assumes that you are running Prysm, Grafana, Prometheus, node_exporter, blackbox_exporter, and json_exporter on the same system, and that only default ports are used.
- Install node_exporter if you would like to see system information, such as CPU utilization, memory use, CPU temperature, disk usage, and network traffic.
- If you would like to see ping (network latency) information, install blackbox_exporter using the following configuration file.
modules:
        icmp:
                prober: icmp
                timeout: 10s
                icmp:
                        preferred_ip_protocol: ipv4
- Install go
- Install json_exporter if you would like to see ETH price information. Use the following configuration file.
modules:
  default:
    metrics:
    - name: ethusd
      path: "{.ethereum.usd}"
      help: Ethereum (ETH) price in USD
- Install Prometheus using the following configuration file.
global:
  scrape_interval: 15s

scrape_configs:
  - job_name: 'prometheus'
    scrape_interval: 5s
    static_configs:
    - targets: ['127.0.0.1:9090']
  - job_name: 'beacon node'
    scrape_interval: 5s
    static_configs:
    - targets: ['127.0.0.1:8080']
  - job_name: 'node_exporter'
    scrape_interval: 5s
    static_configs:
    - targets: ['127.0.0.1:9100']
  - job_name: 'validator'
    scrape_interval: 5s
    static_configs:
    - targets: ['127.0.0.1:8081']
  - job_name: 'ping_google'
    metrics_path: /probe
    params:
      module: [icmp]
    static_configs:
      - targets:
        - 8.8.8.8
    relabel_configs:
      - source_labels: [__address__]
        target_label: __param_target
      - source_labels: [__param_target]
        target_label: instance
      - target_label: __address__
        replacement: 127.0.0.1:9115  # The blackbox exporter's real hostname:port.
  - job_name: 'ping_cloudflare'
    metrics_path: /probe
    params:
      module: [icmp]
    static_configs:
      - targets:
        - 1.1.1.1
    relabel_configs:
      - source_labels: [__address__]
        target_label: __param_target
      - source_labels: [__param_target]
        target_label: instance
      - target_label: __address__
        replacement: 127.0.0.1:9115  # The blackbox exporter's real hostname:port.
  - job_name: json_exporter
    static_configs:
    - targets:
      - 127.0.0.1:7979
  - job_name: json
    metrics_path: /probe
    static_configs:
    - targets:
      - https://api.coingecko.com/api/v3/simple/price?ids=ethereum&vs_currencies=usd
    relabel_configs:
    - source_labels: [__address__]
      target_label: __param_target
    - source_labels: [__param_target]
      target_label: instance
    - target_label: __address__
      replacement: 127.0.0.1:7979
- Install Grafana.
- Login to Grafana and add
http://XXX.XXX.XXX.XXX:9090/as a Prometheus data source. - Add the Prysm dashboard to Grafana.
Detailed Ubuntu 20.04 Installation
Adapted from my instructions for setting up a Prysm staking system on Ubuntu 20.04.
Prometheus
Create User Account
sudo adduser --system prometheus --group --no-create-homeInstall Prometheus
Find the URL to the latest amd64 version of Prometheus at https://prometheus.io/download/. In the commands below, replace any references to the version 2.26.0 to the latest version available.
cd
wget https://github.com/prometheus/prometheus/releases/download/v2.26.0/prometheus-2.26.0.linux-amd64.tar.gz
tar xzvf prometheus-2.26.0.linux-amd64.tar.gz
cd prometheus-2.26.0.linux-amd64
sudo cp promtool /usr/local/bin/
sudo cp prometheus /usr/local/bin/
sudo chown root:root /usr/local/bin/promtool /usr/local/bin/prometheus
sudo chmod 755 /usr/local/bin/promtool /usr/local/bin/prometheus
cd
rm prometheus-2.26.0.linux-amd64.tar.gz
Configure Prometheus
Create directories that prometheus will be expecting to find.
sudo mkdir -p /etc/prometheus/console_libraries /etc/prometheus/consoles /etc/prometheus/files_sd /etc/prometheus/rules /etc/prometheus/rules.dCreate the prometheus configuration files. Open a new configuration file.
sudo nano /etc/prometheus/prometheus.ymlCopy and paste the following text into the prometheus.yml configuration file:
global:
  scrape_interval: 15s

scrape_configs:
  - job_name: 'prometheus'
    scrape_interval: 5s
    static_configs:
    - targets: ['127.0.0.1:9090']
  - job_name: 'beacon node'
    scrape_interval: 5s
    static_configs:
    - targets: ['127.0.0.1:8080']
  - job_name: 'node_exporter'
    scrape_interval: 5s
    static_configs:
    - targets: ['127.0.0.1:9100']
  - job_name: 'validator'
    scrape_interval: 5s
    static_configs:
    - targets: ['127.0.0.1:8081']
  - job_name: 'ping_google'
    metrics_path: /probe
    params:
      module: [icmp]
    static_configs:
      - targets:
        - 8.8.8.8
    relabel_configs:
      - source_labels: [__address__]
        target_label: __param_target
      - source_labels: [__param_target]
        target_label: instance
      - target_label: __address__
        replacement: 127.0.0.1:9115  # The blackbox exporter's real hostname:port.
  - job_name: 'ping_cloudflare'
    metrics_path: /probe
    params:
      module: [icmp]
    static_configs:
      - targets:
        - 1.1.1.1
    relabel_configs:
      - source_labels: [__address__]
        target_label: __param_target
      - source_labels: [__param_target]
        target_label: instance
      - target_label: __address__
        replacement: 127.0.0.1:9115  # The blackbox exporter's real hostname:port.
  - job_name: json_exporter
    static_configs:
    - targets:
      - 127.0.0.1:7979
  - job_name: json
    metrics_path: /probe
    static_configs:
    - targets:
      - https://api.coingecko.com/api/v3/simple/price?ids=ethereum&vs_currencies=usd
    relabel_configs:
    - source_labels: [__address__]
      target_label: __param_target
    - source_labels: [__param_target]
      target_label: instance
    - target_label: __address__
      replacement: 127.0.0.1:7979
Note: Users of earlier versions of these instructions may have the beacon node job name set to "beacon" instead of "beacon node". When choosing a Grafana dashboard from this repository, please select this dashboard if you are using "beacon" as the job name, and this dashboard if you are using "beacon node" as the job name.
Change the ownership of the prometheus configuration directory to the prometheus user.
sudo chown -R prometheus:prometheus /etc/prometheusData Directory
Make a directory for prometheus files, owned by the prometheus user account, and with appropriate privileges.
sudo mkdir /var/lib/prometheus
sudo chown prometheus:prometheus /var/lib/prometheus
sudo chmod 755 /var/lib/prometheus
Set Up systemd Service
Set up systemd to automatically start Prometheus. It will also restart the software if it stops.
sudo nano /etc/systemd/system/prometheus.serviceCopy and paste the following text into the prometheus.service file.
[Unit]
Description=Prometheus
Wants=network-online.target
After=network-online.target

[Service]
User=prometheus
Group=prometheus
Type=simple
Restart=always
RestartSec=5
ExecStart=/usr/local/bin/prometheus \
    --config.file /etc/prometheus/prometheus.yml \
    --storage.tsdb.path /var/lib/prometheus/ \
    --web.console.templates=/etc/prometheus/consoles \
    --web.console.libraries=/etc/prometheus/console_libraries \
    --storage.tsdb.retention.time=32d
[Install]
WantedBy=multi-user.target
Reload the systemd service file configurations, start prometheus, then enable the prometheus service to have it start automatically on reboot.
sudo systemctl daemon-reload
sudo systemctl start prometheus.service
sudo systemctl enable prometheus.service
Grafana
Setup and install Grafana using apt-get.
cd
sudo apt-get install -y apt-transport-https
sudo apt-get install -y software-properties-common wget
wget -q -O - https://packages.grafana.com/gpg.key | sudo apt-key add -
sudo add-apt-repository "deb https://packages.grafana.com/oss/deb stable main"
sudo apt-get update
sudo apt-get install grafana
Setup systemd
Reload the systemd service file configurations, start Grafana, then enable the Grafana service to have it start automatically on reboot.
sudo systemctl daemon-reload
sudo systemctl start grafana-server
sudo systemctl enable grafana-server
Login to Grafana at http://XXX.XXX.XXX.XXX:3000/, replacing XXX.XXX.XXX.XXX with the IP address of your server. If you do not know the IP address, run ifconfig.
Default username admin. Default password admin. Grafana will ask you to set a new password.
Setup Prometheus Data Source
- On the left-hand menu, hover over the gear menu and click on Data Sources.
- Then click on the Add Data Source button.
- Hover over the Prometheus card on screen, then click on the Select button.
- Enter
http://127.0.0.1:9090/into the URL field, then click Save & Test.
Install Grafana Dashboard
- Hover over the plus symbol icon in the left-hand menu, then click on Import.
- Copy and paste the dashboard at https://raw.githubusercontent.com/metanull-operator/eth2-grafana/master/eth2-grafana-dashboard-single-source-beacon_node.json into the "Import via panel json" text box on the screen. If you used an older version of these instructions, where the Prometheus configuration file uses the beacon node job name of "beacon" instead of "beacon node", please use this dashboard instead for backwards compatibility.
- Then click the Load button.
- Then click the Import button.
Note: Some panels will not display data until all required software is running. Various portions of this dashboard are directly or indirectly dependent on Prometheus, Prysm beacon chain, Prysm validator, node_exporter, and blackbox exporter.
Final Grafana Dashboard Configuration
A few of the queries driving the Grafana dashboard may need different settings, depending on your hardware.
Network Traffic Configuration
To ensure that network traffic is correctly reflected on your Grafana dashboard, update the network interface in the Network Traffic widget. Run the following command to find your Linux network device.
ifconfigOutput of the command should look like the following:
eno1: flags=4163<UP,BROADCAST,RUNNING,MULTICAST>  mtu 1500
        inet 192.168.1.10  netmask 255.255.255.0  broadcast 192.168.1.255
        inet6 fe80::1e69:7aff:fe63:14b0  prefixlen 64  scopeid 0x20<link>
        ether 1c:69:7a:63:14:b0  txqueuelen 1000  (Ethernet)
        RX packets 238936  bytes 78487335 (78.4 MB)
        RX errors 0  dropped 1819  overruns 0  frame 0
        TX packets 257824  bytes 112513038 (112.5 MB)
        TX errors 0  dropped 0 overruns 0  carrier 0  collisions 0
        device interrupt 16  memory 0x96300000-96320000

lo: flags=73<UP,LOOPBACK,RUNNING>  mtu 65536
        inet 127.0.0.1  netmask 255.0.0.0
        inet6 ::1  prefixlen 128  scopeid 0x10<host>
        loop  txqueuelen 1000  (Local Loopback)
        RX packets 39805  bytes 29126770 (29.1 MB)
        RX errors 0  dropped 0  overruns 0  frame 0
        TX packets 39805  bytes 29126770 (29.1 MB)
        TX errors 0  dropped 0 overruns 0  carrier 0  collisions 0
Of the two entries shows above, the first lists my IP address on the second line, network interface eno1. Find the entry that represents the network connection you want to monitor and copy the device name, which is the part before the colon on the first line of each entry. In my case the value is eno1.
- Go to the Grafana dashboard previously installed
- Find the Network Traffic widget, and open the drop down that can be found by the Network Traffic title.
- Click Edit.
- There will be four references to
eno1in the queries that appear. Replace all four with the name of the network interface you found in theifconfigcommand.
node_exporter
Node exporter allows Prometheus to record system data, such as CPU utilization, memory use, CPU temperature, and disk usage.
Setup and install node_exporter using apt-get.
Create User Account
sudo adduser --system node_exporter --group --no-create-homeInstall node_exporter
cd
wget https://github.com/prometheus/node_exporter/releases/download/v1.1.2/node_exporter-1.1.2.linux-amd64.tar.gz
tar xzvf node_exporter-1.1.2.linux-amd64.tar.gz
sudo cp node_exporter-1.1.2.linux-amd64/node_exporter /usr/local/bin/
sudo chown node_exporter:node_exporter /usr/local/bin/node_exporter
rm node_exporter-1.1.2.linux-amd64.tar.gz
Set Up System Service
Set up systemd to automatically start node_exporter. It will also restart the software if it stops.
sudo nano /etc/systemd/system/node_exporter.serviceCopy and paste the following text into the node_exporter.service file.
[Unit]
Description=Node Exporter

[Service]
Type=simple
Restart=always
RestartSec=5
User=node_exporter
ExecStart=/usr/local/bin/node_exporter

[Install]
WantedBy=multi-user.target
Reload the systemd service file configurations, start node_exporter, then enable the node_exporter service to have it start automatically on reboot.
sudo systemctl daemon-reload
sudo systemctl start node_exporter.service
sudo systemctl enable node_exporter.service
json_exporter
Install go
sudo apt-get install golang-1.14-go

# Create a symlink from /usr/bin/go to the new go installation
sudo ln -s /usr/lib/go-1.14/bin/go /usr/bin/go
Install git
sudo apt-get install gitCreate User Account
sudo adduser --system json_exporter --group --no-create-homeInstall json_exporter
cd
git clone https://github.com/prometheus-community/json_exporter.git
cd json_exporter
make build
sudo cp json_exporter /usr/local/bin/
sudo chown json_exporter:json_exporter /usr/local/bin/json_exporter
Configure json_exporter
Create a directory for the json_exporter configuration file, and make it owned by the json_exporter account.
sudo mkdir /etc/json_exporter
sudo chown json_exporter:json_exporter /etc/json_exporter
Edit the json_exporter configuration file.
sudo nano /etc/json_exporter/json_exporter.ymlCopy and paste the following text into the json_exporter.yml file.
modules:
  default:
    metrics:
    - name: ethusd
      path: "{.ethereum.usd}"
      help: Ethereum (ETH) price in USD
Change ownership of the configuration file to the json_exporter account.
sudo chown json_exporter:json_exporter /etc/json_exporter/json_exporter.ymlSet Up System Service
Set up systemd to automatically start json_exporter. It will also restart the software if it stops.
sudo nano /etc/systemd/system/json_exporter.serviceCopy and paste the following text into the json_exporter.service file.
[Unit]
Description=JSON Exporter

[Service]
Type=simple
Restart=always
RestartSec=5
User=json_exporter
ExecStart=/usr/local/bin/json_exporter --config.file /etc/json_exporter/json_exporter.yml

[Install]
WantedBy=multi-user.target
Reload the systemd service file configurations, start node_exporter, then enable the json_exporter service to have it start automatically on reboot.
sudo systemctl daemon-reload
sudo systemctl start json_exporter.service
sudo systemctl enable json_exporter.service
Optional
blackbox_exporter
I use blackbox_exporter to provide ping (network latency) data between my staking system and two DNS providers. This can also be used to see network downtime.
The Grafana dashboard in these instructions includes a panel with a ping time graph. If you choose not to install blackbox_exporter, simply remove that panel from your Grafana dashboard. It will not show data.
Create User Account
sudo adduser --system blackbox_exporter --group --no-create-homeInstall blackbox_exporter
cd
wget https://github.com/prometheus/blackbox_exporter/releases/download/v0.18.0/blackbox_exporter-0.18.0.linux-amd64.tar.gz
tar xvzf blackbox_exporter-0.18.0.linux-amd64.tar.gz
sudo cp blackbox_exporter-0.18.0.linux-amd64/blackbox_exporter /usr/local/bin/
sudo chown blackbox_exporter:blackbox_exporter /usr/local/bin/blackbox_exporter
sudo chmod 755 /usr/local/bin/blackbox_exporter
Gives blackbox_exporter special network packet creation abilities to allow for pinging servers.
sudo setcap cap_net_raw+ep /usr/local/bin/blackbox_exporterRemove the original blackbox_exporter package.
rm blackbox_exporter-0.18.0.linux-amd64.tar.gzConfigure blackbox_exporter
sudo mkdir /etc/blackbox_exporter
sudo chown blackbox_exporter:blackbox_exporter /etc/blackbox_exporter
Edit the blackbox_exporter configuration file.
sudo nano /etc/blackbox_exporter/blackbox.ymlCopy and paste the following text into the blackbox.yml file.
modules:
        icmp:
                prober: icmp
                timeout: 10s
                icmp:
                        preferred_ip_protocol: ipv4
Change ownership of the configuration file to the blackbox_exporter account.
sudo chown blackbox_exporter:blackbox_exporter /etc/blackbox_exporter/blackbox.ymlSet Up System Service
Set up systemd to automatically start blackbox_exporter. It will also restart the software if it stops.
sudo nano /etc/systemd/system/blackbox_exporter.service
Copy and paste the following text into the blackbox_exporter.service file.
[Unit]
Description=Blackbox Exporter

[Service]
Type=simple
Restart=always
RestartSec=5
User=blackbox_exporter
ExecStart=/usr/local/bin/blackbox_exporter --config.file /etc/blackbox_exporter/blackbox.yml

[Install]
WantedBy=multi-user.target
Reload the systemd service file configurations, start blackbox_exporter, then enable the blackbox_exporter service to have it start automatically on reboot.
sudo systemctl daemon-reload
sudo systemctl start blackbox_exporter.service
sudo systemctl enable blackbox_exporter.service