GithubHelp home page GithubHelp logo

doytsujin / serverstat-linux Goto Github PK

View Code? Open in Web Editor NEW

This project forked from aandergr/serverstat-linux

0.0 2.0 0.0 23 KB

Collect and Plot Linux System Usage Statistics using RRDtool.

License: MIT License

Makefile 0.94% Shell 10.72% C 59.42% Perl 28.93%

serverstat-linux's Introduction

Overview

This is a tool providing a CGI page plotting system usage statistics using rrdtool. With only about 400 lines of code, it is very simple and therefore easy to understand and extend.

Currently it collects Load Average, CPU usage, Temperature, Disk I/O, Network Traffic and Memory and Swap Usage, which are plotted over a period chosen by the user at runtime.

It is build up of two parts:

  • stat.pl - Perl CGI script to be called by a webserver.
  • rrdupd.c - lightweight daemon collecting system usage information.

Installation

You need to have rrdtool with plotting capability installed, as well as the common tools for building C programs (i.e. make and gcc). This program should be installed in a path where your webserver is able to execute the stat.pl script via its CGI.

When these prerequisites are met, installation is done with following steps:

  1. Download serverstat-linux, e.g. by doing git clone https://github.com/aandergr/serverstat-linux
  2. You might adjust the files to fit your needs
  3. Build rrdupd using make
  4. Run ./mkrrd.sh to initalize RRD databases
  5. Adjust permissions such that your webserver is able to execute stat.pl as CGI script, able to read .rrd files and able to write/create .png files in that directory
  6. Run ./rrdupd

./rrdupd should be started automatically on system startup. On debian-alike systems, this can be achieved using:

echo "start-stop-daemon -S -x /var/www/html/stat/rrdupd -c stat -b" >> /etc/rc.local
chmod +x /etc/rc.local

(Where stat is the name of the user and /var/www/html/stat the path of this software)

Also, there is a serverstat-linux.service systemctl script template in this repository.

Consult the documentation of your operating system for more information.

Now you can point your browser to the direction of your stat.pl and (hopefully) everything works. Of course it will take a few minutes until you see some data.

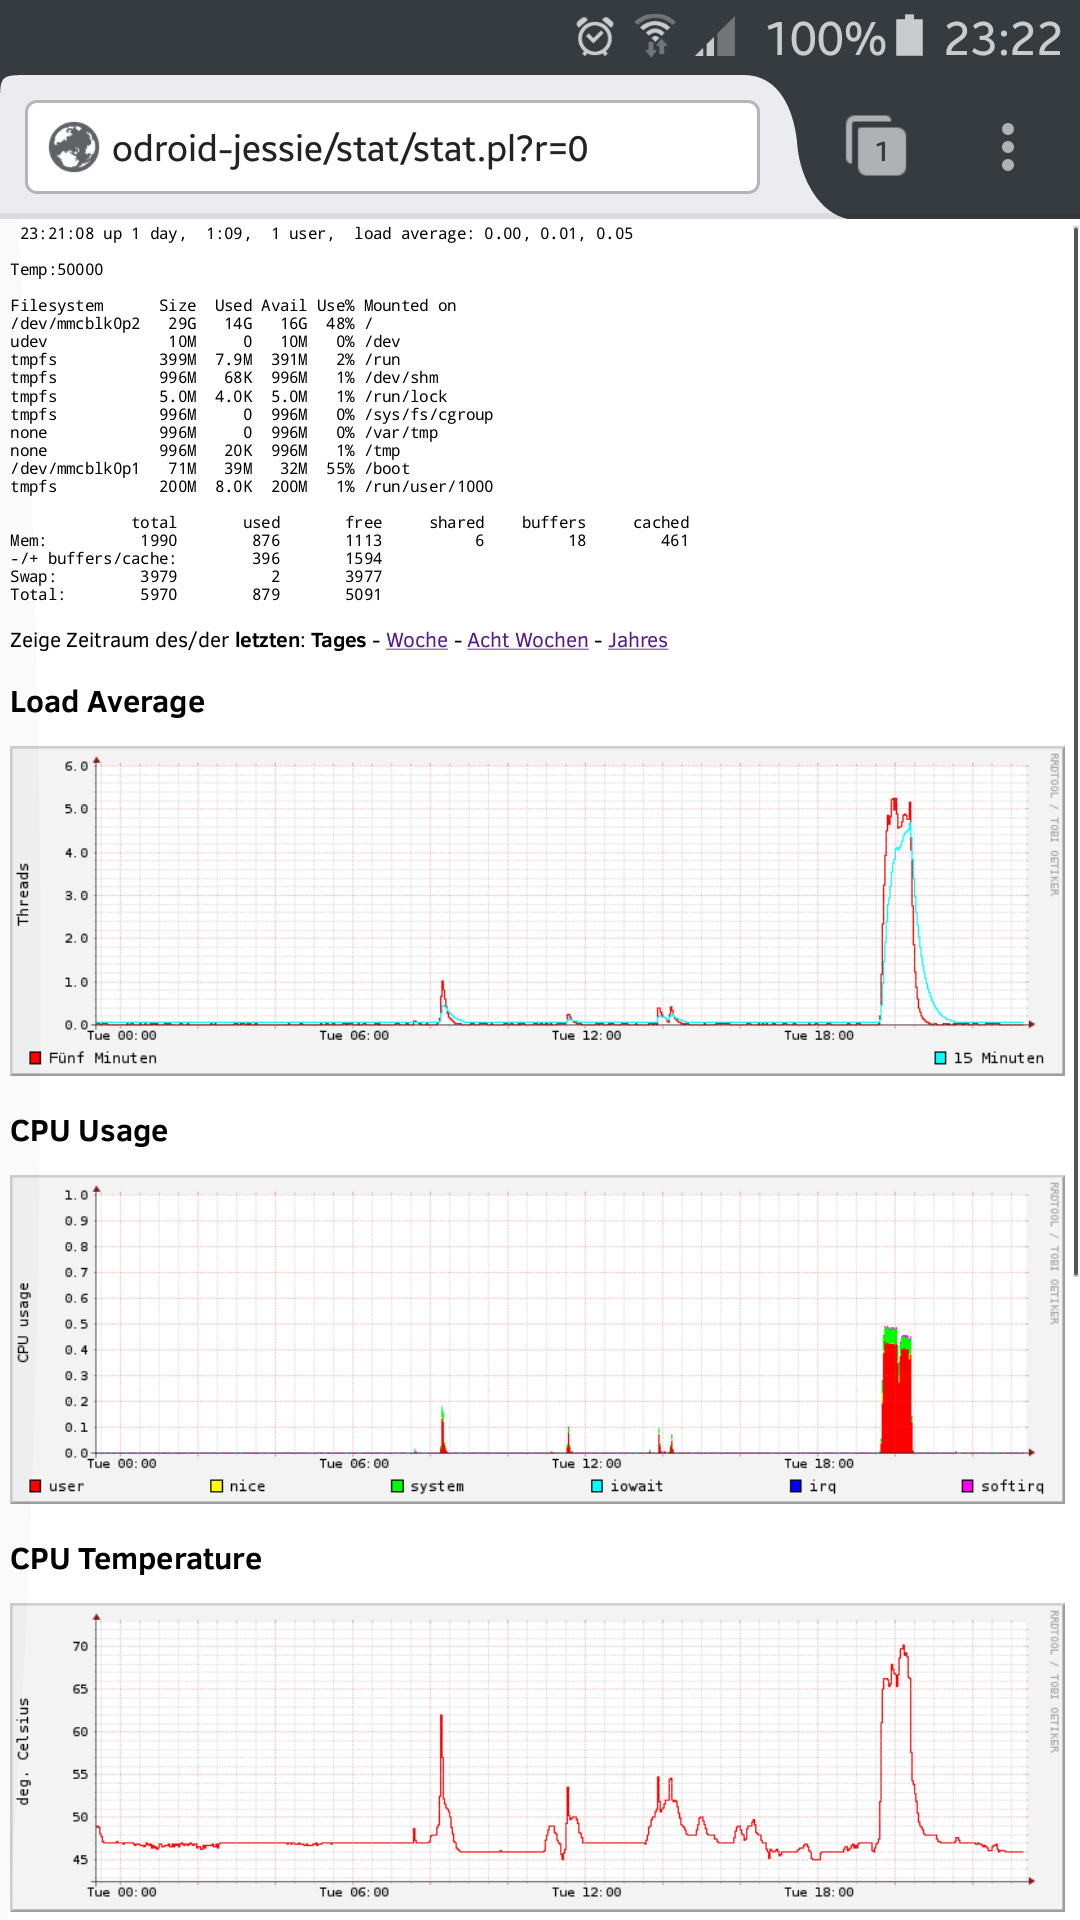
Screenshots

It might look like this: Screenshot of stat.pl page

serverstat-linux's People

Contributors

aandergr avatar thammus avatar

Watchers

 avatar  avatar

Recommend Projects

  • React photo React

    A declarative, efficient, and flexible JavaScript library for building user interfaces.

  • Vue.js photo Vue.js

    ๐Ÿ–– Vue.js is a progressive, incrementally-adoptable JavaScript framework for building UI on the web.

  • Typescript photo Typescript

    TypeScript is a superset of JavaScript that compiles to clean JavaScript output.

  • TensorFlow photo TensorFlow

    An Open Source Machine Learning Framework for Everyone

  • Django photo Django

    The Web framework for perfectionists with deadlines.

  • D3 photo D3

    Bring data to life with SVG, Canvas and HTML. ๐Ÿ“Š๐Ÿ“ˆ๐ŸŽ‰

Recommend Topics

  • javascript

    JavaScript (JS) is a lightweight interpreted programming language with first-class functions.

  • web

    Some thing interesting about web. New door for the world.

  • server

    A server is a program made to process requests and deliver data to clients.

  • Machine learning

    Machine learning is a way of modeling and interpreting data that allows a piece of software to respond intelligently.

  • Game

    Some thing interesting about game, make everyone happy.

Recommend Org

  • Facebook photo Facebook

    We are working to build community through open source technology. NB: members must have two-factor auth.

  • Microsoft photo Microsoft

    Open source projects and samples from Microsoft.

  • Google photo Google

    Google โค๏ธ Open Source for everyone.

  • D3 photo D3

    Data-Driven Documents codes.