GithubHelp home page GithubHelp logo

grademark / grademark Goto Github PK

View Code? Open in Web Editor NEW
272.0 14.0 31.0 467 KB

An API for backtesting trading strategies in JavaScript and TypeScript.

Home Page: http://www.the-data-wrangler.com/

License: MIT License

Batchfile 0.01% TypeScript 99.99%
data-forge trading-strategies javascript typescript backtesting-trading-strategies plot-charts drawdown-chart equity-curve trade drawdown

grademark's Introduction

Grademark

Toolkit for algo trading and backtesting in JavaScript and TypeScript.

This API builds on Data-Forge and is best used from Data-Forge Notebook (making it easy to plot charts and visualize).

Check out the release notes to see updates and breaking changes.

Click here to support my work

Please see what this looks like in the Grademark first example and the unit tests in this repo.

Love this? Please star this repo!

First example

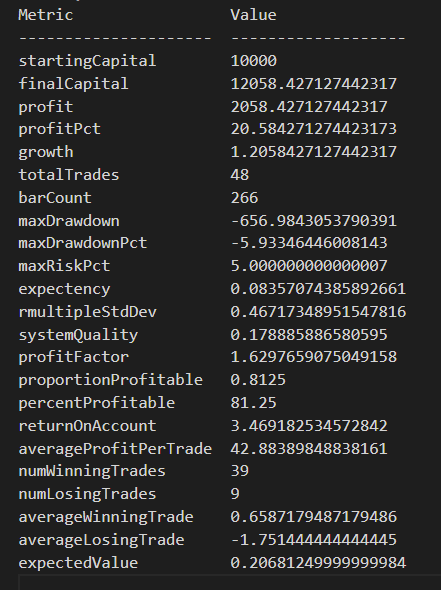
From the Grademark first example here's some example output. Click to see the first example as a notebook.

Analysis of a sequence of trades looks like this:

Analysis of trades screenshot

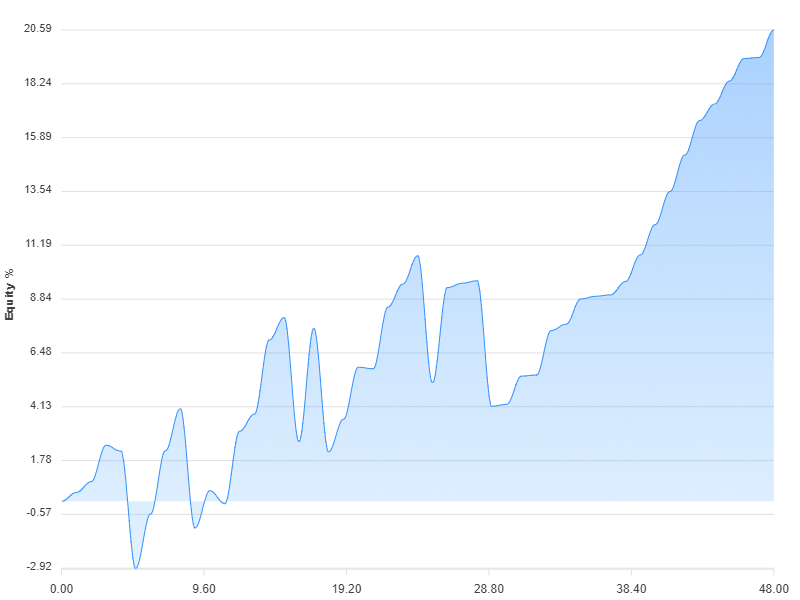
Here's a chart that visualizes the equity curve for the example strategy:

Equity curve

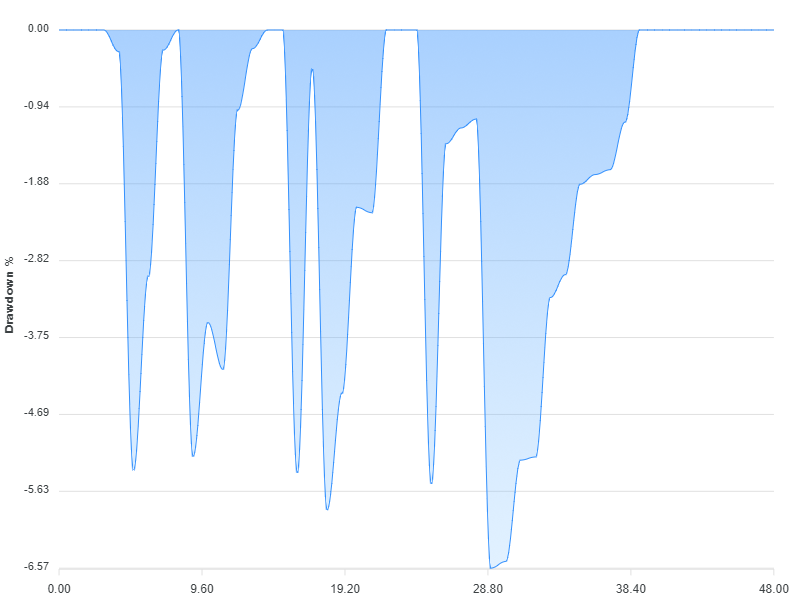
Here's another chart, this one is a visualization of the drawdown for the example strategy:

Drawdown

Pre-requisites

  • Make sure your data is sorted in forward chronological order.

Data format

Your data needs to be loaded into memory in the following format:

interface IBar {
    time: Date;
    open: number;
    high: number;
    low: number;
    close: number;
}

const data: IBar[] = ... load your data ...

Features

  • Define a trading strategy with entry and exit rules.
  • Backtest a trading strategy on a single financial instrument.
  • Apply custom indicators to your input data series.
  • Specify lookback period.
  • Built-in intrabar stop loss.
  • Compute and plot equity curve and drawdown charts.
  • Throughly covered by automated tests.
  • Calculation of risk and rmultiples.
  • Intrabar profit target.
  • Intrabar trailing stop loss.
  • Conditional buy on price level (intrabar).
  • Monte carlo simulation.
  • Multiple parameter optimization based on permutations of parameters (using grid search and hill-climb algorithms).
  • Walk forward optimization and backtesting.
  • Plot a chart of trailing stop loss.
  • Short selling.

Data-Forge Notebook comes with example JavaScript notebooks that demonstrate many of these features.

If you need help with new features please reach out!

Maybe coming later

  • Support for precise decimal numbers.
  • Fees.
  • Slippage.
  • Position sizing.
  • Testing multiple instruments / portfolio simulation / ranking instruments.
  • Market filters.

Complete examples

For a ready to go example please see the repo grademark-first-example.

Usage

Instructions here are for JavaScript, but this library is written in TypeScript and so it can also be used from TypeScript.

Installation

npm install --save grademark

Import modules

const dataForge = require('data-forge');
require('data-forge-fs'); // For file loading capability.
require('data-forge-indicators'); // For the moving average indicator.
require('data-forge-plot'); // For rendering charts.
const { backtest, analyze, computeEquityCurve, computeDrawdown } = require('grademark');

Load your data

Use Data-Forge to load and prep your data, make sure your data is sorted in forward chronological order.

This example loads a CSV file, but feel free to load your data from REST API, database or wherever you want!

let inputSeries = dataForge.readFileSync("STW.csv")
    .parseCSV()
    .parseDates("date", "D/MM/YYYY")
    .parseFloats(["open", "high", "low", "close", "volume"])
    .setIndex("date") // Index so we can later merge on date.
    .renameSeries({ date: "time" });

The example data file is available in the example repo.

Add indicators

Add whatever indicators and signals you want to your data.

const movingAverage = inputSeries
    .deflate(bar => bar.close)          // Extract closing price series.
    .sma(30);                           // 30 day moving average.

inputSeries = inputSeries
    .withSeries("sma", movingAverage)   // Integrate moving average into data, indexed on date.
    .skip(30)                           // Skip blank sma entries.

Create a strategy

This is a very simple and very naive mean reversion strategy:

const strategy = {
    entryRule: (enterPosition, args) => {
        if (args.bar.close < args.bar.sma) { // Buy when price is below average.
            enterPosition({ direction: "long" }); // Long is default, pass in "short" to short sell.
        }
    },

    exitRule: (exitPosition, args) => {
        if (args.bar.close > args.bar.sma) {
            exitPosition(); // Sell when price is above average.
        }
    },

    stopLoss: args => { // Optional intrabar stop loss.
        return args.entryPrice * (5/100); // Stop out on 5% loss from entry price.
    },
};

Running a backtest

Backtest your strategy, then compute and print metrics:

const trades = backtest(strategy, inputSeries)
console.log("Made " + trades.length + " trades!");

const startingCapital = 10000;
const analysis = analyze(startingCapital, trades);
console.log(analysis);

Visualizing the results

Use Data-Forge Plot to visualize the equity curve and drawdown chart from your trading strategy:

computeEquityCurve(trades)
    .plot()
    .renderImage("output/my-equity-curve.png");

computeDrawdown(trades)
    .plot()
    .renderImage("output/my-drawdown.png");

Advanced backtesting

We are only just getting started in this example to learn more please follow my blog and YouTube channel.

Resources

Support the developer

Click here to support the developer.

grademark's People

Contributors

ashleydavis avatar

Stargazers

 avatar  avatar  avatar  avatar  avatar  avatar  avatar  avatar  avatar  avatar  avatar  avatar  avatar  avatar  avatar  avatar  avatar  avatar  avatar  avatar  avatar  avatar  avatar  avatar  avatar  avatar  avatar  avatar  avatar  avatar  avatar  avatar  avatar  avatar  avatar  avatar  avatar  avatar  avatar  avatar  avatar  avatar  avatar  avatar  avatar  avatar  avatar  avatar  avatar  avatar  avatar  avatar  avatar  avatar  avatar  avatar  avatar  avatar  avatar  avatar  avatar  avatar  avatar  avatar  avatar  avatar  avatar  avatar  avatar  avatar  avatar  avatar  avatar  avatar  avatar  avatar  avatar  avatar  avatar  avatar  avatar  avatar  avatar  avatar  avatar  avatar  avatar  avatar  avatar  avatar  avatar  avatar  avatar  avatar  avatar  avatar  avatar  avatar  avatar  avatar

Watchers

 avatar  avatar  avatar  avatar  avatar  avatar  avatar  avatar  avatar  avatar  avatar  avatar  avatar  avatar

grademark's Issues

Only minute bar data close and using multiple symbols in the CSV.

Hello! This is a VERY cool and lightweight library I am excited to learn more about. I am working on developing a backtesting solution that involves only the close of the equity price on minute bars and buys the equity on a spread difference. Thus the data looks like this:

Minute bar data.

Equity 1

YYYY-MM-DD HH:Mmm | price

Equity 2

YYYY-MM-DD HH:Mmm | price

I am trying to make a simple backtest that says if the spread is > x% then buy.

How does this system define what it is determining what to buy when you enter a new position? And with what size? How would I go about having two equities in there and then having it buy or sell that asset based on the spread? Cheers.

Using stochrsi indicator

There's a way to backtest using more complexes indicators?

I'm trying to figure out how to backtest using stochrsi and others indicators, but no idea till now

Types are incorrect for `args.lookback` in the entry rules

While using TypeScript, looping over the args.lookback like so:

    entryRule: (enterPosition, args) => {
        for (const bar of args.lookback) {
            console.log('bar: ', bar);
        }
        // Rest of the rule down here

... will produce logs like so:

bar:  {
  Field: '9984',
  Value: {
    time: 2021-02-08T20:05:00.000Z,
    open: 59.2499,
    high: 59.2499,
    low: 58.9277,
    close: 58.9999,
    volume: 35349
  }
}

However, the type specified is actually an IBar, which is not correct:
image

I would really appreciate this being fixed as a pure TS user. It's not hard to get around, but it's a little annoying!

Thank you for your awesome work on this by the way, this has been instrumental in testing my strategy.

Plotting is not generating charts

I'm executing the first example and seems everything is working except the plotting library. It's not generating any charts, but I can see the analysis and trades.csv files in the output folder. I can see the console log message indicating that the plotting phase has started, but it does not matter how long I wait.. there is no chart. I'm attaching a screenshot where you can see that.

I'm using node 12.22.0 and you can see each package version below:

"@data-forge-plot/render": "^0.0.5", "@plotex/render-image": "^1.0.15", "apollo-engine": "^1.1.2", "apollo-server-express": "^2.10.0", "auth0": "^2.23.0", "aws-sdk": "^2.643.0", "body-parser": "^1.19.0", "cors": "^2.8.5", "data-forge": "^1.8.17", "data-forge-fs": "^0.0.9", "data-forge-indicators": "^0.2.7", "data-forge-plot": "^1.0.2",

Screenshot

image

five bars

Hi, thank you for your work.
I'm about to test Grademark in my login I'm going to need to have access to the last five bars, how do I achieve it?

Trades is not iterable

Hi, applying the example directly from https://github.com/Grademark/grademark/blob/master/README.md :

const dataForge = require('data-forge');
require('data-forge-fs'); // For file loading capability.
require('data-forge-indicators'); // For the moving average indicator.
require('data-forge-plot'); // For rendering charts.
const { backtest, analyze, computeEquityCurve, computeDrawdown } = require('grademark');

let inputSeries = dataForge.readFileSync("data/STW.csv")
    .parseCSV()
    .parseDates("date", "DD/MM/YYYY")
    .parseFloats(["open", "high", "low", "close", "volume"])
    .setIndex("date") // Index so we can later merge on date.
    .renameSeries({ date: "time" });

const movingAverage = inputSeries
    .deflate(bar => bar.close)          // Extract closing price series.
    .sma(30);                           // 30 day moving average.

inputSeries = inputSeries
    .withSeries("sma", movingAverage)   // Integrate moving average into data, indexed on date.
    .skip(30)                           // Skip blank sma entries.

const strategy = {
    entryRule: (enterPosition, args) => {
        if (args.bar.close < args.bar.sma) { // Buy when price is below average.
            enterPosition();
        }
    },

    exitRule: (exitPosition, args) => {
        if (args.bar.close > args.bar.sma) {
            exitPosition(); // Sell when price is above average.
        }
    },

    stopLoss: args => { // Optional intrabar stop loss.
        return args.entryPrice * (5 / 100); // Stop out on 5% loss from entry price.
    },
};

const trades = backtest(strategy, inputSeries)
console.log("Made " + trades.count() + " trades!");

const startingCapital = 10000;
const analysis = analyze(startingCapital, trades);
console.log(analysis);

computeEquityCurve(trades)
    .plot()
    .renderImage("output/my-equity-curve.png");

computeDrawdown(trades)
    .plot()
    .renderImage("output/my-drawdown.png");

Output of console.log(analysis):

Made 48 trades!
{ startingCapital: 10000, finalCapital: 12058.427127442317, profit: 2058.427127442317, profitPct: 20.584271274423173, growth: 1.2058427127442317, totalTrades: 48, barCount: 266, maxDrawdown: -656.9843053790391, maxDrawdownPct: -5.93346446008143, maxRiskPct: 5.000000000000007, expectency: 0.08357074385892661, rmultipleStdDev: 0.46717348951547816, systemQuality: 0.178885886580595, profitFactor: 1.6297659075049158, percentProfitable: 81.25, returnOnAccount: 3.469182534572842 }

But I get the following error for computeEquityCurve(trades):

trades is not iterable
at <anonymous> (49:5)

Using version 0.23.0 of the notebook

Recommend Projects

  • React photo React

    A declarative, efficient, and flexible JavaScript library for building user interfaces.

  • Vue.js photo Vue.js

    ๐Ÿ–– Vue.js is a progressive, incrementally-adoptable JavaScript framework for building UI on the web.

  • Typescript photo Typescript

    TypeScript is a superset of JavaScript that compiles to clean JavaScript output.

  • TensorFlow photo TensorFlow

    An Open Source Machine Learning Framework for Everyone

  • Django photo Django

    The Web framework for perfectionists with deadlines.

  • D3 photo D3

    Bring data to life with SVG, Canvas and HTML. ๐Ÿ“Š๐Ÿ“ˆ๐ŸŽ‰

Recommend Topics

  • javascript

    JavaScript (JS) is a lightweight interpreted programming language with first-class functions.

  • web

    Some thing interesting about web. New door for the world.

  • server

    A server is a program made to process requests and deliver data to clients.

  • Machine learning

    Machine learning is a way of modeling and interpreting data that allows a piece of software to respond intelligently.

  • Game

    Some thing interesting about game, make everyone happy.

Recommend Org

  • Facebook photo Facebook

    We are working to build community through open source technology. NB: members must have two-factor auth.

  • Microsoft photo Microsoft

    Open source projects and samples from Microsoft.

  • Google photo Google

    Google โค๏ธ Open Source for everyone.

  • D3 photo D3

    Data-Driven Documents codes.