GithubHelp home page GithubHelp logo

infuseai / piperider Goto Github PK

View Code? Open in Web Editor NEW
468.0 14.0 21.0 33.4 MB

Code review for data in dbt

Home Page: https://www.piperider.io/

License: Apache License 2.0

Makefile 0.12% Python 57.68% Dockerfile 0.06% Shell 0.24% HTML 0.50% JavaScript 0.96% TypeScript 40.34% Batchfile 0.11%
data-pipeline data-profiling data-quality data-science data-exploration eda exploratory-data-analysis data-testing python data-observability

piperider's Introduction

ci-tests codecov release pipy python downloads license InfuseAI Discord Invite

Docs | Discord | Blog

Important

PipeRider has been superseded by Recce. We recommend that users requiring pre-merge data validation checks migrate to Recce. PipeRider will not longer be updated on a regular basis. You are still welcome to open a PR with bug fixes or feature requests. For questions and help regarding this update, please contact [email protected] or leave a message in the Recce Discord.

Code review for data in dbt

PipeRider automatically compares your data to highlight the difference in impacted downstream dbt models so you can merge your Pull Requests with confidence.

How it works:

  • Easy to connect your datasource -> PipeRider leverages the connection profiles in your dbt project to connect to the data warehouse
  • Generate profiling statistics of your models to get a high-level overview of your data
  • Compare target branch changes with the main branch in a HTML report
  • Post a quick summary of the data changes to your PR, so others can be confident too

Core concepts

  • Easy to install: Leveraging dbt's configuration settings, PipeRider can be installed within 2 minutes
  • Fast comparison: by collecting profiling statistics (e.g. uniqueness, averages, quantiles, histogram) and metric queries, comparing downstream data impact takes little time, speeding up your team's review time
  • Valuable insights: various profiling statistics displayed in the HTML report give fast insights into your data

Quickstart

  1. Install PipeRider

    pip install piperider[<connector>]

    You can find all supported data source connectors here.

  2. Add PipeRider tag on your model: Go to your dbt project, and add the PipeRider tag on the model you want to profile.

    --models/staging/stg_customers.sql
    {{ config(
       tags=["piperider"]
    ) }}
    
    select ...

    and show the models would be run by piperider

     dbt list -s tag:piperider --resource-type model
    
  3. Run PipeRider

    piperider run

To see the full quick start guide, please refer to PipeRider documentation

Features

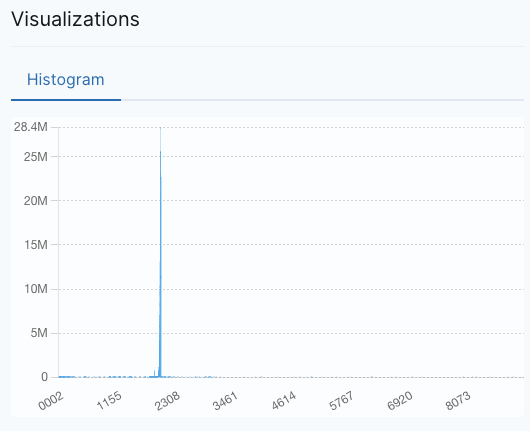
  • Model profiling: PipeRider can profile your dbt models and obtain information such as basic data composition, quantiles, histograms, text length, top categories, and more.
  • Metric queries: PipeRider can integrate with dbt metrics and present the time-series data of metrics in the report.
  • HTML report: PipeRider generates a static HTML report each time it runs, which can be viewed locally or shared.
  • Report comparison: You can compare two previously generated reports or use a single command to compare the differences between the current branch and the main branch. The latter is designed specifically for code review scenarios. In our pull requests on GitHub, we not only want to know which files have been changed, but also the impact of these changes on the data. PipeRider can easily generate comparison reports with a single command to provide this information.
  • CI integration: The key to CI is automation, and in the code review process, automating this workflow is even more meaningful. PipeRider can easily integrate into your CI process. When new commits are pushed to your PR branch, reports can be automatically generated to provide reviewers with more confidence in the changes made when reviewing.

Example Report Demo

We use the example project git-repo-analytics to demonstrate how to use piperider+dbt+duckdb to analyze dbt-core repository. Here is the generated result (daily update)

Run Report

Comparison Report

Comparison Summary in a PR

PipeRider Cloud (beta)

PipeRider Cloud allows you to upload reports and share them with your team members. For information on pricing plans, please refer to the pricing page.

PipeRider Compare Action

PipeRider provides the PipeRider Compare Action to quickly integrate into your Github Actions workflow. It has the following features:

  • Automatically generates a report comparing the PR branch to the main branch
  • Uploads the report to GitHub artifacts or PipeRider cloud
  • Adds a comment to the pull request with a comparison summary and a link to the report.

You can refer to example workflow yaml and the example pull request.

Development

See setup dev environment and the contributing guildlines to get started.

We love chatting with our users! Let us know if you have any questions, feedback, or need help trying out PipeRider! ❤️

piperider's People

Contributors

ctiml avatar daveflynn avatar db220 avatar dependabot[bot] avatar even-wei avatar ggosiang avatar hlb avatar hsatac avatar jenswilms avatar johnsodk avatar jonycfu avatar kentwelcome avatar neighborhood999 avatar popcornylu avatar qrtt1 avatar siansiansu avatar wcchang1115 avatar

Stargazers

 avatar  avatar  avatar  avatar  avatar  avatar  avatar  avatar  avatar  avatar  avatar  avatar  avatar  avatar  avatar  avatar  avatar  avatar  avatar  avatar  avatar  avatar  avatar  avatar  avatar  avatar  avatar  avatar  avatar  avatar  avatar  avatar  avatar  avatar  avatar  avatar  avatar  avatar  avatar  avatar  avatar  avatar  avatar  avatar  avatar  avatar  avatar  avatar  avatar  avatar  avatar  avatar  avatar  avatar  avatar  avatar  avatar  avatar  avatar  avatar  avatar  avatar  avatar  avatar  avatar  avatar  avatar  avatar  avatar  avatar  avatar  avatar  avatar  avatar  avatar  avatar  avatar  avatar  avatar  avatar  avatar  avatar  avatar  avatar  avatar  avatar  avatar  avatar  avatar  avatar  avatar  avatar  avatar  avatar  avatar  avatar  avatar  avatar  avatar  avatar

Watchers

 avatar  avatar  avatar  avatar  avatar  avatar  avatar  avatar  avatar  avatar  avatar  avatar  avatar  avatar

piperider's Issues

New metric: calculate duplicate rows

Summary

Duplicate row is an obvious data quality problem. It commonly happens when forgetting to truncate the original data before transformation. As a data profiling and data quality tool. we would like to understand if there are duplicate rows in the table.

Duplicate rows is also supported in pandas-profling

Intended Outcome

  1. Allows to opt-in. Duplicate rows are compute-intensive job. We would like to disable it by-default and opt-in by configuration.
  2. The count of duplicate rows is a table metric. We should show the duplicate row count and percentage.

How will it work?

The possible sql query is

 with t as (
select 
    count(*) as duplicate_rows
    from interaction_log
    group by user_id, item_id, item_type, play_amount_second, client_upload_timestamp, server_upload_timestamp, interaction, pt
    having count(*) > 1
)
select sum(duplicate_rows) as duplicate_rows from t;

sc-28170

allow dbt usage with custom generate_schema_name

Is your feature request related to a problem? Please describe.
When running piperider run in our dbt project, we get an error:

Error: Target mismatched. Please run 'dbt compile -t default' to generate the new manifest

This is almost certainly due to the fact that we've customized generate_schema_name so that we can override the typical behavior and set custom schemas that aren't prefixed with the name of the default target schema. Basically we followed the "advanced path" documented here

Describe the solution you'd like
It would be great to make use of piperider in our dbt project even if the schema names aren't all prefixed with the default target schema name.

Additional context
Here's our override for generate_schema_name:

{% macro generate_schema_name(custom_schema_name, node) -%}

    {%- set default_schema = target.schema -%}
    {%- if custom_schema_name is none -%}

        {{ default_schema }}

    {%- else -%}

        {{ custom_schema_name | trim }}

    {%- endif -%}

{%- endmacro %}

Don't generate the assertion files in `piperider run`

Summary

Some users use piperider as the data profiling tool only. However, in current journey, it will always generate the assertion files for the first run.

fetching metadata
[1/1] data ━━━━━━━━━━━  5/5 0:00:00
No assertion found
Do you want to auto generate recommended assertions for this datasource [Yes/no]?

The problem would be

  1. User don't know what will happen when I enter yes or no
  2. Even say NO, there is still empty assertion files generated. But why don't we generate it only when the user would like to write the tests?
  3. If the user say YES, the assertions files are generated for current profiling result. However, if the user is not intended to write assertion files right away, the generated assertions would be confusing for the future runs.
  4. Another problem is that, all the assertion files for every tables are generated. It would be not realistic to write all the tests at the same time.

Intended Outcome

  • Don't generate assertions in piperider run, use generate-assertions command instead to generate template or assertions.
  • The real case to write test is table by table. It would be more reasonable to generate assertions -> edit assertion file -> test by table basic.

How will it work?

  1. The piperider run will not generate assertions.
  2. In generate-assertions, we have to specify the table to generate rather than all tables. (e.g. piperider generate-assertions --table mytable)
  3. In generate-assertions, it generate recommended assertions by default. But can generate empty assertion by --no-recommend

Internal ticket sc-28737

Return non-zero exit code if test failed

Summary

Currently, when there are failed test, it still return zero exit-code.

If we would like to integrate pipeline in workflow system (e.g. airflow) or CI system (e.g. jenkins, github action), it would be better to failed with non-zero exit code so that we can make the job with failed condition

Intended Outcome

When there is any test failed, return non-zero (1 would be good enugh)

How will it work?

In the command piperider run, call exit(1) if there is any test failed.

sc-28851

Support to profile with row limit

Is your feature request related to a problem? Please describe.
For big dataset, it is time-consuming and costly to profile.

Describe the solution you'd like
Allows to configure the maximum rows to profile

Describe alternatives you've considered
N/A

Additional context

Feature: better CI support

Users can run PipeRider through the CI process, so users can get reports instantly when code/schema changes, pipelines are executed, or perform data quality checks periodically.

Users can use PipeRider to generate report files, but it was hard before to get the latest report files from the command line interface and perform follow-up actions in the CI automation process.

By implementing this feature, users can use PipeRider to:

  • get the location of output files of reports or comparisons
  • compare the most recent two reports easily

So users can upload the generated reports to AWS S3, send notifications to Slack, and perform other actions by using tools through the CI process.

Feature Design

Requirement

  • Users can get the location of output files of reports or comparisons.
  • Users can compare the most recent two reports without providing any input. (It is more convenient, and users don’t need to know how PipeRider works internally)
  • We can track if a report is generated by CI.

Non-goals

  • upload files for users. They should be able to upload via the tools they use.
  • send notifications for users. They should be able to send notifications via webhook or other tools.

Use Cases

  • Users can get reports instantly when code/schema changed, pipeline executed, or perform data quality check periodically.
  • Users can collect all reports in one place.
  • Data consumers can check the reports without running PipeRider or gaining data access.

User Journeys

  • User can use piperider generate-report -o $PATH to get the location of output.
  • User can use piperider compare-reports --last to generate a comparison report with the most recent two reports.

Milestones

  • Users can get the location of output files of reports or comparisons.
  • Users can compare the most recent two reports without providing any input.
  • Track if a report is generated by CI.

support to output comparison summary

Summary

One of the interesting use cases for comparison report is the CI application. You can compare the results from different environment in a CI automation task (e.g. PR vs production, or staging vs production).

Intended Outcome

piperider compare-reports generates additional markdown summary along with the comparison report. It allows you to paste the summary to the PR comments.

How will it work?

Run the piperider compare-reports, the summary.md is generated in the folder of the comparison report.

Improve the CLI UX for dbt project

Introduction

The main use case is to integrate PipeRider with dbt project. This goal of this story is even to improve the CLI UX when using piperider in the dbt project use case.

Here are the feature list

  1. Implicit data sources from dbt profile/target
  2. piperider run would profile all table models in dbt project (rather than tables in the data source)
  3. Allows to annotate a model as candidate for piperider
  4. Use dbt list to select model for piperider

Features

Implicit data sources from dbt profile/target

Here is the dbt profile.yml

# profile.yml
infusetude:
  target: dev
  outputs:
    dev:
      type: snowflake
      ...
      schema:
      threads: 4
    prod:
      type: snowflake
      ...
      schema:
      threads: 4

The new generated config by piperider init would be like this one

dataSources: []
dbt:
   projectDir: .

The dbt attribute indicates that it is a dbt project, and the implicit data sources dev and prod would be available in the piperider run

It makes the profiles.yml be the single source of truth to connect to your data warehouse.

piperider run would profile all models in dbt project

For a dbt project, the original behavior is

  • piperider run: profile all tables in the data source
  • piperider run --dbt-state target/: profile all models in the target/run_results.json`

The problem is that it does not allow adhoc profiling without another dbt run or dbt build

The new behavior is

  • piperider run: profile all table models in the dbt project (rather than tables in the data source's database+schema)
  • piperider run --dbt-state /tmp/prod: profile all table models in the /tmp/prod/manifest.json, which is generated by dbt run --target-path /tmp/prod. See dbt manifest
  • piperider run --dbt-run-results: profile all table models run in the latest dbt run. It also integrate the dbt test results.

Allows to annotate a model as piperider candidate

Profiling is expensive. It is recommended to whitelist the models which is allowed to do the profiling. We use dbt tags to mark a model as piperider

To enable this feature, you need to edit the .piperider/config.yml with dbt.tag

dataSources: []
dbt:
   projectDir: .
   tag: piperider

and then mark your model with piperider tag

# models/myconfig.yml

version: 2

models:
  - name: model_name
    config:
      tags: [piperider]

    columns:
      - name: column_name
         ...

Remember to regenerate the manifests.json and run piperider

# update the manifest.json
dbt compile
# run again
piperider run

Use dbt list to select model for piperider

For adhoc profiling/exploration case, it is useful to select models/metrics to query. PipeRider leverage the dbt list command to select models/metrics.

dbt list -s models/mymodel.sql | piperider run --dbt-list

Breaking Changes

For dbt project, the command behavior changes

Old New
piperider run no equivalent. Or you should manually configure a non-dbt data source to do the profiling
piperider run --dbt-state target/ piperider run --dbt-state target/ --dbt-run-results

sc-30406

Support multiple CSVs in a project

Is your feature request related to a problem? Please describe.
Currently, we only support to profile one CSV

Describe the solution you'd like

  1. If the path is a folder, load all csv, csv.gz
  2. Support the path to be a package file (e.g. tar, tgz, zip, rar, ...), unpackage it and load as the folder behavior
  3. Otherwise, load it as normal csv.
  4. Each file is a individual table.

[Non-goal] load all files as the data of a single table

Describe alternatives you've considered
N/A

Additional context
sc-28310

Support multiple db and schema when using dbt state

Is your feature request related to a problem? Please describe.
Yes, when using dbt as a datasource it currently does not work at all if your db has custom databases and schemas per group of tables. I have a WIP fix that I might make a PR for that basically looks at dbt state dir and figures out all databases(using snowflake) and schemas for each grouping of tables then profiles them all, concating all the reports into one. The WIP is working for me but is a little bit rough at the moment

Describe the solution you'd like
See above

Describe alternatives you've considered
I am not sure a clean one exists if running on a dbt project that has custom database and schema macros

Additional context

Validation fails when db only has views but include_views=True

Describe the bug
When using the include_views feature, it would be nice if the db only has views that validation/diagnosing would still work. Currently the code only to see if any tables exist, but if the feature of include_views is turned on it should look for the existence of tables and/or views

To Reproduce
piperider init
edit config.yml to make include_views=true
run piperider diagnose -> Fails
and/or
run piperider run -> Fails

Expected behavior
Diagnose and/or run(validation) passes if there only views in the db

Screenshots
None

Desktop (please complete the following information):
Does not matter

Additional context

Showing only the parts that have changed

Show some kind of "change report card":

When comparing two reports it would be great to have a feature to only show the data where something has been changed.

Assertion results shown along column details

Hello, I want to suggest a feature, a change on the automatic report.
It would be useful to have the assertion results shown on the column details page, it would be easier to spot failed test per column

Cannot run piperider

Describe the bug
Trying to follow the quick start guide to install and begin to use piperider with dbt using vs code. I could do all the steps until run. So init and diagnose worked fine but run gave me an error.

To Reproduce
Steps to reproduce the behaviour:

  1. Setup environment:
  2. Execute command: piperider run
  3. See error: Error: Profiler Exception: TypeError('SQLCompiler.init() got multiple values for argument 'cache_key'')

Expected behaviour
I expected it to be able to run

Screenshots
Skärmavbild 2023-01-20 kl  14 25 13

Desktop (please complete the following information):

  • OS: macOS v.12.6
  • Processor: 2,6 GHz 6-Core Intel Core i7
  • dbt version: 1.3.0
  • Python Version: 3.10.8
  • Version: piperider version 0.17.1

Make the Assertions more Flexible to Configure and Easier to Read

Problem

Currently we have these built-in assertion rules

https://docs.piperider.io/data-quality-assertions/assertion-configuration

However, here lists the problems

  1. For each metric, it needs to provide one or more assertion rules to fulfill the needs. Even they are quite similar
  2. The assertion operators for threshold are quite limited. The operator could be various > , , =, !=, <, , between.
  3. The test function is not easy to understand. assert_row_count_in_range
  4. The expected result is not easy to understand {'count': [1, 10000000]}

Expected Outcome

  1. We need a more generic way to define the assertion rules, which should separate it to metric , operator, threshold
  2. The test name should be the metric display name. (e.g. Rows, Missing percentage)
  3. The expected result should be more human-readable (e.g. ≥ 0.01, [1, 10000000))

How will it work?

Example 1: Test the row count in the range [1, 10000000) (i.e. 1 ≤ row_count < 10000000)

Old

assertion rule

PRICE:
  tests:
  - name: assert_row_count
    assert:
      min: 1
      max: 10000000

assertion display in CLI console

Status     Target        Test Function                Expected                   Actual
 ───────────────────────────────────────────────────────────────────────────────────────────────────
  [  OK  ]   PRICE         assert_row_count_in_range    {'count': [1, 10000000]}   157881

assertion display in report, similar to above

New

PRICE:
  - metric: row_count
    assert:
      gte: 1
      lt: 10000000
  1. Change the min, max to operator gt, gte, ….
  2. Change the name to metric
Status     Target        Test Name                Expected                   Actual
 ───────────────────────────────────────────────────────────────────────────────────────────────────
  [  OK  ]   PRICE         Rows    [1, 10000000)   157881
  1. Change the Test Function column name to Test name
  2. Change the expected more human readable
  3. Make the Test name to the metric display name

Example 2: Test the missing percentage ≤ 0.01

world_city:
  tests:
  - metric: nulls_p
    assert:
      lte: 0.01
Status     Target        Test Name                Expected                   Actual
 ───────────────────────────────────────────────────────────────────────────────────────────────────
  [  OK  ]   PRICE.OPEN     Missing Percentage       ≥ 0.01                   0

sc-28831

Officially supports BigQuery

Is your feature request related to a problem? Please describe.
We use BigQuery with dbt. It would be awesome for piperider to officially support it.

Describe the solution you'd like
I would like piperider to support BigQuery.

Describe alternatives you've considered
NA

Additional context
NA

Fetch table and column description from the data source

Problem

The description or table/column could help us to understand the purpose/usage of table or column. Currently, the description can from

  1. piperider config
  2. dbt model or source description

However, it is common that we can get the table or column description from the information_schema. For example, in snowflake, we can get the table description from here

Expected Outcome

If the table or column has description, show in the report.

How does it works

Snowflake: Did not recognize type 'DATE' of column 'date'

Describe the bug
A clear and concise description of what the bug is.

To Reproduce
Steps to reproduce the behavior:

  1. Setup environment
    Setup snowflake backend.
    Have a table with DATE column
  2. Execute command
     piperider run
    
  3. See error
/private/tmp/piperider-test/venv/lib/python3.9/site-packages/snowflake/sqlalchemy/snowdialect.py:539: SAWarning: Did not recognize type 'DATE' of column 'date'
  sa_util.warn(
Error: 'NullType' object is not callable

Expected behavior
No error

Screenshots
If applicable, add screenshots to help explain your problem.
image

Desktop (please complete the following information):

  • OS: [e.g. macOS]
  • Python Version [e.g. 3.9]
  • Version [e.g. v0.4.1]

Additional context
Add any other context about the problem here.

Error: unsupported operand type(s) for -: 'NoneType' and 'NoneType'

Describe the bug
'Piperider run' is not fully functioning, it gives the following error: "Error: unsupported operand type(s) for -: 'NoneType' and 'NoneType'

The error shows immediately after profiling all the table columns.

To Reproduce
Steps to reproduce the behavior:

  1. install piperider with postgres
  2. piperider init
  3. piperider run

Desktop

  • OS: macOS
  • Python Version [3.9.12]
  • Version [v0.2.0]

New PipeRider compare command

Introduction

To code review the model change, we would like to compare the profiling and metric queries between PR branch and main branch. However, there are many steps for the whole process

  1. Switch branch between pr branch and main branch
  2. Run dbt for the two branches
  3. Run piperider for the two branches

In order to make the process well-defined and reproducible, we would like to source control the workflow for pr comparison somewhere and use single unified command to run the workflow. Here is the piperider compare command comes in

Requirements

  1. The default behavior of piperider compare is to compare current branch with main branch.
  2. Allows to define other RECIPEs to do the compare. (e.g. the branch to switch, the dbt commands to run)
  3. Use piperider compare --recipe <recipe> to change the comparison workflow

Default Compare Recipe

The default recipe is generated when run the piperider init

# .piperider/compare/default.yml
base:
  branch: main
  dbt:
    commands:
    - dbt deps
    - dbt build
  piperider:
    command: piperider run
target:
  dbt:
    commands:
    - dbt deps
    - dbt build
  piperider:
    command: piperider run

and then run

piperider compare

You can change the default recipe later on. Just use editor to modify the configuration at .piperider/compare/default.yml

Custom Compare Recipe

Create a new file at .piperider/compare/<recipe>.yml and use piperider compare --recipe <recipe> to run this recipe

Example recipes

Dev recipe (since v0.20.0)

This is a process to do the run and compare with the same base report. The requirements are

  1. The base result is from file
  2. No dbt command run in target. We assume that we run the dbt command separately
# .piperider/compare/dev.yml
base:
  file: 'path/to/base/run.json'
target:
  piperider:
    command: 'piperider run'

Slim CI recipe

Slim CI is a technique that we only transform the new and changed models comparing to the base state. Here are the requirement

  1. We have already had production dbt state somewhere
  2. Run PR branch dbt command with slim ci options
  3. Run piperider with --dbt-run-results so that it only profile the models which is run in the latest dbt run
# .piperider/compare/slim-ci.yml
base:
  branch: main
  piperider:
    command: "piperider run --dbt-state path/to/prod/artifacts"
target:
  dbt:
    commands:
    - dbt deps
    - "dbt build --select state:changed+ --defer --state path/to/prod/artifacts"
  piperider:
    command: "piperider run --dbt-run-results"

value overflow when profiling table with large numeric IDs

I'm new to PipeRider and have really enjoyed it so far. The ease-of-use is pretty remarkable.

I've profiled a number of databases over the last few days and ran into an issue, in a handful of databases, where numeric ID columns cause an overflow error that prevents the profiler from processing a table. E.g.

[ 9/33] <redacted_table_name> 0/31 0:00:15
Error: Profiler Exception: ProgrammingError('(snowflake.connector.errors.ProgrammingError) 100058 (22000): Value overflow in a SUM aggregate
[SQL: WITH anon_2 AS
(SELECT <redacted_table_name>.<redacted_numeric_id> AS c, <redacted_table_name>.<redacted_numeric_id> AS orig
FROM <redacted_table_name> ),
anon_1 AS
(SELECT anon_2.c AS c, CASE WHEN (anon_2.c = %(c_1)s) THEN %(param_1)s END AS zero, CASE WHEN (anon_2.c < %(c_2)s) THEN %(param_2)s END AS negative, anon_2.orig AS orig
FROM anon_2)
SELECT count(*) AS _total, count(anon_1.orig) AS _non_nulls, count(anon_1.c) AS _valids, count(anon_1.zero) AS _zeros, count(anon_1.negative) AS _negatives, count(DISTINCT anon_1.c) AS _distinct, sum(CAST(anon_1.c AS FLOAT)) AS _sum, avg(anon_1.c) AS _avg, min(anon_1.c) AS _min, max(anon_1.c) AS _max, stddev(anon_1.c) AS _stddev
FROM anon_1]
[parameters: {'c_1': 0, 'param_1': 1, 'c_2': 0, 'param_2': 1}]
(Background on this error at: https://sqlalche.me/e/14/f405)')

The first time this happened I thought it was an obscure edge-case. I removed the problematic table from config.yml and moved on. In my environment, large numeric ID columns are fairly common, and the boxplot of the numeric ID values isn't meaningful. The result of this behavior is that we skip profiling some of our most frequently used data assets.

A quick & dirty workaround would be to copy the entire table, drop the problematic column, document its existence, and profile the copy. That would result in the generated HTML reports becoming disorganized. It's also expensive and slow.

Perhaps config.yml could be modified to accept an optional "exclude_column" property for any table in the includes list. Or maybe PipeRider could optionally warn on error, instead of fail. Or perhaps there's a way to write the profiling SQL statements to capture the data in a way that doesn't cause the overflow.

If a table has 100 columns, and it was possible to profile 99 without any errors, I'm sure there are other people like me who'd prefer to have 99 profiled columns and a warning rather than an error and no report.

Support column value check assertion

Summary

  1. Format check: The text column match certain criteria (or regular expression).
  2. Column values in set: The value of the column should be only valid in certain set.
  3. Reference check: Like foreign key constraint in db. Check if value in a column exist in another table's certain column

Currently, the assertion rules are all based on the profiling result. However, it is not enough as a data quality tool. This story is the first assertion which support non-metric-based assertion.

Intended Outcome

  1. Add at least 3 non-metric based test
  2. Design the foundation of non-metric assertions.

How will it work?

world_city:
  columns:
    create_at:
      tests:
      - name: assert_column_value
        assert:
          gte: <greater than or equals to>
          gt: <great than>
          lte: <less than or equals to>
          lt: <less than>
          like: "<sql like>"
          match: "<regex>" # may not supported in some data source
world_city:
  columns:
    create_at:
      tests:
      - name: assert_column_value
        assert:
          in: ["foo", "bar"]

sc-28973

Support to include/exclude tables through configuration

Is your feature request related to a problem? Please describe.
For each data source, there could be many tables to be profiled. In current piperider, we can only choose to profile all tables or one table

Describe the solution you'd like
Allows to define the tables (and even columns in a table) to profile.

Describe alternatives you've considered
N/A

Additional context
sc-28172

Support Snowflake multi-factor authentication

Is your feature request related to a problem? Please describe.
In current snowflake integration, it only supports to login by basic authentication (user/password). If the user enable the MFA, there is no way to use piperider

Describe the solution you'd like
Reference of snowflake profile in dbt

  1. run piperider run
  2. send push notification to Duo Mobile
  3. Approve the request
  4. Continue

Describe alternatives you've considered
N/A

Additional context
N/A

can't use up/down button to select data source in windows terminal

Describe the bug
can't use up/down button to select data source in windows terminal

To Reproduce
Steps to reproduce the behavior:

  1. Execute command: piperider init
  2. When PipeRider asks data source, user can't use up/down button to select data source.

Desktop (please complete the following information):

  • OS: Windows
  • Version: 0.4.1

Have a individual test page in the report so that I can see all the test results for a run

Summary

Current, the run report is only to visualize the table/column profiling result. However, assertions are another key feature for piperider. It is desirable to see the test results by a separate page.

Intended Outcome

  1. In the generated report, we can see separate pages for profiling and testing
  2. Profiling report should be navigated through table/column hierarchy
  3. The testing report should be table-like view with filter and sorting.

How will it work?

  1. Add a testing page here, show the testing result in a data table
    Screen Shot 2022-09-29 at 9 29 35 AM
  2. The frontend part iterate through the json to collect all tests in a list.

sc-28854

`ValueError: Invalid isoformat string` error when running `piperider compare-reports` against a metric

Describe the bug
Running piperider compare-reports --last against a dbt metric results in an error like ValueError: Invalid isoformat string: '2023-04-01 00:00:00'

To Reproduce
Steps to reproduce the behavior:

  1. Setup new virtual environment and run pip install "piperider[bigquery]==0.23.3"
  2. Initialize Piperider with piperider init
  3. Add the piperider tag to a metric configuration file
  4. Run piperider run twice to generate two reports
  5. Run piperider compare-reports --last --debug
  6. See an error like ValueError: Invalid isoformat string: '2023-04-01 00:00:00'

Expected behavior
The compare-reports command should create an HTML report and a Markdown report in the .piperider/comparisons/ directory

Desktop (please complete the following information):

  • OS: Debian GNU/Linux
  • Python Version 3.9.16
  • Version: dbt 1.4.5, dbt metrics 1.4.0, piperider[bigquery]==0.23.3

Additional context
Add any other context about the problem here.

The offending metric configuration can be found below:

version: 2
metrics:
  - name: total_seconds_engaged
    label: Total Seconds Engaged
    model: ref('fct_hits')
    description: "The number of seconds readers spent viewing a page"
    calculation_method: sum
    expression: seconds_engaged
    timestamp: date
    time_grains: [day, week, month, quarter, year, all_time]
    dimensions:
      - article_arc_id
    tags:
      - piperider

The full output of piperider compare-reports --last --debug is attached:

piperider_debug.txt

Support to generate the comparison report with target's tables only

Summary

In #511, we allows to profile the tables for subset of models in a dbt project. It is desirable to compare only the tables which is profiled in the target run.

Intended Outcome

In the comparison report and summary, show only the tables available in the target run.

How will it work?

  1. piperider run --output path/to/base/

  2. Change the model mymodel. Transform the model and downstream models dbt run --select mymodel+

  3. piperider run --dbt-state ./target

  4. Compare the two runs

    piperider compare-reports \
       --base path/to/base/run.json \
       --target .piperider/output/latest/run.json \
       --tables-from=target-only

piperider runs on wrong schema by default

Describe the bug
The command piperider run --table <table_name> points to the wrong schema

To Reproduce
Steps to reproduce the behavior:

  1. Setup environment
Core:
  - installed: 1.4.6
  - latest:    1.4.6 - Up to date!

Plugins:
  - postgres: 1.4.6 - Up to date!
  - redshift: 1.4.0 - Up to date!
  1. Execute command
dbt_core_test.sql: select 1, getdate()
$ dbt run --select dbt_core_test
$ piperider run --table dbt_core_test
  1. See error
DataSource: dev
─────────────────────────────────────────────────────────────────────────────────────────────────────── Validating ───────────────────────────────────────────────────────────────────────────────────────────────────────
everything is OK.
─────────────────────────────────────────────────────────────────────────────────────────────────────── Profiling ────────────────────────────────────────────────────────────────────────────────────────────────────────
[0/1] METADATA      ━━━━━━━━━━━━━━━━━━━━━━━━━━━━━━━━━━━━━━━━━━━━━━━━━━━━━━━━━━━━━━━━━━━━━━━━━━━━━━━━   0/? 0:00:00Error: No such table 'vincent_dbt_dev.dbt_core_test'

Expected behavior
Piperider should get the correct table from schema set in the dbt profiles.yml

Screenshots

15:03:18  Running with dbt=1.4.6
15:03:19  Found 107 models, 4 tests, 1 snapshot, 0 analyses, 699 macros, 1 operation, 0 seed files, 61 sources, 0 exposures, 0 metrics
15:03:19  
15:03:19  Concurrency: 4 threads (target='dev')
15:03:19  
15:03:19  1 of 1 START sql view model dbt_vincentzhx.dbt_core_test ....................... [RUN]
15:03:19  1 of 1 OK created sql view model dbt_vincentzhx.dbt_core_test .................. [CREATE VIEW in 0.31s]
15:03:19  
15:03:19  Running 1 on-run-end hook
15:03:19  1 of 1 START hook: re_data.on-run-end.0 ........................................ [RUN]
15:03:19  1 of 1 OK hook: re_data.on-run-end.0 ........................................... [OK in 0.00s]
15:03:19  
15:03:19  
15:03:19  Finished running 1 view model, 1 hook in 0 hours 0 minutes and 0.87 seconds (0.87s).
15:03:20  
15:03:20  Completed successfully
15:03:20  
15:03:20  Done. PASS=1 WARN=0 ERROR=0 SKIP=0 TOTAL=1

DataSource: dev
─────────────────────────────────────────────────────────────────────────────────────────────────────── Validating ───────────────────────────────────────────────────────────────────────────────────────────────────────
everything is OK.
─────────────────────────────────────────────────────────────────────────────────────────────────────── Profiling ────────────────────────────────────────────────────────────────────────────────────────────────────────
[0/1] METADATA      ━━━━━━━━━━━━━━━━━━━━━━━━━━━━━━━━━━━━━━━━━━━━━━━━━━━━━━━━━━━━━━━━━━━━━━━━━━━━━━━━   0/? 0:00:00Error: No such table 'vincent_dbt_dev.dbt_core_test'

Desktop (please complete the following information):

  • OS: linux
  • Python Version 3.9.4
  • DBT Version 1.4.6

Additional context
Add any other context about the problem here.

allow Snowflake authentication via externalbrowser

It's common for Snowflake users to authenticate using SSO or Snowflake key/pair rather than username/password.

e.g. Jupyter using SSO:

conn = connect(
    user=os.getenv('SNOWFLAKE_USER'),
    account=os.getenv('SNOWFLAKE_ACCOUNT'),
    authenticator="externalbrowser",
)

cursor = conn.cursor()
cursor.execute(sql)

# ... etc...

Great Expectations great_expectations.yml using SSH key/pair:

config_version: 3.0

datasources:
  my_snowflake:
    class_name: Datasource
    module_name: great_expectations.datasource
    execution_engine:
      module_name: great_expectations.execution_engine
      credentials:
        host: <REDACTED>.us-east-1
        username: <REDACTED>
        query:
          schema: <REDACTED>
          warehouse: <REDACTED>
          role: <REDACTED>
        private_key_path: /path/to/key/rsa_key.p8
        private_key_passphrase: <REDACTED>
        drivername: snowflake
      class_name: SqlAlchemyExecutionEngine

It would be great if PipeRider did that too, out-of-the-box. 🚗

Ability to self-host PipeRider

Summary

Currently, there is no easy way to list and view a single runs.

Intended Outcome

Provide a command to run a mini server

piperider server
  • List the runs
  • Show the runs without generated report

How will it work?

  1. The server would initiate a flask server for serving
  2. Provide rest API for listing runs and get a run result
  3. Share the common UI for static report and SPA.

profiler fails when date values span a very large range

I have an edge case in my source data where the range of dates in a column spans an absurdly wide range. These are technically valid dates in Snowflake but, in reality, these extreme values are caused by a data integrity issue.

When I try to profile a table with such extreme date values, PipeRider throws an error:

[1/1]   my_table_with_a_redacted_name          ━━━━━━━╸━━━━━━━━━━━━━━━   4/9 0:00:06
Error: Profiler Exception: ValueError('year 10001 is out of range')

I took a look at the status of the variables in profiler.py and notice that:

dmin = 0001-01-01
dmax = 9221-01-01

Clearly that makes no sense, even if these are technically valid dates.

I was able to get the profiler working, for this table, by increasing the number of buckets. I edited line 1184 in profiler.py. From:

interval_years = math.ceil((dmax.year - dmin.year) / 50)

to:

interval_years = math.ceil((dmax.year - dmin.year) / 10000)

This made the histogram trickier to read (i.e. almost all the values were squished into a handful of buckets), but that's certainly better than an error message and no profiling report:

histogram-is-a-bit-ugly-better-than-no-report

From a users perspective, it's not clear from the error message what action can be taken to get a profiling report. My dirty hack (increasing the number of buckets from 50 to 10k) allowed me to get a profile report. That's better than no profile report.

I'm not sure what the right solution is. I do think it shouldn't just fail when date ranges span a very wide range.

`piperider init` command fails when macros are present in `dbt_project.yml`

Describe the bug
The piperider init command doesn’t complete successfully when there’s jinja in the dbt_project.yml file (even though it looks like this was fixed in #658. Instead it yields an error like:

Error: Failed to load dbt project '<project_yml_filepath>'. 
 Reason: <macro_name> is undefined 

To Reproduce
Steps to reproduce the behavior:

  1. Setup new virtual environment and run pip install "piperider[bigquery]==0.23.0"
  2. Navigate to the root directory of a dbt project whose dbt_project.yml file contains jinja
  3. Execute piperider init and select the appropriate dbt_project.yml filepath
  4. See error

Expected behavior
Expected output

[ DBT ] Use the existing dbt project file: 
<project_yml_filepath>
[ DBT ] By default, PipeRider will profile the models and metrics
with 'piperider' tag
        Apply 'piperider' tag to your models or change the tag in
'.piperider/config.yml'

───────────────────── .piperider/config.yml ─────────────────────
   1 dataSources: []                                             
   2 dbt:                                                        
   3   projectDir: .                                             
   4   tag: piperider                                            
   5                                                             
   6 profiler:                                                   
   7 #   table:                                                  
   8 #     # the maximum row count to profile. (Default unlimited
   9 #     limit: 1000000                                        
  10 #     duplicateRows: false                                  
  11                                                             
  12 telemetry:                                                  
  13   id: <telemetry_id>                      
  14                                                             
───────────────── End of .piperider/config.yml ──────────────────
──────────── Recipe: .piperider/compare/default.yml ─────────────
   1 base:                                                       
   2   branch: main                                              
   3   dbt:                                                      
   4     commands:                                               
   5     - dbt deps                                              
   6     - dbt build                                             
   7   piperider:                                                
   8     command: piperider run                                  
   9 target:                                                     
  10   dbt:                                                      
  11     commands:                                               
  12     - dbt deps                                              
  13     - dbt build                                             
  14   piperider:                                                
  15     command: piperider run                                  
  16                                                             
───────────────────────── End of Recipe ─────────────────────────

Next step:
  Please execute command 'piperider diagnose' to verify 
configuration

Screenshots
If applicable, add screenshots to help explain your problem.

Desktop (please complete the following information):

  • OS: Debian GNU/Linux
  • Python 3.9.16
  • dbt 1.4.5

Additional context
In our particular instance, dbt_project.yml contains three macros:

  • A custom macro used to set a variable value:
vars:
  run_date: "{{ get_current_date() }}"
  • Two nested built-in macros to configure an on-run-end hook:
on-run-end:
  - "{% if target.name == 'prod' %}{{ dbt_artifacts.upload_results(results) }}{% endif %}"

If any of these macros are present, the pipeline init command fails.

Integrate the dbt state in the piperider run

Summary

In dbt, it generate artifacts for each run in the target path. We can treat the snapshot of the artifacts is the state of the dbt run

Intended Outcome

In piperider, we would like to integrate the dbt state for the following features

  1. Profile the tables which is only processed in the run results of the state
  2. Integrate the dbt tests in the run results
  3. Get the table/column description by the manifest in the state

How will it work?

For a dbt data source, run without a dbt state

  1. piperider run
  2. All the tables are profiled, no dbt tests/description are integrated

For a dbt data source, run with dbt state

  1. dbt run --select mymodel+
  2. piperider run --dbt-state ./target
  3. Only the models processed in the dbt are profiled in the piperider

Breaking change

We remove the two options

$ piperider run --dbt-test
$ piperider run --dbt-build

Use the following command instead

$ dbt test
$ piperider run --dbt-state ./target

sc-29554

fe code setup issue

Describe the bug

Local setup and start single report failed.

To Reproduce
Steps to reproduce the behavior:

  1. Setup environment:
node --version              
v14.18.1
  1. Execute command
yarn
yarn run start:single
  1. See error
index.js:19 Uncaught RangeError: Invalid time value
    at DateTimeFormat.formatToParts (<anonymous>)
    at partsTimeZone (index.js:19:1)
    at tzIntlTimeZoneName (index.js:15:1)
    at Object.z (index.js:100:1)
    at index.js:344:1
    at Array.reduce (<anonymous>)
    at format (index.js:337:1)
    at formatInTimeZone (index.js:41:1)
    at formatReportTime (formatters.tsx:20:1)
    at SRTablesListPage (SRTablesListPage.tsx:27:1)
react-dom.development.js:18687 The above error occurred in the <SRTablesListPage> component:

    at SRTablesListPage (http://localhost:3002/static/js/bundle.js:3435:5)
    at component
    at Route (http://localhost:3002/static/js/bundle.js:356378:5)
    at Switch (http://localhost:3002/static/js/bundle.js:356432:5)
    at Router (http://localhost:3002/static/js/bundle.js:356364:69)
    at Suspense
    at AppSingle
    at App
    at EnvironmentProvider (http://localhost:3002/static/js/bundle.js:26937:24)
    at ColorModeProvider (http://localhost:3002/static/js/bundle.js:15589:21)
    at ThemeProvider (http://localhost:3002/static/js/bundle.js:44696:64)
    at ThemeProvider (http://localhost:3002/static/js/bundle.js:32475:27)
    at ChakraProvider (http://localhost:3002/static/js/bundle.js:26228:24)
    at ChakraProvider (http://localhost:3002/static/js/bundle.js:27649:23)

Consider adding an error boundary to your tree to customize error handling behavior.
Visit https://reactjs.org/link/error-boundaries to learn more about error boundaries.
logCapturedError @ react-dom.development.js:18687
react-dom.development.js:26923 Uncaught RangeError: Invalid time value
    at DateTimeFormat.formatToParts (<anonymous>)
    at partsTimeZone (index.js:19:1)
    at tzIntlTimeZoneName (index.js:15:1)
    at Object.z (index.js:100:1)
    at index.js:344:1
    at Array.reduce (<anonymous>)
    at format (index.js:337:1)
    at formatInTimeZone (index.js:41:1)
    at formatReportTime (formatters.tsx:20:1)
    at SRTablesListPage (SRTablesListPage.tsx:27:1)

While in terminal everything looks successful.

Compiled successfully!

You can now view piperider-report in the browser.

  Local:            http://localhost:3002
  On Your Network:  http://192.168.1.159:3002

Note that the development build is not optimized.
To create a production build, use yarn build.

webpack compiled successfully
Files successfully emitted, waiting for typecheck results...
Issues checking in progress...
No issues found.

Expected behavior

Setup run successfully and can serve report locally

Screenshots
If applicable, add screenshots to help explain your problem.

image

Desktop (please complete the following information):

  • OS: macOS
  • Python Version 3.7.10
  • Piperider Version 0.8.0-dev

Additional context

I've followed README.md in static reports folder to init, generated single and comparison report with some sample datasets.

Data source integration: SQL Server

Summary

Data source integration with Microsoft SQL Server

Intended Outcome

  • Support basic authentication: server, port, schema, user, password
  • Supoprt dbt mssql profile

How will it work?

Support new data source in piperider init

Connection bug with dbt-snowflake

Describe the bug
On running the piperider init, there is an error message

Sentry is attempting to send 1 pending error messages
Waiting up to 2 seconds
Press Ctrl-C to quit

However when I run dbt debug , connection is successful

I have tried with dbt-snowflake==1.3 and dbt-snowflake==1.4

To Reproduce
Steps to reproduce the behavior:

  1. Setup environment.

pip install 'piperider[snowflake]'
pip install dbt-snowflake==1.3
pip install markupsafe==2.1.1

  1. Execute command : dbt debug
    Its a success

  2. Execute another command : piperider init

  3. See error:

Error: expected token ',', got 'SNOWFLAKE_PASSWORD'
Sentry is attempting to send 1 pending error messages
Waiting up to 2 seconds
Press Ctrl-C to quit

Expected behavior
Config file is created and piperider is initialised

Desktop (please complete the following information):

  • OS: MacOs
  • Python Version 3.9.13

Can not execute `run` command on Windows. Show error message "[WinError 3] The system cannot find the path specified: 'C'"

Describe the bug
When running the piperider run comment on the Windows platform. It show the following error message.
[WinError 3] The system cannot find the path specified: 'C'

To Reproduce
Steps to reproduce the behavior:

  1. Install piperider on Windows
  2. Setup piperider project
  3. Run piperider by piperider run

Expected behavior
No error

Desktop (please complete the following information):

  • OS: Windows
  • Python Version: 3.9
  • Version: 0.4.2

Additional context
Add any other context about the problem here.

Support Custom Metric

Introduction

From in-app feedback

It would be nice if I could customize the metrics as well (not just assertions), I'm looking to fulfill the following metrics: skewness, mode, kurtosis, number of values with leading and trailing spaces, number of values with trailing spaces ONLY, number of values with leading spaces ONLY.

Please provide documentation if there is a way to do this, I'm currently trying to understand how custom assertions work but it would be much appreciated if we can customize the metrics as well.

Intended outcome

TBD

How does it works

TBD

Allows to run test without profiling

Summary

Run profiler is costly and time-consumer. It would be good to run tests only.

Intended Outcome

  1. New command piperider test
  2. Do the test relevant queries only
  3. Get the run result.

How will it work?

  1. For all current built-in assertion, if we found the profiling result is not available, do the query.
  2. Profiling engine and assertion engine can share some query packages

sc-28964

Recommend Projects

  • React photo React

    A declarative, efficient, and flexible JavaScript library for building user interfaces.

  • Vue.js photo Vue.js

    🖖 Vue.js is a progressive, incrementally-adoptable JavaScript framework for building UI on the web.

  • Typescript photo Typescript

    TypeScript is a superset of JavaScript that compiles to clean JavaScript output.

  • TensorFlow photo TensorFlow

    An Open Source Machine Learning Framework for Everyone

  • Django photo Django

    The Web framework for perfectionists with deadlines.

  • D3 photo D3

    Bring data to life with SVG, Canvas and HTML. 📊📈🎉

Recommend Topics

  • javascript

    JavaScript (JS) is a lightweight interpreted programming language with first-class functions.

  • web

    Some thing interesting about web. New door for the world.

  • server

    A server is a program made to process requests and deliver data to clients.

  • Machine learning

    Machine learning is a way of modeling and interpreting data that allows a piece of software to respond intelligently.

  • Game

    Some thing interesting about game, make everyone happy.

Recommend Org

  • Facebook photo Facebook

    We are working to build community through open source technology. NB: members must have two-factor auth.

  • Microsoft photo Microsoft

    Open source projects and samples from Microsoft.

  • Google photo Google

    Google ❤️ Open Source for everyone.

  • D3 photo D3

    Data-Driven Documents codes.