GithubHelp home page GithubHelp logo

ismms-himc / clustergrammer-gl Goto Github PK

View Code? Open in Web Editor NEW
23.0 3.0 18.0 33.39 MB

WebGL Clustergrammer JavaScript Library

Home Page: https://ismms-himc.github.io/clustergrammer-gl/

License: MIT License

JavaScript 99.73% HTML 0.07% CSS 0.02% Python 0.03% Jupyter Notebook 0.15%
webgl regl biology heatmap hacktoberfest

clustergrammer-gl's Introduction

Clustergramer

NPM NPM

The Clustergrammer-GL repo contains the in-development WebGL/regl version of Clustergrammer. See live example.

Using Clustergrammer-GL within Clustergrammer2

Clustergrammer-GL is being used by the Jupyter Widget Clustergrammer2. Please see examples below on using this widget.

Basic Example of Running Clustergrammer2 on MyBinder

badge Nbviewer

Running Clustergrammer2

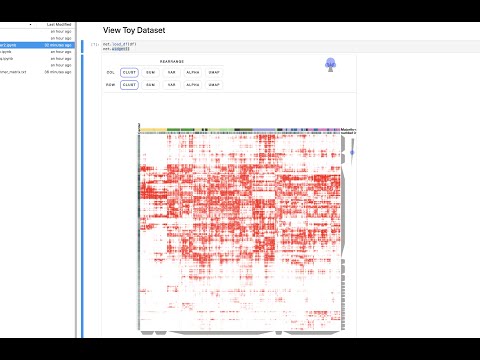
The above notebook shows how Clustergrammer2 can be used to load a small dataset and visualize a large random DataFrame. By running the notebook on MyBinder using Jupyter Lab it can also be used to visualize a user uploaded dataset. Please see the video tutorial above for more information.

For additional examples and tutorials please see:

2,700 PBMC scRNA-seq

badge Nbviewer

2,700 PBMC scRNA-seq

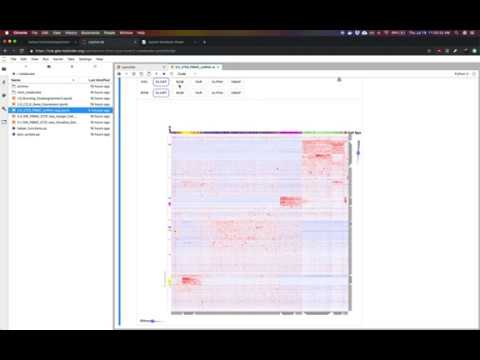
Single cell RNA-seq (scRNA-seq) is a powerful method to interrogate gene expression across thousands of single cells. This method produces thousands of measurements (single cells) across thousands of dimensions (genes). This notebook uses Clustergrammer2 to interactively explore an example dataset measuring the gene expression of 2,700 PBMCs obtained from 10X Genomics. Bulk gene expression signatures of cell types from CIBERSORT were used to obtain a tentative cell type for each cell. Please see the video tutorial above for more information.

Bundling

We're using a local version of packd to make a bundle of Clustergrammer-GL:

➜  packd git:(master) npm start

> [email protected] start /Users/nickfernandez/Documents/packd
> node server

packd debug started at Sat, 23 May 2020 17:15:21 GMT
listening on localhost:9000
packd info ::1 - - [Sat, 23 May 2020 17:15:30 GMT] "GET / HTTP/1.1"
packd info ::1 - - [Sat, 23 May 2020 17:15:41 GMT] "GET /clustergrammer-gl HTTP/1.1"
packd info ::1 - - [Sat, 23 May 2020 17:15:41 GMT] "GET /[email protected] HTTP/1.1"
packd info [clustergrammer-gl] requested package
packd info [clustergrammer-gl] is not cached
packd info [clustergrammer-gl] fetching https://registry.npmjs.org/clustergrammer-gl/-/clustergrammer-gl-0.15.1.tgz
packd info [clustergrammer-gl] extracting to /Users/nickfernandez/Documents/packd/.tmp/ae4601021098ba82a59ab5c71569d10fa8897211/package
packd info [clustergrammer-gl] running  /Users/nickfernandez/Documents/packd/node_modules/.bin/npm install --production
packd info [clustergrammer-gl] added 168 packages from 123 contributors and audited 871 packages in 8.022s
packd info [clustergrammer-gl] found 3 vulnerabilities (2 low, 1 high)
packd info [clustergrammer-gl]   run `npm audit fix` to fix them, or `npm audit` for details
packd info [clustergrammer-gl]
packd info [clustergrammer-gl] npm WARN deprecated [email protected]: fsevents 1 will break on node v14+ and could be using insecure binaries. Upgrade to fsevents 2.
packd info [clustergrammer-gl] npm WARN deprecated [email protected]: core-js@<3 is no longer maintained and not recommended for usage due to the number of issues. Please, upgrade your dependencies to the actual version of core-js@3.
packd info [clustergrammer-gl] npm notice created a lockfile as package-lock.json. You should commit this file.
packd info [clustergrammer-gl] npm WARN [email protected] requires a peer of webpack@^1 || ^2 || ^3 but none is installed. You must install peer dependencies yourself.
packd info [clustergrammer-gl] npm WARN [email protected] requires a peer of webpack@1 || 2 || ^2.1.0-beta || ^2.2.0-rc but none is installed. You must install peer dependencies yourself.
packd info [clustergrammer-gl]
packd info [clustergrammer-gl] No ES2015 module found, using Browserify
packd info [clustergrammer-gl] bundled using Browserify
packd info [clustergrammer-gl] minifying
packd info [clustergrammer-gl] serving 266469 bytes

This was discussed on the Observable discussion board (https://talk.observablehq.com/t/help-with-reactive-updates-from-custom-library/2907/11) - and we followed the instructions from: https://github.com/Rich-Harris/packd#hosting-an-instance.

Licensing

Clustergrammer-GL is being developed by the Human Immune Monitoring Center and Ma'ayan lab at the Icahn School of Medicine at Mount Sinai. More information about Clustergrammer's license can be found in Clustergrammer's Documentation.

Please contact us for support, licensing questions, comments, and suggestions.

Releasing

  • Update versions in package.json
  • Update version in main.js
  • Set webpack to make all builds
  • Run npm publish.

clustergrammer-gl's People

Contributors

cornhundred avatar dependabot[bot] avatar

Stargazers

 avatar  avatar  avatar  avatar  avatar  avatar  avatar  avatar  avatar  avatar  avatar  avatar  avatar  avatar  avatar  avatar  avatar  avatar  avatar  avatar  avatar  avatar  avatar

Watchers

 avatar  avatar  avatar

clustergrammer-gl's Issues

Toggle Z-score and show non-zscored data

Use the mean and variance values (that are shown as value based categories) to display both the Z-scored and original values when mousing over a matrix cell.

dendrogram interactions

Clicking the dendrogram should bring up the dendrogram tooltip, but allow the user to interact with it, e.g. stay visible permanently until closed again by clicking the dendrogram (or an x in the tooltip). I will probably need to create a separate class for this tooltip to prevent it from being hidden and to prevent additional tooltips from popping up while it is visible.

The tooltip needs:

  • text selection box for rows/columns (e.g. comma separated)
  • wrap around text for row and column cluster selection will instead have external widget view of selected terms see Observable examples
  • run enrichment analysis via Enrichr
  • export genes to Enrichr
  • crop button to zoom into this section
    • will be useful for zooming into clusters of genes
    • will be useful for running front-end enrichment analysis on a cluster of genes

Setting up re-initialization (as well as destroying previous contexts) of visualization. Need to re-create network filtering as seen here

https://github.com/MaayanLab/clustergrammer/blob/master/src/network/filter_network_using_new_nodes.js

Custom row/column information mouseover

Users should be able to pass a row/column dictionary with additional information (e.g. longer names or other information) as an argument. This will display when mousing over rows/columns instead of making a GET request to the Harmonizome.

For instance

data download and metadata/categories button

Is your feature request related to a problem? Please describe.
It can be useful to download the data and/or metadata/categories that is being visualized in a heatmap.

Describe the solution you'd like
We want to implement a button that triggers a download of the data matrix. This can also be very helpful for saving manual categories on a static HTML and then downloading the CSV in order to save manual categorization.

Describe alternatives you've considered
We may want to have separate downloads for the data and row/col metadata.

Additional context
None

observable-hq example

After issue #1 is finished, work on some Observable-hq examples.

  • Les Miserables observable notebook

  • Dashboard notebook for exploration of single cell RNA-seq data

slow down zooming scroll speed

Is your feature request related to a problem? Please describe.
I want to reduce the speed of scrolling.

Describe the solution you'd like
Scroll zooming should happen more slowly.

Describe alternatives you've considered
None

implement front-end clustering

Use the custom version of clusterfck (https://harthur.github.io/clusterfck/) to implement front-end clustering (e.g. load csv of data and cluster) and re-clustering (e.g. after performing arbitrary filtering). This will be useful for simplifying the deployment of Clustergrammer-gl (no need for clustering on python), Clustergrammer2 arbitrary re-clustering, and deploying Clustergrammer-gl as a standalone library on observable.hq.

install on local machine

Hi,
I'm impressed by clustergrammer-gl using the toy data.
I would like to try it with my large matrix (40000 X 100) on my machine. It seems there is no info about how to install it on a local machine.
Sorry for the trivial question, I'm pretty new to jupyter.
Thanks!

Rendering error under React

Describe the bug
Clustergrammer heatmap doesn't render well using clustergrammer2 generated network and clustergrammer-gl for rendering. Here is the piece of code in charge of rendering:

import cgm from 'clustergrammer-gl'

const ReactClustergrammer = ({ root, height, width, maxWidth, className, onColumnLabelClick, ...args }) => {
  const draw = () => {
    let network = args.network;
    cgm({
      network,
      viz_width: 900,
      viz_height: 900,
      use_hzome: true,
      root: `#${root}`,
    });
  };

  React.useEffect(() => {
    if (typeof window !== 'undefined' && args.network !== null) {
      window.d3 = d3;

      draw();
    }
  }, [args.network]);

  return <div id={root} className={className} style={{ height, width: width, maxWidth: maxWidth }}></div>;
};

Depending on the parameters it raises different problems:

  • with parameter root: '#${root}' it doesn't render at all but without any error
  • with parameter container: '#${root}' it raises the following error TypeError: targetel.getScreenCTM is not a function that seems to be linked to d3-tip .

Dependencies

clustergrammer-gl@^0.23.0:
  version "0.23.0"
  resolved "https://registry.yarnpkg.com/clustergrammer-gl/-/clustergrammer-gl-0.23.0.tgz#0321df460419221d2d2ccda9b2a54384b10d8007"
  integrity sha512-bAhd9EzyNRUspBKEaflo/XTPhkiD3zro+OK/jzYfkjijQ3iRNF1R6qirq863PEFtwKCFpVCzjfdRnyqUpz1WDA==
  dependencies:
    axios "0.19.0"
    d3 "5.15.0"
    d3-tip v0.9.1
    eases "^1.0.8"
    gl-mat4 "^1.1.4"
    gl-vec4 "^1.0.1"
    ify-loader "^1.1.0"
    mathjs "3.17.0"
    mouse-change "^1.4.0"
    mouse-event-offset "3.0.2"
    normalized-interaction-events "2.0.1"
    pako "1.0.6"
    regl "^1.3.7"
    underscore "1.8.3"
    util-extend "1.0.3"
    vectorize-text "^3.2.1"
    xtend "^4.0.1"

Desktop:

  • macOS monterey 12.4

custom matrix tile color scheme

Is your feature request related to a problem? Please describe.
I want to be able to change the color scheme - currently it is only red/blue for positive/negative values, respectively

Describe the solution you'd like
I would like to be able to pass in two colors in the arguments JSON (e.g. named colors or hexcode) and have those override the positive/negative colors.

Additional context
This issue is necessary for resolving this issue in Clustergrammer2 ismms-himc/clustergrammer2#39

Zoom/Crop into selection via brush selection

Allow users to selection section of the heatmap to zoom into.

Do not actually crop into this section, but just zoom in. Need to be careful about tracking zoom with this function. Also, improve camera resetting, ideally reset camera after zooming/panning event is over.

I'm going to probably just make this work through cropping. I'll build a general method to remake the entire viz based on filtering for an arbitrary set of rows/columns (dendrogram will not be shown, rearrange buttons will either be deactivated or reflect on-the-fly calculations). This general filter network method will be built off this method (https://github.com/MaayanLab/clustergrammer/blob/master/src/network/filter_network_using_new_nodes.js) and will be generalized to support dendrogram cropping, crop to zoomed area, and zoom into selection.

  • get arbitrary network row/col filtering working
  • set up SVG brush crop similar to brush_crop_matrix
    • need to do the algebra to find selected rows/cols on brushing

npm packaging

Hello, I would like to try clustergrammer-gl in my application - may I ask you have a plan to publish this to npm registry soon?

improve dendrogram behavior and viz

Is your feature request related to a problem? Please describe.
We would like to have improved granular control of where slices are taken in the dendrogram.

Describe the solution you'd like

  • We would like to take slices of the dendrogram at any level.
  • we want to visualize the entire visualization tree (perhaps as stacked triangles)

Describe alternatives you've considered
We could take more slices evenly along the dendrogram.

Additional context
This has been a feature-request for Clustergrammer-JS for a while. It will be implemented here first. See MaayanLab/clustergrammer#8

Improve row/column Label Behavior

My matrix has very long sample names as row names and GO/KEGG annotations as column names. These are mostly hidden from view in the Web API and jupyter widget version. Also, mousing over a cell to see its annotations is not feasible when the hovertext only lasts 2 seconds. A feature to accommodate longer names or infinite hovertext time would make my experience using the tool flow better.

In the shorter term if you had any hack-way of going about getting these row/column names to display fully I would be keen to try it.

Tooltip to get visible rows/cols by clicking heatmap

Is your feature request related to a problem? Please describe.
We would like to be able to zoom into the heatmap and export the visible rows and columns.

Describe the solution you'd like
Clicking on the heatmap arena should bring up a dendrogram like tooltip that shows the rows and columns and makes them available in different formats.

Describe alternatives you've considered
None

Additional context
None

Variable size and Full Screen

Variable Size and Full Screen

Have the heatmap be variable width/height (or at least variable width and square). This functionality will allow a variable width Jupyter Widget ismms-himc/clustergrammer2#2 (comment)

Thoughts on Implementing Full Screen Mode

Add button to toggle between full screen and normal view. Have control panel float above the visualization. Maybe make a new WebGL context that is positioned on top of everything else (or maybe make a modal type full screen).

gene Harmonizome link

In addition to showing the Harmonizome Refseq name and description add a clickable link to the Harmonizome and/or Uniprot gene pages (clicking on name will make the permanent).

camera update and resetting with custom zoom/pan

Sometimes the camera and zoom object can get out of sync. They are reset when the user zooms all the way out (as a fail safe). We should ultimately prevent this mis-syncing from happening or add an additional fail safe that resets the camera when the user has finished interacting with the visualization.

gene box plot across categories

Is your feature request related to a problem? Please describe.
We want to be able to visualize the expression of a gene across different categories of cells.

Describe the solution you'd like
Clicking on a gene should show a box plot with the expression of that gene across each category.

Describe alternatives you've considered
We could have a heatmap that displays the average expression of all genes across categories, but that does not generalize well to multiple types of categories.

Additional context
We have a similar modular approach to enrichment analysis we're working on using Observable where we show the enrichment results as separate D3 barplots

https://observablehq.com/@ismms-himc/clustergrammer-gl-and-enrichr

We want to show the box plots as separate plots in this same manner.

callback function on common interactions

Is your feature request related to a problem? Please describe.
Clustergrammer-GL is being used by Clustergrammer2 and information needs to be passed from Clustergrammer-GL to the Clustergrammer2 widget. We need to enable callback functions to be passed to Clustergrammer-GL. These can be used for instance to: update the widget state on mouseover.

Describe the solution you'd like
Have callback functions as arguments to Clustergrammer-GL. Have these callback functions run on specific interaction events (e.g. click, mouseover).

Describe alternatives you've considered
I have not considered alternatives.

Additional context
This is going to be useful for Clustergrammer2 widget functionality.

toggle on/off Harmonizome gene lookup

Is your feature request related to a problem? Please describe.
We want to be able to shut off the gene lookup feature using the Harmonizome for datasets where it is not appropriate.

Describe the solution you'd like
We should have an option passed to Clustergrammer-GL (and Clustergrammer2 should pass to Clustergrammer-GL) that says no Hzome lookup.

normalization section in control panel

Is your feature request related to a problem? Please describe.
We want to be able to run and undo normalization procedures on data (e.g. undo Z-score, run Z-score, divide columns by sum, etc).

Describe the solution you'd like
We currently have a simply toggle button called Z-scored that shows up when a dataset has been initially Z-scored. We want to replace this with a more complicated normalization menu (similar to the reorder and recluster menus). This will allow users to run/undo normalization procedures on rows/columns (e.g. undo row Z-score then undo column divide by sum (UMI norm for scRNA-seq data)).

Describe alternatives you've considered
N.A.

Additional context
Depending on the state of incoming data we will need to allow certain calculations to be run and others not to be which depends on the normalization steps that the data has undergone.

To Do

  • fix row reordering with initialized z-scored data

pre-calculate text triangles for all letters/numbers and then construct strings from there

In order to speed up the calculation of text triangles, we could try to pre-calculate all letters and numbers and then construct labels etc. from the single letter position arrays. We would have to keep track of spacing between letters so this might be tedious.

Also, in terms of reducing the size of the JavaScript, we could try making a smaller text2vect that only produces text triangles.

Initial order button (probably replace alphabetical)

Some users want to visualize the data in its original order. This may be some special configuration of rows/columns that is not obtainable with other ordering mechanisms (other than value-based-categories).

We will likely replace the alphabetical ordering button, since this button is really only used as a temporary replacement for row/column searching, which will be addressed with this issue #23

control panel not rendering correctly in some browsers

Describe the bug
The blue rounded squares of the control panel are not being rendered correctly in the Firefox browser. We think this is an issue with defining the SVG rendering since we have seen that Chrome seems to be more lenient about syntax rules.

To Reproduce

  1. Open heatmap in Mozilla and see no blue button outlines.

Expected behavior
We expect to see the selected button have a blue rounded square.

Desktop (please complete the following information):

  • OS: MacOS
  • Browser: Chrome and Firefox

Canvas container undefined in Vue application

First and foremost this is an amazing library. Thank you for your work.

I am trying to implement clustergrammer-gl in a Vue application but I am running into errors.

clustergrammer-gl.node.js?3773:42556 Uncaught TypeError: Cannot read property '0' of undefined
    at clustergrammer_gl (clustergrammer-gl.node.js?3773:42556)
    at VueComponent.renderHeatmap (BxHeatmap.vue?de86:45)
    at <anonymous>:1:6

coming from this line:
var canvas_container = d3.select(container).select('.canvas-container')[0][0];

import * as clustergrammer from 'clustergrammer-gl';
this.heatmapInstance = clustergrammer({
        container: '#heatmap',
        network: this.heatmapJSON,
        viz_height: 1000,
        viz_width: 1000,
      });

where this.heatmapJSON is a viz_json generated from clustergrammer-py.

It works with the clustergrammer-js but not the gl lib.

Please let me know if theres something I am not doing correctly.

value-based-category histograms for clusters

Is your feature request related to a problem? Please describe.
We want to be able to see the distribution of value-based-categories in a selected cluster (e.g. hovering over a dendrogram).

Describe the solution you'd like
Show a histogram of the values on mouseover, etc.

Describe alternatives you've considered
Alternatively, we could just show a box plot.

Additional context
This issue was originally raised here MaayanLab/clustergrammer#14, but will be addressed in Clustergrammer-GL first.

Make Observable HQ Improvements

We received the following recommendations from the Observable Discourse page (https://talk.observablehq.com/t/help-with-reactive-updates-from-custom-library/2907):

  • Clustergrammer-GL requires that the container be inserted into the DOM before initializing, and requires a globally-unique identifier for that container. If it didn’t have these requirements, it would be easier to initialize in Observable (where cells normally run with detached DOM elements, and only insert them into the DOM by returning a value at the end).

  • The most natural way to make Clustergrammer-GL reactive would be for it to emit custom events when things change. I did that manually by intercepting when some internal parameters are set, and by listening to browser native events (mousemove). But if Clustergrammer-GL emitted these events itself, it’d be more straightforward to expose those as reactive values in Observable using Generators.observe.

  • It’s best to avoid bundle.run in notebooks, as it isn’t very reliable. I re-attached the generated bundle to your notebook, but if you published an AMD- or UMD-compatible bundle to npm, then folks could require("clustergrammer-gl") and it would work out of the box.

Recommend Projects

  • React photo React

    A declarative, efficient, and flexible JavaScript library for building user interfaces.

  • Vue.js photo Vue.js

    🖖 Vue.js is a progressive, incrementally-adoptable JavaScript framework for building UI on the web.

  • Typescript photo Typescript

    TypeScript is a superset of JavaScript that compiles to clean JavaScript output.

  • TensorFlow photo TensorFlow

    An Open Source Machine Learning Framework for Everyone

  • Django photo Django

    The Web framework for perfectionists with deadlines.

  • D3 photo D3

    Bring data to life with SVG, Canvas and HTML. 📊📈🎉

Recommend Topics

  • javascript

    JavaScript (JS) is a lightweight interpreted programming language with first-class functions.

  • web

    Some thing interesting about web. New door for the world.

  • server

    A server is a program made to process requests and deliver data to clients.

  • Machine learning

    Machine learning is a way of modeling and interpreting data that allows a piece of software to respond intelligently.

  • Game

    Some thing interesting about game, make everyone happy.

Recommend Org

  • Facebook photo Facebook

    We are working to build community through open source technology. NB: members must have two-factor auth.

  • Microsoft photo Microsoft

    Open source projects and samples from Microsoft.

  • Google photo Google

    Google ❤️ Open Source for everyone.

  • D3 photo D3

    Data-Driven Documents codes.