GithubHelp home page GithubHelp logo

jgehrcke / github-repo-stats Goto Github PK

View Code? Open in Web Editor NEW
295.0 4.0 39.0 437 KB

GitHub Action for advanced repository traffic analysis and reporting

License: Apache License 2.0

Python 68.83% Dockerfile 2.08% Shell 13.72% CSS 12.52% HTML 1.64% Makefile 1.21%
monitoring statistics visualization

github-repo-stats's Introduction

github-repo-stats

This is a GitHub Action originally built to overcome the 14-day limitation of GitHub's built-in traffic statistics.

Run this daily to collect potentially valuable data.

According to the motto: a data snapshot each day keeps the doctor away 🍎

See this Action in Marketplace.

High-level method description:

  • This GitHub Action runs once per day. Each run yields a snapshot of repository traffic statistics (influenced by the past 14 days). Snapshots are persisted via git.
  • Each run performs data analysis on all individual snapshots and generates a report from the aggregate — covering an arbitrarily long time frame.

Looking for a quick start? Follow the simple tutorial in the Wiki.

Demo

Demo 1:

Demo 2:

For more use cases (and their setup), see "Used by" section below.

Highlights

  • The report is generated in two document formats: HTML and PDF.
  • The HTML report resembles how GitHub renders Markdown and is meant to be exposed via GitHub pages.
  • Charts are based on Altair/Vega.
  • The PDF report contains vector graphics.
  • Data updates, aggregation results, and report files are stored in the git repository that you install this Action in: this Action commits changes to a special branch. No cloud storage or database needed. As a result, you have complete and transparent history for data updates and reports, with clear commit messages, in a single place.
  • The observed repository (the one to build the report for) can be different from the repository you install this Action in.
  • The HTML report can be served right away via GitHub pages (that is how the demo above works).
  • Careful data analysis: there are a number of traps (example) when aggregating data based on what the GitHub Traffic API returns. This project tries to not fall for them. One goal of this project is to perform advanced analysis where possible.

Report content

  • Traffic stats:
    • Unique and total views per day
    • Unique and total clones per day
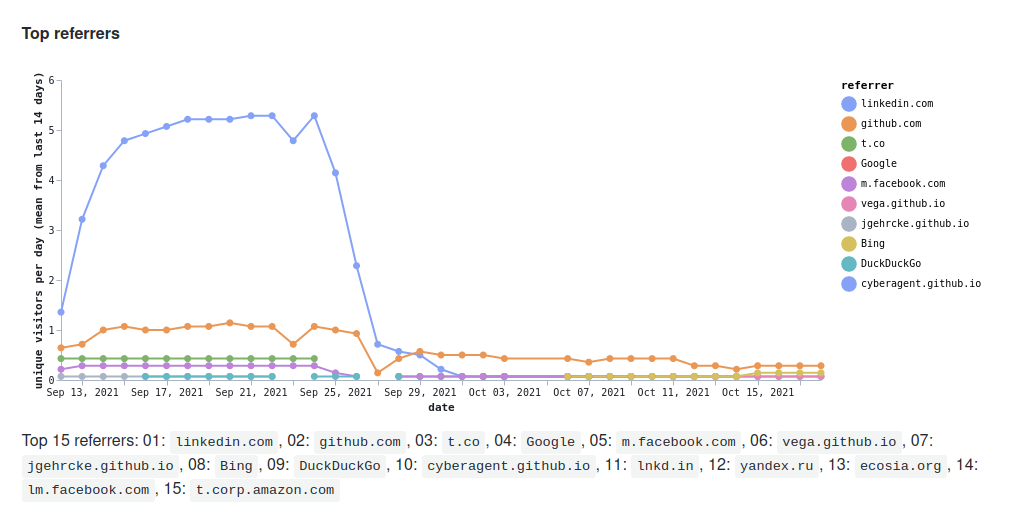
    • Top referrers (where people come from when they land in your repository)
    • Top paths (what people like to look at in your repository)
  • Evolution of stargazers
  • Evolution of forks

Credits

This walks on the shoulders of giants:

  • Pandoc for rendering HTML from Markdown.
  • Altair and Vega-Lite for visualization.
  • Pandas for data analysis.
  • The CPython ecosystem which has always been fun for me to build software in.

Documentation

Terminology: stats repository and data repository

Naming is hard :-). Let's define two concepts and their names:

  • The stats repository is the repository to fetch stats for and to generate the report for.
  • The data repository is the repository to store data and report files in. This is also the repository where this Action runs in.

Let me know if you can think of better names.

These two repositories can be the same. But they don't have to be :-).

That is, you can for example set up this Action in a private repository but have it observe a public repository.

Setup

This section contains brief instructions for a scenario where the data repository is different from the stats repository. For a more detailed walkthrough (showing how to greate a personal access token, and also which git commands to use) please follow the Tutorial in the wiki.

Example scenario:

  • stats repository: bob/nice-project
  • data repository: bob/private-ghrs-data-repo

Create a GitHub Actions workflow file in the data repository (in the example this is the repo bob/private-ghrs-data-repo). Example path: .github/workflows/repostats-for-nice-project.yml.

Example workflow file content with code comments:

on:
  schedule:
    # Run this once per day, towards the end of the day for keeping the most
    # recent data point most meaningful (hours are interpreted in UTC).
    - cron: "0 23 * * *"
  workflow_dispatch: # Allow for running this manually.

jobs:
  j1:
    name: repostats-for-nice-project
    runs-on: ubuntu-latest
    steps:
      - name: run-ghrs
        uses: jgehrcke/github-repo-stats@RELEASE
        with:
          # Define the stats repository (the repo to fetch
          # stats for and to generate the report for).
          # Remove the parameter when the stats repository
          # and the data repository are the same.
          repository: bob/nice-project
          # Set a GitHub API token that can read the GitHub
          # repository traffic API for the stats repository,
          # and that can push commits to the data repository
          # (which this workflow file lives in, to store data
          # and the report files).
          ghtoken: ${{ secrets.ghrs_github_api_token }}

Note: the recommended way to run this Action is on a schedule, once per day. Really.

Note: defining ghtoken: ${{ secrets.ghrs_github_api_token }} is required. In the data repository (where the action is executed) you need to have a secret defined, with the name GHRS_GITHUB_API_TOKEN (of course you can change the name in both places). The content of the secret needs to be an API token that has the repo scope. Follow the tutorial for precise instructions.

Config parameter reference

In the workflow file you can set various configuration parameters. They are specified and documented in the action.yml file (the reference). Here is a quick description, for convenience:

  • ghtoken: GitHub API token for reading the GitHub repository traffic API for the stats repo, and for pushing commits to the data repo. Required.
  • repository: Repository spec (<owner-or-org>/<reponame>) for the repository to fetch statistics for. Default: ${{ github.repository }} (the repo this Action runs in).
  • databranch: Branch to push data to (in the data repo). Default: github-repo-stats
  • ghpagesprefix: Set this if the data branch in the data repo is exposed via GitHub pages. Must not end with a slash. Example: https://jgehrcke.github.io/ghrs-test Default: none

It is recommended that you create the data branch and delete all files from that branch before setting this Action up in your repository, so that this data branch appears as a tidy environment. You can of course remove files from that branch at any other point in time, too.

Tracking multiple repositories via matrix

The GitHub Actions workflow specification language allows for defining a matrix of different job configurations through the jobs.<job_id>.strategy.matrix directive. This can be used for efficiently tracking multiple stats repositories from within the same data repository.

Example workflow file:

name: fetch-repository-stats
concurrency: fetch-repository-stats

on:
  schedule:
    - cron: "0 23 * * *"
  workflow_dispatch:

jobs:
  run-ghrs-with-matrix:
    name: repostats-for-nice-projects
    runs-on: ubuntu-latest
    strategy:
      matrix:
        # The repositories to generate reports for.
        statsRepo: ['bob/nice-project', 'alice/also-nice-project']
      # Do not cancel&fail all remaining jobs upon first job failure.
      fail-fast: false
      # Help avoid commit conflicts. Note(JP): this should not be
      # necessary anymore, feedback appreciated
      max-parallel: 1
    steps:
      - name: run-ghrs
        uses: jgehrcke/github-repo-stats@RELEASE
        with:
          repository: ${{ matrix.statsRepo }}
          ghtoken: ${{ secrets.ghrs_github_api_token }}

Developer notes

CLI tests

Here is how to run bats-based checks from within a checkout:

$ git clone https://github.com/jgehrcke/github-repo-stats
$ cd github-repo-stats/

$ make clitests
...
1..5
ok 1 analyze.py: snapshots: some, vcagg: yes, stars: some, forks: none
ok 2 analyze.py: snapshots: some, vcagg: yes, stars: none, forks: some
ok 3 analyze.py: snapshots: some, vcagg: yes, stars: some, forks: some
ok 4 analyze.py: snapshots: some, vcagg: no, stars: some, forks: some
ok 5 analyze.py + pdf.py: snapshots: some, vcagg: no, stars: some, forks: some

Lint

$ make lint
...
All done! ✨ 🍰 ✨
...

local run of entrypoint.sh

Set environment variables, example:

export GITHUB_REPOSITORY=jgehrcke/ghrs-test
export GITHUB_WORKFLOW="localtesting"
export INPUT_DATABRANCH=databranch-test
export INPUT_GHTOKEN="c***1"
export INPUT_REPOSITORY=jgehrcke/covid-19-germany-gae
export INPUT_GHPAGESPREFIX="none"
export GHRS_FILES_ROOT_PATH="/home/jp/dev/github-repo-stats"
export GHRS_TESTING="true"

(for an up-to-date list of required env vars see .github/workflows/prs.yml)

Run in empty directory. Example:

cd /tmp/ghrstest
rm -rf .* *; bash /home/jp/dev/github-repo-stats/entrypoint.sh

Further resources

Used by

A few rather randomly picked use cases:

github-repo-stats's People

Contributors

davidpfarrell avatar fboemer avatar flaix avatar gautamkrishnar avatar jgehrcke avatar olets avatar snipe avatar

Stargazers

 avatar  avatar  avatar  avatar  avatar  avatar  avatar  avatar  avatar  avatar  avatar  avatar  avatar  avatar  avatar  avatar  avatar  avatar  avatar  avatar  avatar  avatar  avatar  avatar  avatar  avatar  avatar  avatar  avatar  avatar  avatar  avatar  avatar  avatar  avatar  avatar  avatar  avatar  avatar  avatar  avatar  avatar  avatar  avatar  avatar  avatar  avatar  avatar  avatar  avatar  avatar  avatar  avatar  avatar  avatar  avatar  avatar  avatar  avatar  avatar  avatar  avatar  avatar  avatar  avatar  avatar  avatar  avatar  avatar  avatar  avatar  avatar  avatar  avatar  avatar  avatar  avatar  avatar  avatar  avatar  avatar  avatar  avatar  avatar  avatar  avatar  avatar  avatar  avatar  avatar  avatar  avatar  avatar  avatar  avatar  avatar  avatar  avatar  avatar  avatar

Watchers

 avatar  avatar  avatar  avatar

github-repo-stats's Issues

analyse_top_x_snapshots: does not handle altair.utils.data.MaxRowsError

Seen in my own testing repo:

220514-23:20:27.784 INFO: df[views_unique_norm] min: 0.07142857142857142, max: 8.5
220514-23:20:27.784 INFO: df[views_unique_norm]: use symlog scale, because range > 8
220514-23:20:27.784 INFO: custom time window for top referrer plot: ('2020-12-01', '2022-05-14')
Traceback (most recent call last):
  File "/analyze.py", line 1596, in <module>
    main()
  File "/analyze.py", line 152, in main
    analyse_top_x_snapshots("referrer", gen_date_axis_lim((df_vc_agg,)))
  File "/analyze.py", line 680, in analyse_top_x_snapshots
    chart_spec = chart.to_json(indent=None)
  File "/usr/local/lib/python3.10/site-packages/altair/utils/schemapi.py", line 373, in to_json
    dct = self.to_dict(validate=validate, ignore=ignore, context=context)
  File "/usr/local/lib/python3.10/site-packages/altair/vegalite/v4/api.py", line 2020, in to_dict
    return super().to_dict(*args, **kwargs)
  File "/usr/local/lib/python3.10/site-packages/altair/vegalite/v4/api.py", line 374, in to_dict
    copy.data = _prepare_data(original_data, context)
  File "/usr/local/lib/python3.10/site-packages/altair/vegalite/v4/api.py", line 89, in _prepare_data
    data = _pipe(data, data_transformers.get())
  File "/usr/local/lib/python3.10/site-packages/toolz/functoolz.py", line 630, in pipe
    data = func(data)
  File "/usr/local/lib/python3.10/site-packages/toolz/functoolz.py", line 306, in __call__
    return self._partial(*args, **kwargs)
  File "/usr/local/lib/python3.10/site-packages/altair/vegalite/data.py", line 19, in default_data_transformer
    return curried.pipe(data, limit_rows(max_rows=max_rows), to_values)
  File "/usr/local/lib/python3.10/site-packages/toolz/functoolz.py", line 630, in pipe
    data = func(data)
  File "/usr/local/lib/python3.10/site-packages/toolz/functoolz.py", line 306, in __call__
    return self._partial(*args, **kwargs)
  File "/usr/local/lib/python3.10/site-packages/altair/utils/data.py", line 80, in limit_rows
    raise MaxRowsError(
altair.utils.data.MaxRowsError: The number of rows in your dataset is greater than the maximum allowed (5000). For information on how to plot larger datasets in Altair, see the documentation
+ ANALYZE_ECODE=1
error: analyze.py returned with code 1 -- exit.

Feature request: consolidate stats from multiple repositories into a single report

It's great to be able to collect data from multiple repositories using the jobs.<job_id>.strategy.matrix directive however it would also be really useful to easily compare related repositories with a single consolidated report.

In the mean time I've had a go at hacking together a script to collect together data from the ghrs-data directories, which seems to be working so far 🤞

https://github.com/cicsdev/repo-stats/blob/main/scripts/cicsdev-summary.sh

Several questions after first use: actions.yaml, PR to main, using GH Pages

Hi,
thanks for workflow, can I ask a couple of questions:

  • what is actions.yml file mentioned in README? Where is it suppose to be placed?
  • After I run my workflow, I got a PR to main that I had to manually merge. Will it happen after each run? I'd expect some fully automated solution...
  • last-report/report.md contains some script tag, is it WAI? e.g. https://github.com/evil-shrike/triggerator-stats/blob/main/google/triggerator/latest-report/report.mds
  • it'd be great to use GH Pages for generated html, why not to put a latest report to docs folder that GH Pages support?

Possible discrepancy between actual unique cloners and report data

Hello and thank you for your work!
I have followed your tutorial, and ran the Action for the first time.
And then I compared the report data result with my repo's Traffic page.
The number of unique cloners is higher in the report than it says on my repo's Traffic page:

image

Any idea why?
Thanks.

fetch.py: Resource not accessible by integration / 403 HTTP response

When I started this project the GITHUB_TOKEN injected into a job was able to read repo traffic API endpoints.

However, that does not work anymore, probably for all repositories. I think this since this change: https://github.blog/changelog/2021-04-20-github-actions-control-permissions-for-github_token/

Log example:

+ python //fetch.py jgehrcke/ghrs-test --snapshot-directory=newsnapshots --fork-ts-outpath=forks-raw.csv --stargazer-ts-outpath=stars-raw.csv
220519-13:07:12.357 INFO:MainThread: processed args: {
  "repo": "jgehrcke/ghrs-test",
  "snapshot_directory": "newsnapshots",
  "fork_ts_outpath": "forks-raw.csv",
  "stargazer_ts_outpath": "stars-raw.csv"
}
220519-13:07:12.357 INFO:MainThread: output directory already exists: newsnapshots
220519-13:07:12.588 INFO:MainThread: Working with repository `Repository(full_name="jgehrcke/ghrs-test")`
220519-13:07:12.723 INFO:MainThread: Request quota limit: RateLimit(core=Rate(reset=2022-05-19 14:06:03, remaining=994, limit=1000))
220519-13:07:12.723 INFO:MainThread: fetch top referrers
220519-13:07:12.867 ERROR:MainThread: this appears to be a permanent error, as in "access denied -- do not retry: 403 {"message": "Resource not accessible by integration", "documentation_url": "https://docs.github.com/rest/reference/repos#get-top-referral-sources"}
+ FETCH_ECODE=1
+ set +x
error: fetch.py returned with code 1 -- exit.

Bug: single stargazers data point not drawn

I have a repo for which GHRS has logged one row of stargazer data

stargazer-snapshots.csv:

time_iso8601,stargazers_cumulative_snapshot
2023-12-13 23:32:24+00:00,4

That renders with reasonable axes but without a point

stargazers plot screenshot


Maybe there's a bug such that multiple data points are required?

Tweak CSS for mobile view / narrow screens

There's too much padding / margin on narrow screens, not enough space for plots.
Also, the referrer / path plots do not display well on narrow screens because of the fixed legend width.

Wiki tutorial is missing repository attribute in YAML snippet

The tutorial was very clear, but it doesn't include the repository attribute in the provided YAML snippet.

Currently:

name: github-repo-stats

on:
  schedule:
    # Run this once per day, towards the end of the day for keeping the most
    # recent data point most meaningful (hours are interpreted in UTC).
    - cron: "0 23 * * *"
  workflow_dispatch: # Allow for running this manually.

jobs:
  j1:
    name: github-repo-stats
    runs-on: ubuntu-latest
    steps:
      - name: run-ghrs
        # Use latest release.
        uses: jgehrcke/github-repo-stats@RELEASE
        with:
          ghtoken: ${{ secrets.ghrs_github_api_token }}

Suggested fix:

name: github-repo-stats

on:
  schedule:
    # Run this once per day, towards the end of the day for keeping the most
    # recent data point most meaningful (hours are interpreted in UTC).
    - cron: "0 23 * * *"
  workflow_dispatch: # Allow for running this manually.

jobs:
  j1:
    name: github-repo-stats
    runs-on: ubuntu-latest
    steps:
      - name: run-ghrs
        # Use latest release.
        uses: jgehrcke/github-repo-stats@RELEASE
        with:
          repository: bob/nice-project
          ghtoken: ${{ secrets.ghrs_github_api_token }}

Action fails when too many jobs trying to track different repos in the same data repo

This project looks amazing!

My idea was to track all public repos and analyze them once in a while. It looks like when I have too many jobs running, the action fails. For instance, when one job is pushed before another one. My GitHub repo.

Also, there is another issue with amazon-mws-subscriptions-maven:

210411-19:09:08.177 INFO:MainThread: union-merge views and clones
Traceback (most recent call last):
  File "/fetch.py", line 314, in <module>
    main()
  File "/fetch.py", line 73, in main
    ) = fetch_all_traffic_api_endpoints(repo)
  File "/fetch.py", line 122, in fetch_all_traffic_api_endpoints
    df_views_clones = pd.concat([df_clones, df_views], axis=1, join="outer")
  File "/usr/local/lib/python3.8/site-packages/pandas/core/reshape/concat.py", line 285, in concat
    op = _Concatenator(
  File "/usr/local/lib/python3.8/site-packages/pandas/core/reshape/concat.py", line 467, in __init__
    self.new_axes = self._get_new_axes()
  File "/usr/local/lib/python3.8/site-packages/pandas/core/reshape/concat.py", line 537, in _get_new_axes
    return [
  File "/usr/local/lib/python3.8/site-packages/pandas/core/reshape/concat.py", line 538, in <listcomp>
    self._get_concat_axis() if i == self.bm_axis else self._get_comb_axis(i)
  File "/usr/local/lib/python3.8/site-packages/pandas/core/reshape/concat.py", line 544, in _get_comb_axis
    return get_objs_combined_axis(
  File "/usr/local/lib/python3.8/site-packages/pandas/core/indexes/api.py", line 92, in get_objs_combined_axis
    return _get_combined_index(obs_idxes, intersect=intersect, sort=sort, copy=copy)
  File "/usr/local/lib/python3.8/site-packages/pandas/core/indexes/api.py", line 145, in _get_combined_index
    index = union_indexes(indexes, sort=sort)
  File "/usr/local/lib/python3.8/site-packages/pandas/core/indexes/api.py", line 214, in union_indexes
    return result.union_many(indexes[1:])
  File "/usr/local/lib/python3.8/site-packages/pandas/core/indexes/datetimes.py", line 395, in union_many
    this, other = this._maybe_utc_convert(other)
  File "/usr/local/lib/python3.8/site-packages/pandas/core/indexes/datetimes.py", line 413, in _maybe_utc_convert
    raise TypeError("Cannot join tz-naive with tz-aware DatetimeIndex")
TypeError: Cannot join tz-naive with tz-aware DatetimeIndex

Another data frame issue:

210411-19:09:18.943 INFO: parsed timestamp from path: 2021-04-11 19:09:15+00:00
Traceback (most recent call last):
  File "/analyze.py", line 1398, in <module>
    main()
  File "/analyze.py", line 82, in main
    analyse_view_clones_ts_fragments()
  File "/analyze.py", line 691, in analyse_view_clones_ts_fragments
    if df.index.max() > snapshot_time:
TypeError: '>' not supported between instances of 'float' and 'datetime.datetime'
+ ANALYZE_ECODE=1
error: analyze.py returned with code 1 -- exit.

Git clone issue:

GHRS entrypoint.sh: pwd: /github/workspace
+ git clone 'https://ghactions:${' secrets.ACCESS_GITHUB_API_TOKEN '}@github.com/ChameleonTartu/buymeacoffee-repo-stats.git' .
length of API TOKEN: 36
fatal: Too many arguments.

All other issues are the same as those mentioned.

Feature request: provide link to latest report pdf which is guaranteed to open in browser

Currently, the "Latest report PDF: report.pdf" links point to the github.com/owner/repo/raw/ url. In some browsers (e.g. Firefox) that opens in the browser; in some it downloads the file (e.g. Chromium browsers, Safari). When I use a browser which will download the file, I have to click into the latest-report directory, and from there open the file. Not a big hardship, but I often forget, and click the README link, and trigger a download I don't want.

Links to github.com/owner/repo/blob/… will open in the GitHub browser UI. I'd like a second link in READMEs pointing to the blob URL. Then I'd get the same convenience in Chromium/Safari as I do in FF.

Feature request: Include total number of downloads for all releases of a repository

It would be great if github-repo-stats would not only store data about views and clones, but also data about the total number of release downloads for a specific repository.

There are badges for it already, for example https://img.shields.io/github/downloads/grubermarkus/set-outlooksignatures/total, but the numbers only cover the last 30 releases due to a GitHub restriction.
Your github-repo-stats code could help overcome this restriction.

To get download numbers of your assets (files attached to the release), you can use https://developer.github.com/v3/repos/releases/#get-a-single-release ("download_count" property of the items of assets list in response). Pagination is to consider.

plot appearance: make further improvements

mobile view:

  • individual data points seem to be too large on a narrow screen -- of course this has to do with the total number of points per screen width.
  • the legend for the referrer/path plots takes too much space: explore max width, or better: placing the legend in the vertical dimension.

data view in general:

  • for forks and stargazers, extend time series until today. Otherwise the plot may be misleading, especially when the time axis is labeled so that it has little precision (did this really grow recently, or is this the same shape I saw three weeks ago)?

Bug: Points plotted for one day before first real data point

I added GHRS to a repo that's only a couple days old. After the first run, I'm seeing glitches in the plots.

"Unique visitors", "Total views", "Unique cloners", "Total clones", and "Stargazers" all have an extra data point one day before the first real data point.

Data

From the GH API: created_at is 2024-01-09T19:05:28Z

GHRS views_clones_aggregate.csv

time_iso8601,clones_total,clones_unique,views_total,views_unique
2024-01-09 00:00:00+00:00,4,3,1,1
2024-01-10 00:00:00+00:00,15,6,0,0
2024-01-11 00:00:00+00:00,50,29,89,1
2024-01-12 00:00:00+00:00,3,3,1,1

(Sidenote: looks like 50+ bots immediately cloning. Guess I'm doing my part to shape AI)

GHRS stargazer-snapshots.csv

time_iso8601,stargazers_cumulative_snapshot
2024-01-13 00:03:12+00:00,1

Plots

image

Docker image failing to build

Hey awesome project here. This is going to save me a lot of time!

Unfortunately, your Docker image is failing to build when I run this in my workflow. It looks like pip is failing to get the wheel for matplotlib, so it then tries to build it from source but the Docker image is missing gcc, make, etc so this fails.

I can't explain why pip is failing to find the whl...or how this is working for you.
However, I am able to work around it by using python:3.8-buster as the base image (instead of slim). This includes all of the necessary build tools and allows me to build matplotlib.

Any ideas on what is going on here?

Ultimately, regardless of the outcome of this, I think the best solution is to pull a pre-built docker image as opposed to building it each time as this would be more reliable and faster. At least, if that's possible...I'm not super well versed with Github actions

Tutorial

Hi,

First, this tool is amazing. Thank you for developing it. I do have one question though: after setting up my version of ".github/workflows/repostats-for-nice-project.yml", do I need to set up an "action.yml" as well? I did not find the setup explanation very clear. Maybe a simple tutorial with every step could benefit noob users like me.

Thanks!

Feature request: dual tokens

Thanks for your project.

For the use case of having separate data repository and stats repositories, it would be useful if separate tokens could be specified for the data repository and the stats repositories. Since write permissions are only necessary for the data repository, this would allow use of GITHUB_TOKEN for the data repository which would expire upon completion of the action. That way, only read permissions would need to be provided for the stats repositories in the PAT. This would be preferred to having a long-lived PAT with write permissions.

Perhaps for backwards compatibility a new input parameter could be used for specifying the data repository token which defaults to ghtoken if undefined.

Dropping NaNs

In analyze.py, I see you intentionally drop all rows with NaNs. For low activity repos, you can actually lose a lot of data this way. For example, you may have visitors, but no clones (let's ignore that this action counts as a unique clone each time it runs).
I suggest the NaNs be replaced with zeros. Perhaps you have already tried this out?

Raw fetch data
image

Exported data to views_clones_aggregate.csv
image

Edit

Since you use df.groupby().max() replacing nans with zeros should not be a problem for edge case nans, since a previously logged non-zero value will override subsequent nans.
https://github.com/jgehrcke/github-repo-stats/blob/main/analyze.py#L774

I could make a PR for this, but it's a simple enough change
Line 670: df = df.fillna(0)
https://github.com/jgehrcke/github-repo-stats/blob/main/analyze.py#L670

Provide tooling to aggregate files in snapshots directory

Over time, the number of individual files in the ../ghrs-data/snapshots/ directory grows to be O(1000) per year. This is not a problem for git. However, it creates inconveniences. For example, the snapshots directory cannot be browsed meaningfully anymore via github:

2022-06-15 16_44_40-ghrs-test_jgehrcke_covid-19-germany-gae_ghrs-data_snapshots at github-repo-stats

Note that only the oldest files are shown here, the newer files are truncated.

Another inconvenience is that upon checkout and parsing it might actually make a noticeable timing difference between having to write / read one file, or having to write (upon checkout) and read (upon parsing) 1000 files.

I think in the long run the Action should automatically aggregate data into less individual files (with each file having more content, obviously), so that maybe there are overall O(10) files per year.

One question is if the files should be nicely readable CSV files or if it makes sense to use a different serialization format.

An intermediate pragmatic step for me is to build tooling that allows to do this aggregation out-of-band, i.e. not as part of an Action run. The changes can then be manually committed to the data branch.

regression in 1.4.0 release: exit code of git ls-remote not respected

The 1.4.0 release has a bug newly introduced in that release, with the following symptom:

fetch data repo from remote
+ set +x
+ git clone --single-branch --branch github-repo-stats ***github.com/bearnetworkchain/core.git .
Cloning into '.'...
warning: Could not find remote branch github-repo-stats to clone.
fatal: Remote branch github-repo-stats not found in upstream origin

I addressed this on May 17 via #54. Still need to make a new release.

analyze.py error: "max() arg is an empty sequence"

The recent updates resolved the errors I was getting in two repos!

It unearthed a new error in one repo. Until yesterday I was getting this error:

Parse data files, perform aggregation and analysis, generate Markdown report and render as HTML
210412-23:45:08.034 INFO: Remove output directory: latest-report
210412-23:45:08.035 INFO: Create output directory: latest-report
210412-23:45:08.869 INFO: generated new fontManager
210412-23:45:09.041 INFO: fetch stargazer time series for repo olets/nitro-zsh-completions
210412-23:45:09.264 INFO: GH request limit before fetch operation: 4849
210412-23:45:09.421 INFO: GH request limit after fetch operation: 4848
210412-23:45:09.421 INFO: http requests made (approximately): 1
210412-23:45:09.422 INFO: stargazer count: 1
210412-23:45:09.467 INFO: stars_cumulative, raw data: time
2021-03-28 22:03:09+00:00    1
Name: stars_cumulative, dtype: int64
210412-23:45:09.468 INFO: len(series): 1
210412-23:45:09.468 INFO: resample series into 1d bins
210412-23:45:09.472 INFO: len(series): 1
210412-23:45:09.472 INFO: stars_cumulative, for CSV file (resampled):                            stars_cumulative
time                                       
2021-03-28 00:00:00+00:00                 1
210412-23:45:09.477 INFO: write aggregate to ghrs-data/views_clones_aggregate.csv
210412-23:45:09.480 INFO: fetch fork time series for repo olets/nitro-zsh-completions
210412-23:45:09.701 INFO: GH request limit before fetch operation: 4847
210412-23:45:09.827 INFO: GH request limit after fetch operation: 4846
210412-23:45:09.827 INFO: http requests made (approximately): 1
210412-23:45:09.827 INFO: current fork count: 0
210412-23:45:09.835 INFO: len(series): 0
210412-23:45:09.835 INFO: resample series into 1d bins
210412-23:45:09.836 INFO: len(series): 0
210412-23:45:09.837 INFO: forks_cumulative, for CSV file (resampled): Empty DataFrame
Columns: [forks_cumulative]
Index: []
210412-23:45:09.837 INFO: write aggregate to ghrs-data/forks.csv
210412-23:45:09.839 INFO: read views/clones time series fragments (CSV docs)
210412-23:45:09.840 INFO: number of CSV files discovered for *_views_clones_series_fragment.csv: 1
210412-23:45:09.840 INFO: attempt to parse ghrs-data/snapshots/2021-04-12_234505_views_clones_series_fragment.csv
210412-23:45:09.841 INFO: parsed timestamp from path: 2021-04-12 23:45:05+00:00
Traceback (most recent call last):
  File "/analyze.py", line 1398, in <module>
    main()
  File "/analyze.py", line 82, in main
    analyse_view_clones_ts_fragments()
  File "/analyze.py", line 691, in analyse_view_clones_ts_fragments
    if df.index.max() > snapshot_time:
TypeError: '>' not supported between instances of 'float' and 'datetime.datetime'
+ ANALYZE_ECODE=1
error: analyze.py returned with code 1 -- exit.
+ set -e
+ set +x

Now instead I get

Parse data files, perform aggregation and analysis, generate Markdown report and render as HTML
+ python /analyze.py --resources-directory /resources --output-directory latest-report --outfile-prefix '' --stargazer-ts-resampled-outpath ghrs-data/stargazers.csv --fork-ts-resampled-outpath ghrs-data/forks.csv --views-clones-aggregate-outpath ghrs-data/views_clones_aggregate.csv --views-clones-aggregate-inpath ghrs-data/views_clones_aggregate.csv --delete-ts-fragments olets/nitro-zsh-completions ghrs-data/snapshots
210414-23:42:48.927 INFO: Remove output directory: latest-report
210414-23:42:48.927 INFO: Create output directory: latest-report
210414-23:42:49.691 INFO: generated new fontManager
210414-23:42:49.847 INFO: fetch stargazer time series for repo olets/nitro-zsh-completions
210414-23:42:49.969 INFO: GH request limit before fetch operation: 4900
210414-23:42:50.095 INFO: GH request limit after fetch operation: 4899
210414-23:42:50.096 INFO: http requests made (approximately): 1
210414-23:42:50.096 INFO: stargazer count: 1
210414-23:42:50.102 INFO: stars_cumulative, raw data: time
2021-03-28 22:03:09+00:00    1
Name: stars_cumulative, dtype: int64
210414-23:42:50.103 INFO: len(series): 1
210414-23:42:50.103 INFO: resample series into 1d bins
210414-23:42:50.107 INFO: len(series): 1
210414-23:42:50.108 INFO: stars_cumulative, for CSV file (resampled):                            stars_cumulative
time                                       
2021-03-28 00:00:00+00:00                 1
210414-23:42:50.112 INFO: write aggregate to ghrs-data/views_clones_aggregate.csv
210414-23:42:50.115 INFO: fetch fork time series for repo olets/nitro-zsh-completions
210414-23:42:50.743 INFO: GH request limit before fetch operation: 4898
210414-23:42:51.145 INFO: GH request limit after fetch operation: 4897
210414-23:42:51.145 INFO: http requests made (approximately): 1
210414-23:42:51.145 INFO: current fork count: 0
210414-23:42:51.148 INFO: len(series): 0
210414-23:42:51.148 INFO: resample series into 1d bins
210414-23:42:51.149 INFO: len(series): 0
210414-23:42:51.150 INFO: forks_cumulative, for CSV file (resampled): Empty DataFrame
Columns: [forks_cumulative]
Index: []
210414-23:42:51.150 INFO: write aggregate to ghrs-data/forks.csv
210414-23:42:51.154 INFO: read views/clones time series fragments (CSV docs)
210414-23:42:51.154 INFO: number of CSV files discovered for *_views_clones_series_fragment.csv: 1
210414-23:42:51.154 INFO: attempt to parse ghrs-data/snapshots/2021-04-14_234245_views_clones_series_fragment.csv
210414-23:42:51.155 INFO: parsed timestamp from path: 2021-04-14 23:42:45+00:00
210414-23:42:51.158 WARNING: empty dataframe parsed from ghrs-data/snapshots/2021-04-14_234245_views_clones_series_fragment.csv, skip
210414-23:42:51.158 INFO: total sample count: 0
Traceback (most recent call last):
  File "/analyze.py", line 1409, in <module>
    main()
  File "/analyze.py", line 82, in main
    analyse_view_clones_ts_fragments()
  File "/analyze.py", line 717, in analyse_view_clones_ts_fragments
    newest_snapshot_time = max(df.attrs["snapshot_time"] for df in dfs)
ValueError: max() arg is an empty sequence
+ ANALYZE_ECODE=1
+ set -e
+ set +x
error: analyze.py returned with code 1 -- exit.

I don't use Python much so I haven't looked for the bug :)

I can make you a repo collaborator if that's helpful — I think that would let you run the action on the repo?

Improve error message when token contains leading or trailing whitespace.

GHRS_TESTING_DATA_REPO_DIR is unset
+ git ls-remote --exit-code --heads https://ghactions: ***@github.com/CARV-ICS-FORTH/frisbee.git github-repo-stats
use 'git ls-remote' to check if data branch exists in data repo
fatal: unable to access 'https://ghactions:/': Could not resolve host: ghactions

https://github.com/CARV-ICS-FORTH/frisbee/actions/runs/2989864452/jobs/4793820289

Based on the log output ...https://ghactions: ***@github.com... I believe what happened is that the API token was pasted with a leading space character. The resulting error message Could not resolve host: ghactions probably was so misleading to the user that they gave up. We should give them the pointer that the provided API token appears to be invalid.

Thank you!

I wanted to thank you for this project. I have a grant from the NSF and one of our requirements is to report on community uptake. These sort of stats - views, clones, forks, etc makes this reporting requirement a lot easier for me. I'll be sure to point this out to others in the same position.

Thanks again!

After #42 still errors when no forks

211130-19:36:04.425 INFO: time window for stargazer/fork data: ('2020-02-18', '2021-11-28')
211130-19:36:04.425 INFO: custom time window for stargazer plot: ('2020-02-18', '2021-11-28')
Traceback (most recent call last):
  File "/analyze.py", line 1653, in <module>
    main()
  File "/analyze.py", line 134, in main
    add_fork_section(df_forks, sf_date_axis_lim, sf_starts_earlier_than_vc_data)
  File "/analyze.py", line 1244, in add_fork_section
    assert starts_earlier_than_vc_data is None
AssertionError
+ ANALYZE_ECODE=1
+ set -e
+ set +x
error: analyze.py returned with code 1 -- exit.

Example of multiple stats repos in same workflow action

First of, thanks for an awesome project. Exactly what I needed.

I wanted to share a trick to easily collect stats from multiple repositories in a single workflow. The basic trick is to use a matrix strategy over the stats projects. To make sure that there are no commit conflicts, I've set the max-parallel property to 1:

name: update-stats
concurrency: 'update-stats'

on:
  schedule:
    # Run this once per day, 10 minutes before the end of the day for keeping the most
    # recent data point most meaningful (hours are interpreted in UTC).
    - cron: 50 23 * * *
    
  workflow_dispatch: # Allow for running this manually.
  
jobs:
  update-stats:
    runs-on: ubuntu-latest
    strategy:
      matrix:
        statsRepo: ['bob/nice-project', 'alice/also-nice-project']
      fail-fast: false
      max-parallel: 1
    steps:
      - name: run-ghrs
        uses: jgehrcke/[email protected]
        with:
          # Define the stats repository (the repo to fetch
          # stats for and to generate the report for).
          # Remove the parameter when the stats repository
          # and the data repository are the same.
          repository: ${{ matrix.statsRepo }}
          # Set a GitHub API token that can read the stats
          # repository, and that can push to the data
          # repository (which this workflow file lives in),
          # to store data and the report files.
          ghtoken: ${{ secrets.GHRS_GITHUB_API_TOKEN }}  
          # Data branch: Branch to push data to (in the data repo).
          databranch: main

Thanks again!

Show Data Point Value on Hover

Greetings !

One of the things I like about GitHub's builtin traffic graph is that I can learn the specific data point value by hovering over the dot on the graph.

I'd appreciate the ability to be able do that on the repo stats graphs.

error on run

This is awesome! The world needs this tool!


I'm getting this error:

210328-00:04:19.208 INFO: leave early: no data for entity of type referrer
210328-00:04:19.208 INFO: cmn_ename_prefix: 
Traceback (most recent call last):
  File "/analyze.py", line 1398, in <module>
    main()
  File "/analyze.py", line 116, in main
    analyse_top_x_snapshots("referrer")
  File "/analyze.py", line 493, in analyse_top_x_snapshots
    del ename
UnboundLocalError: local variable 'ename' referenced before assignment
+ ANALYZE_ECODE=1
error: analyze.py returned with code 1 -- exit.
+ set -e
+ set +x

New to Actions so this might be my fault! This is what I did:

  1. Created a new personal access token with repo privileges

  2. Created a new private data repo

  3. In that, created .github/workflows/github-repo-stats.yml

    on:
      schedule:
        # Run this once per day (hours in UTC time zone).
        # Towards the end of the day for keeping the last
        # data point meaningful.
        - cron: "* 23 * * *"
      workflow_dispatch: # Allow for running this manually.
    
    jobs:
      j1:
        name: github-repo-stats
        runs-on: ubuntu-latest
        steps:
          - name: zsh-abbr-stats
            uses: jgehrcke/github-repo-stats@HEAD
            with:
              # Define the target repository, the repo to fetch
              # stats for and to generate the report for.
              # Leave this undefined when stats repository
              # and data repository should be the same.
              repository: olets/zsh-test-runner
              # Required token privileges: Can read the target
              # repo, and can push to the repository this
              # workflow file lives in (to store data and
              # the report files).
              ghtoken: ${{ secrets.ghrs_github_api_token }}
  4. In the data repo's Actions, ran the action

This is a repo (https://github.com/olets/zsh-test-runner) that has had no traffic from anyone except me, and has no stars.

The same steps (with a duplicate yaml file) worked for an established repo (https://github.com/olets/zsh-abbr)

How are unique and totals calculated

[path total unique] filename
[/myrepo/pulls 98 21]       2021-06-05_000958_top_paths_snapshot.csv
[/myrepo/pulls 107 21]      2021-06-06_000436_top_paths_snapshot.csv
[/myrepo/pulls 118 21]      2021-06-07_000430_top_paths_snapshot.csv

The above are my collated data for top paths, are the unique and total aggregates. Do I say the actual total number of unique views for 2021-06-06 is 0 (21 - 21) and the actual total views 9 (107 - 98)

Plotted numbers for stargazers and forks

Would it be possible to add the textual number in the pdf report for these two categories, like viewers and clones? If there's another way to see the exact details, would appreciate that info. Thanks so much for this great repo / report.

Bug: "Cannot save file into a non-existent directory: 'ghrs-data'"

I'm getting the following error:

# ---snip---
240111-23:31:30.123 INFO:MainThread: write fork time series to forks-raw.csv.tmp, then rename to forks-raw.csv
240111-23:31:30.124 INFO:MainThread: current stargazer count as reported by repo properties: 1
240111-23:31:30.124 INFO:MainThread: does not exist yet: ghrs-data/stargazer-snapshots.csv
240111-23:31:30.124 INFO:MainThread: write cumulative/snapshot-based stargazer time series to ghrs-data/stargazer-snapshots.csv.tmp, then rename to ghrs-data/stargazer-snapshots.csv
Traceback (most recent call last):
  File "//fetch.py", line 596, in <module>
    main()
  File "//fetch.py", line 114, in main
    fetch_and_write_stargazer_ts(repo, args)
  File "//fetch.py", line 199, in fetch_and_write_stargazer_ts
    updated_sdf.to_csv(tmppath, index_label="time_iso[86](https://github.com/SNIP/actions/runs/SNIP/job/SNIP#step:3:87)01")
  File "/usr/local/lib/python3.10/site-packages/pandas/core/generic.py", line 3[90](https://github.com/SNIP/actions/runs/SNIP/job/SNIP#step:3:91)2, in to_csv
    return DataFrameRenderer(formatter).to_csv(
  File "/usr/local/lib/python3.10/site-packages/pandas/io/formats/format.py", line 1152, in to_csv
    csv_formatter.save()
  File "/usr/local/lib/python3.10/site-packages/pandas/io/formats/csvs.py", line 247, in save
    with get_handle(
  File "/usr/local/lib/python3.10/site-packages/pandas/io/common.py", line 739, in get_handle
    check_parent_directory(str(handle))
  File "/usr/local/lib/python3.10/site-packages/pandas/io/common.py", line 604, in check_parent_directory
    raise OSError(rf"Cannot save file into a non-existent directory: '{parent}'")
OSError: Cannot save file into a non-existent directory: 'ghrs-data'
+ FETCH_ECODE=1
+ set +x
error: fetch.py returned with code 1 -- exit.

One possible complicating factor is the repo is only two days old. If I remember correctly we've seen before that there may be weirdnesses with young repos, where Github isn't storing data yet.

I haven't looked into the source, but the error reads to me like this isn't a GitHub problem.

Can email you a short-lifespan token if you want to experiment.

Introduce release branch

Best practices about how to make users use the 'latest release' were a little unclear from the github actions documentation. Interesting discussion: https://github.community/t/versioning-guidance-for-authoring-and-consuming-actions/138763

Related: https://stackoverflow.com/questions/57835401/how-to-automatically-select-the-latest-tagged-version-of-an-github-action

Solution: introduce a new branch with a special name (e.g. RELEASE) and then use @RELEASE in the documentation/snippets. This will result in people using a moving target to the latest release. This is better than HEAD, and prooobably better than having most users being stuck with old releases (current state). Conservative users can pick a specific release themselves.

error: analyze.py returned with code 1 -- exit.

220907-19:21:39.615 INFO: read 'top referrer' snapshots (CSV docs)
220907-19:21:39.615 INFO: number of CSV files discovered for *_top_referrers_snapshot.csv: 0
220907-19:21:39.615 INFO: about to deserialize 0 snapshot CSV files
220907-19:21:39.615 INFO: all referrer entities seen: set()
Traceback (most recent call last):
  File "//analyze.py", line 1647, in <module>
    main()
  File "//analyze.py", line [154](https://github.com/juanbrusco/github-repo-stats/runs/8235698251?check_suite_focus=true#step:3:155), in main
    analyse_top_x_snapshots("referrer", gen_date_axis_lim((df_vc_agg,)))
  File "//analyze.py", line 520, in analyse_top_x_snapshots
    dfa = pd.concat(snapshot_dfs)
  File "/usr/local/lib/python3.10/site-packages/pandas/util/_decorators.py", line 311, in wrapper
    return func(*args, **kwargs)
  File "/usr/local/lib/python3.10/site-packages/pandas/core/reshape/concat.py", line 347, in concat
    op = _Concatenator(
  File "/usr/local/lib/python3.10/site-packages/pandas/core/reshape/concat.py", line 404, in __init__
    raise ValueError("No objects to concatenate")
ValueError: No objects to concatenate
+ ANALYZE_ECODE=1
+ set +x
error: analyze.py returned with code 1 -- exit.

explore stargazer limit challenge (40k+)

Just saw https://github.com/Significant-Gravitas/Auto-GPT/ starting to use github-repo-stats. They have ~150k stargazers. We can extract 40000:

230920-13:20:22.067 INFO:MainThread: 39600 gazers fetched
230920-13:20:22.465 INFO:MainThread: 39800 gazers fetched
230920-13:20:22.728 INFO:MainThread: 40000 gazers fetched
230920-13:20:22.790 INFO:MainThread: GH request limit after fetch operation: 4279
230920-13:20:22.790 INFO:MainThread: http requests made (approximately): 400
230920-13:20:22.790 INFO:MainThread: stargazer count: 40000
230920-13:20:22.924 INFO:MainThread: stargazer df

This seems to be a known limitation of the API, delivering only 400 pages:
https://stackoverflow.com/questions/68910259/fetch-all-stargazers-over-time-of-a-repository

Strongly related, potentially offering a solution: https://observablehq.com/@observablehq/github-stargazer-history

@Swiftyos I hope you get this notification; we can look into extracting the 'correct' number of stargazers in your special case there. The "many stargazer challenge" has been deliberately un-addressed by me and there are obvious ideas for improvement so that the larger chunk of the stargazer timeseries does not need to be re-fetched every single time the action runs. Also see

# TODO: for ~10k stars repositories, this operation is too costly for doing
.

@Swiftyos I saw you picked a 90 minute interval for running the action -- that is a little often for no obvious benefit! Once per day should really be good enough. Do you have any specific concerns you try to address with the 90 minute interval?

running multiple workflows in same data repo is hit or miss

I've set up multiple GHRS jobs in a single repo, so that I can have one place to see reports for multiple stats repos.

When I run the jobs (either from single-stats-repo workflows, or as separate jobs in a single "all my GHRS" workflows) some succeed and some fail.

It looks like there's a race condition where one job can push an update after another's pull.

I've tried various approaches to sequential actions and haven't found a great solution. But I'm new to Actions, I bet there there is one.

Still, a well placed git pull might solve this.

210328-21:02:14.770 INFO: done
+ git add latest-report
+ set +x
generate README.md
+ git add README.md
+ git commit -m 'ghrs: report 03-28-2102-4031 for <owner>/<stats repo>'
[github-repo-stats 9c1e9a3] ghrs: report 03-28-2102-4031 for <owner>/<stats repo>
 7 files changed, 1357 insertions(+)
 create mode 100644 <owner>/<stats repo>/README.md
 create mode 100644 <owner>/<stats repo>/latest-report/report.html
 create mode 100644 <owner>/<stats repo>/latest-report/report.md
 create mode 100644 <owner>/<stats repo>/latest-report/report.pdf
 create mode 100644 <owner>/<stats repo>/latest-report/report_for_pdf.html
 create mode 100644 <owner>/<stats repo>/latest-report/resources/github-markdown.css
 create mode 100644 <owner>/<stats repo>/latest-report/resources/template.html
+ git push --set-upstream origin github-repo-stats
To <owner>/<data repo>.git
 ! [rejected]        github-repo-stats -> github-repo-stats (fetch first)
error: failed to push some refs to '***github.com/<owner>/<data repo>.git'
hint: Updates were rejected because the remote contains work that you do
hint: not have locally. This is usually caused by another repository pushing
hint: to the same ref. You may want to first integrate the remote changes
hint: (e.g., 'git pull ...') before pushing again.
hint: See the 'Note about fast-forwards' in 'git push --help' for details.

Action fails in pull on new data branch

The action does not require the data branch to exist up front. This is good. If the data branch does not exist, it will be created.

+ git checkout gitblit
error: pathspec 'gitblit' did not match any file(s) known to git
+ git checkout -b gitblit

But this breaks later in the script when a default pull is executed. The pull will have no tracked remote ref to operate on, since the branch is new. This results in the following error.

+ git pull
There is no tracking information for the current branch.
Please specify which branch you want to merge with.
See git-pull(1) for details.

    git pull <remote> <branch>

If you wish to set tracking information for this branch you can do so with:

    git branch --set-upstream-to=origin/<branch> gitblit

I believe the PR #30 is there to address this problem, from the looks of it. I haven't tested it, though.

Maybe a Typo in README

The cron job line in README * 23 * * * seems to be run every minutes between 11:00PM and 11:59PM according to crontabguru.

The correct syntax could be 0 23 * * *.

pdf.py: make sure that chromedriver is baked into image (do not download for each invocation)

Just got this locally which is a surprise:

# 231001-13:48:41.960 INFO: html_apath: /tmp/bats-run-yTRfV6/test/7/outdir/report_for_pdf.html
# 231001-13:48:41.960 INFO: set up chromedriver with capabilities {'browserName': 'chrome', 'pageLoadStrategy': 'normal', 'goog:chromeOptions': {'extensions': [], 'args': ['--headless', '--disable-gpu', '--no-sandbox', '--disable-dev-shm-usage']}}
# 231001-13:48:41.960 INFO: ====== WebDriver manager ======
# mkdir: cannot create directory ‘//.local’: Permission denied
# touch: cannot touch '//.local/share/applications/mimeapps.list': No such file or directory
# mkdir: cannot create directory ‘//.local’: Permission denied
# touch: cannot touch '//.local/share/applications/mimeapps.list': No such file or directory
# 231001-13:48:42.110 INFO: Get LATEST chromedriver version for google-chrome
# 231001-13:48:42.221 INFO: Get LATEST chromedriver version for google-chrome
# 231001-13:48:42.334 INFO: There is no [linux64] chromedriver "117.0.5938.92" for browser google-chrome "117.0.5938" in cache
# 231001-13:48:42.334 INFO: Get LATEST chromedriver version for google-chrome
# 231001-13:48:42.569 INFO: WebDriver version 117.0.5938.92 selected
# 231001-13:48:42.570 INFO: Modern chrome version https://edgedl.me.gvt1.com/edgedl/chrome/chrome-for-testing/117.0.5938.92/linux64/chromedriver-linux64.zip
# 231001-13:48:42.570 INFO: About to download new driver from https://edgedl.me.gvt1.com/edgedl/chrome/chrome-for-testing/117.0.5938.92/linux64/chromedriver-linux64.zip
# Traceback (most recent call last):
#   File "/usr/local/lib/python3.10/site-packages/urllib3/connectionpool.py", line 467, in _make_request
#     self._validate_conn(conn)
#   File "/usr/local/lib/python3.10/site-packages/urllib3/connectionpool.py", line 1092, in _validate_conn
#     conn.connect()
#   File "/usr/local/lib/python3.10/site-packages/urllib3/connection.py", line 642, in connect
#     sock_and_verified = _ssl_wrap_socket_and_match_hostname(
#   File "/usr/local/lib/python3.10/site-packages/urllib3/connection.py", line 783, in _ssl_wrap_socket_and_match_hostname
#     ssl_sock = ssl_wrap_socket(
#   File "/usr/local/lib/python3.10/site-packages/urllib3/util/ssl_.py", line 469, in ssl_wrap_socket
#     ssl_sock = _ssl_wrap_socket_impl(sock, context, tls_in_tls, server_hostname)
#   File "/usr/local/lib/python3.10/site-packages/urllib3/util/ssl_.py", line 513, in _ssl_wrap_socket_impl
#     return ssl_context.wrap_socket(sock, server_hostname=server_hostname)
#   File "/usr/local/lib/python3.10/ssl.py", line 513, in wrap_socket
#     return self.sslsocket_class._create(
#   File "/usr/local/lib/python3.10/ssl.py", line 1071, in _create
#     self.do_handshake()
#   File "/usr/local/lib/python3.10/ssl.py", line 1342, in do_handshake
#     self._sslobj.do_handshake()
# ssl.SSLError: [SSL: SSLV3_ALERT_HANDSHAKE_FAILURE] sslv3 alert handshake failure (_ssl.c:1007)

The point of building the base image (it's already big) is to have batteries included.

instability during ls-remote: URL returned error: 429

UPDATE_ID: 04-13-2304-E419
+ git ls-remote --exit-code --heads ***github.com/<redacted>/<redacted>.git github-repo-stats
GHRS_TESTING_DATA_REPO_DIR is unset
use 'git ls-remote' to check if data branch exists in data repo
fatal: unable to access '***github.com/<redacted>.git/': The requested URL returned error: 429
+ LS_ECODE=128
+ set +x
git ls-remote failed unexpectedly with code 128

Is probably rather rare. Can help with retrying.

Ability to aggregate on top of "pre-recorded" stats?

This is a great package, thanks!

If I have traffic data on a repo that existed more than 14 days BEFORE setting up this action. Is it possible to "stack" my currently aggregated data on top of that previous data?

Unfortunately I started aggregating traffic data with this tool 24 days AFTER the repo was released, so 10 days appear to be lost. I (happily) found an old opened web-browser that has some of that "lost" data, so I can extract it, and I'd like to incorporate it in my currently aggregated data. What would the contours of a solution look like for this?

retry upon transient error during paginated stargazer/fork retrieval

A known limitation since starting to use pygithub for fetching data: when using their API to iterate through pages via e.g. for count, fork in enumerate(repo.get_forks(), 1) then the individual HTTP request is not retried upon transient error and it's also not really easy to do so (to retry the HTTP request corresponding to one specific page out of many pages) cleanly from the calling program.

Example of a boring transient error affecting one of many HTTP requests, taking down the entire action run.

...
231004-23:07:04.767 INFO:MainThread: 8000 forks fetched
231004-23:07:11.723 INFO:MainThread: 8200 forks fetched
231004-23:07:18.807 INFO:MainThread: 8400 forks fetched
...
Traceback (most recent call last):
  File "//fetch.py", line 596, in <module>
    main()
  File "//fetch.py", line 111, in main
    fetch_and_write_fork_ts(repo, args.fork_ts_outpath)
  File "//fetch.py", line 225, in fetch_and_write_fork_ts
    dfforkcsv = get_forks_over_time(repo)
  File "//fetch.py", line 434, in get_forks_over_time
    for count, fork in enumerate(repo.get_forks(), 1):
  File "/usr/local/lib/python3.10/site-packages/github/PaginatedList.py", line 56, in __iter__
    newElements = self._grow()
  File "/usr/local/lib/python3.10/site-packages/github/PaginatedList.py", line 67, in _grow
    newElements = self._fetchNextPage()
  File "/usr/local/lib/python3.10/site-packages/github/PaginatedList.py", line 199, in _fetchNextPage
    headers, data = self.__requester.requestJsonAndCheck(
  File "/usr/local/lib/python3.10/site-packages/github/Requester.py", line 354, in requestJsonAndCheck
    *self.requestJson(
  File "/usr/local/lib/python3.10/site-packages/github/Requester.py", line 454, in requestJson
    return self.__requestEncode(cnx, verb, url, parameters, headers, input, encode)
  File "/usr/local/lib/python3.10/site-packages/github/Requester.py", line 528, in __requestEncode
    status, responseHeaders, output = self.__requestRaw(
  File "/usr/local/lib/python3.10/site-packages/github/Requester.py", line 555, in __requestRaw
    response = cnx.getresponse()
  File "/usr/local/lib/python3.10/site-packages/github/Requester.py", line 127, in getresponse
    r = verb(
  File "/usr/local/lib/python3.10/site-packages/requests/sessions.py", line 602, in get
    return self.request("GET", url, **kwargs)
  File "/usr/local/lib/python3.10/site-packages/requests/sessions.py", line 589, in request
    resp = self.send(prep, **send_kwargs)
  File "/usr/local/lib/python3.10/site-packages/requests/sessions.py", line 703, in send
    r = adapter.send(request, **kwargs)
  File "/usr/local/lib/python3.10/site-packages/requests/adapters.py", line 501, in send
    raise ConnectionError(err, request=request)
requests.exceptions.ConnectionError: ('Connection aborted.', RemoteDisconnected('Remote end closed connection without response'))
...

Retrying this naively at the higher level would involve fetching all forks again. Of course, this is Python and we can do all kinds of workarounds. But they would take more time to build and test.

Some repos started failing when there is no data in DataFrame

For the last few days, I see that some projects started failing:

Empty DataFrame
Columns: [clones_total, clones_unique]
Index: []
210428-01:17:49.220 INFO:MainThread: dataframe datetimeindex detail: DatetimeIndex([], dtype='datetime64[ns, UTC]', name='time_iso8601', freq=None)
210428-01:17:49.220 INFO:MainThread: fetch data for views
210428-01:17:49.348 INFO:MainThread: built dataframe for views:
Empty DataFrame
Columns: [views_total, views_unique]
Index: []
210428-01:17:49.349 INFO:MainThread: dataframe datetimeindex detail: DatetimeIndex([], dtype='datetime64[ns, UTC]', name='time_iso8601', freq=None)
210428-01:17:49.350 INFO:MainThread: indices of df_views and df_clones are equal
210428-01:17:49.350 INFO:MainThread: union-merge views and clones
210428-01:17:49.351 INFO:MainThread: df_views_clones:
Empty DataFrame
Columns: [clones_total, clones_unique, views_total, views_unique]
Index: []
210428-01:17:49.352 INFO:MainThread: current working directory: /github/workspace/ChameleonTartu/amazon-mws-fulfillment-inventory-maven
210428-01:17:49.352 INFO:MainThread: write output CSV files to directory: newdata
210428-01:17:49.352 INFO:MainThread: do not write df_views_clones: empty
210428-01:17:49.353 INFO:MainThread: do not write df_referrers_snapshot_now: empty
210428-01:17:49.353 INFO:MainThread: do not write df_paths_snapshot_now: empty
210428-01:17:49.353 INFO:MainThread: done!
+ FETCH_ECODE=0
+ set -e
+ set +x
fetch.py returned with exit code 0. proceed.
tree in /github/workspace/ChameleonTartu/amazon-mws-fulfillment-inventory-maven/newdata:
+ mkdir -p ghrs-data/snapshots
newdata

0 directories, 0 files
+ cp -a 'newdata/*' ghrs-data/snapshots
cp: cannot stat 'newdata/*': No such file or directory

You can see the list of all repos in the GitHub Action.

Do you have any idea? It used to work before, maybe I shouldn't rely on the @head branch? :-)

Recommend Projects

  • React photo React

    A declarative, efficient, and flexible JavaScript library for building user interfaces.

  • Vue.js photo Vue.js

    🖖 Vue.js is a progressive, incrementally-adoptable JavaScript framework for building UI on the web.

  • Typescript photo Typescript

    TypeScript is a superset of JavaScript that compiles to clean JavaScript output.

  • TensorFlow photo TensorFlow

    An Open Source Machine Learning Framework for Everyone

  • Django photo Django

    The Web framework for perfectionists with deadlines.

  • D3 photo D3

    Bring data to life with SVG, Canvas and HTML. 📊📈🎉

Recommend Topics

  • javascript

    JavaScript (JS) is a lightweight interpreted programming language with first-class functions.

  • web

    Some thing interesting about web. New door for the world.

  • server

    A server is a program made to process requests and deliver data to clients.

  • Machine learning

    Machine learning is a way of modeling and interpreting data that allows a piece of software to respond intelligently.

  • Game

    Some thing interesting about game, make everyone happy.

Recommend Org

  • Facebook photo Facebook

    We are working to build community through open source technology. NB: members must have two-factor auth.

  • Microsoft photo Microsoft

    Open source projects and samples from Microsoft.

  • Google photo Google

    Google ❤️ Open Source for everyone.

  • D3 photo D3

    Data-Driven Documents codes.