GithubHelp home page GithubHelp logo

mhdhejazi / coronatracker Goto Github PK

View Code? Open in Web Editor NEW
1.5K 66.0 291.0 1.5 MB

Coronavirus tracker app for iOS & macOS with maps & charts

Home Page: https://coronatracker.samabox.com/

License: GNU General Public License v3.0

Swift 100.00%
coronavirus covid-19 coronavirus-tracking coronavirus-tracker ios swift macos-app ios-app

coronatracker's Introduction

iOS macOS Swift

image

Features

  • Live data: Shows the most recent data, and updates automatically.
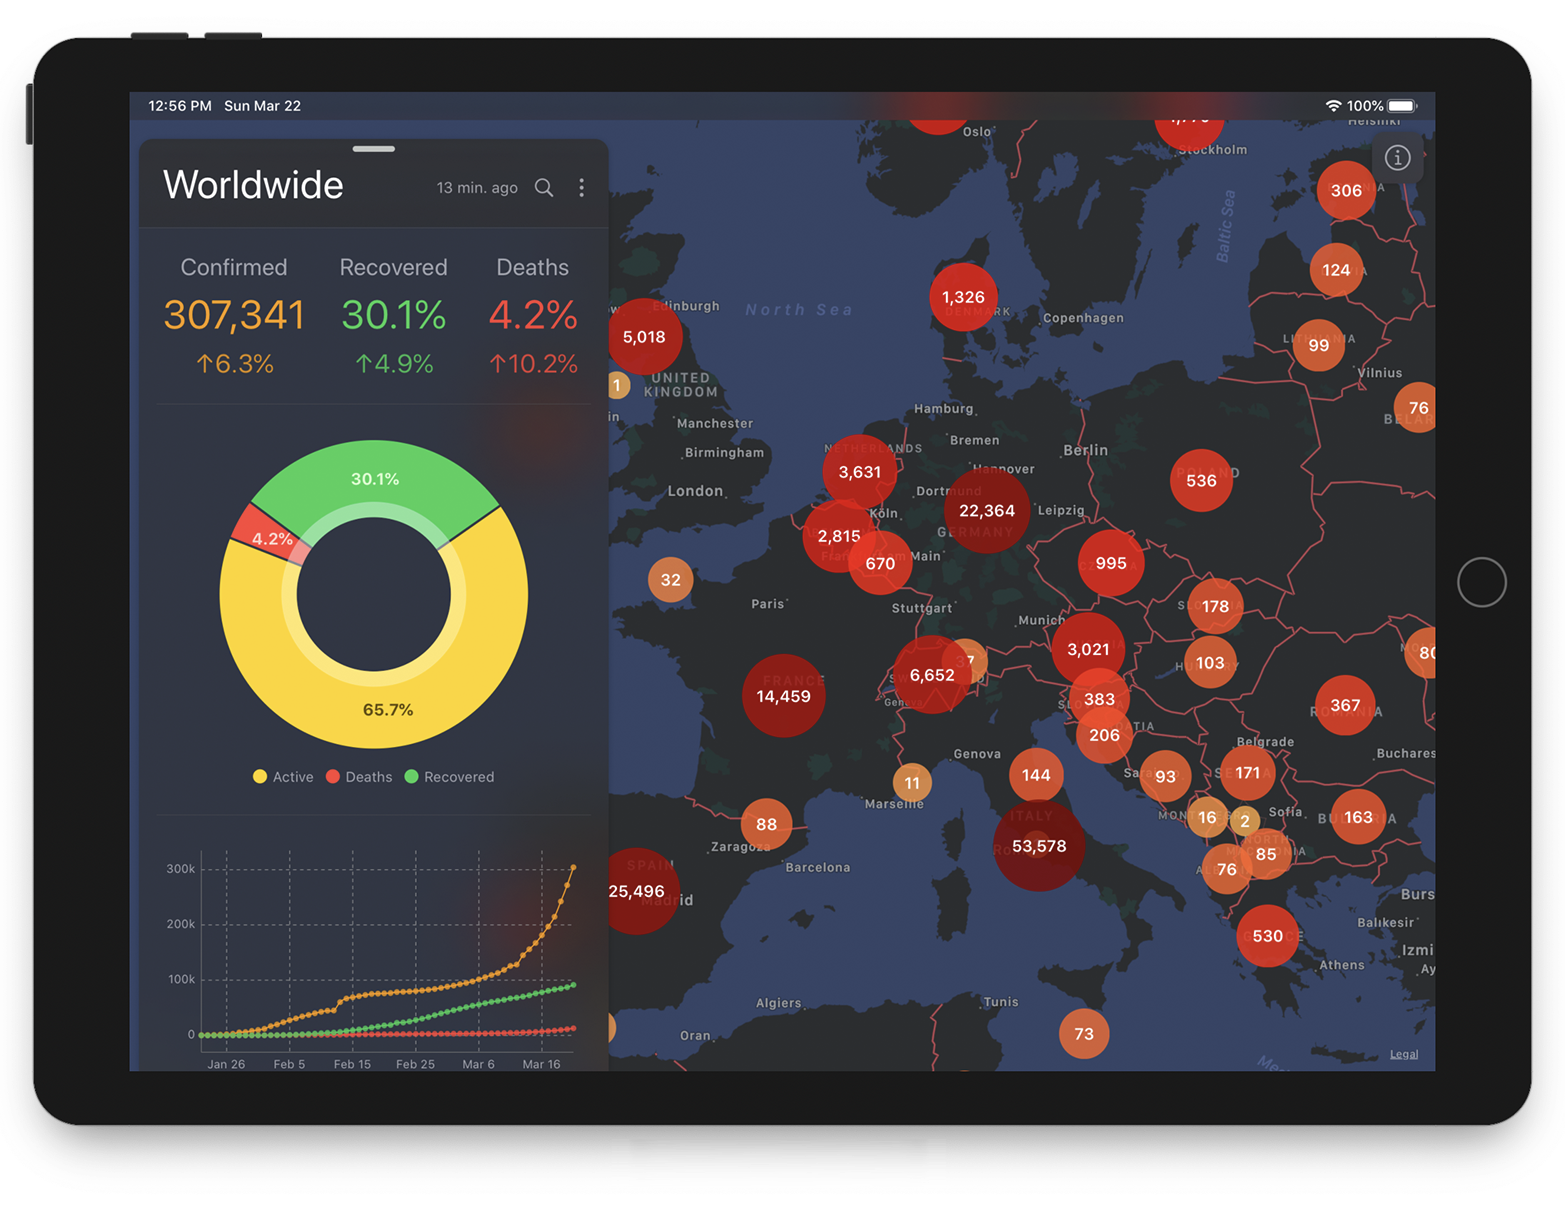
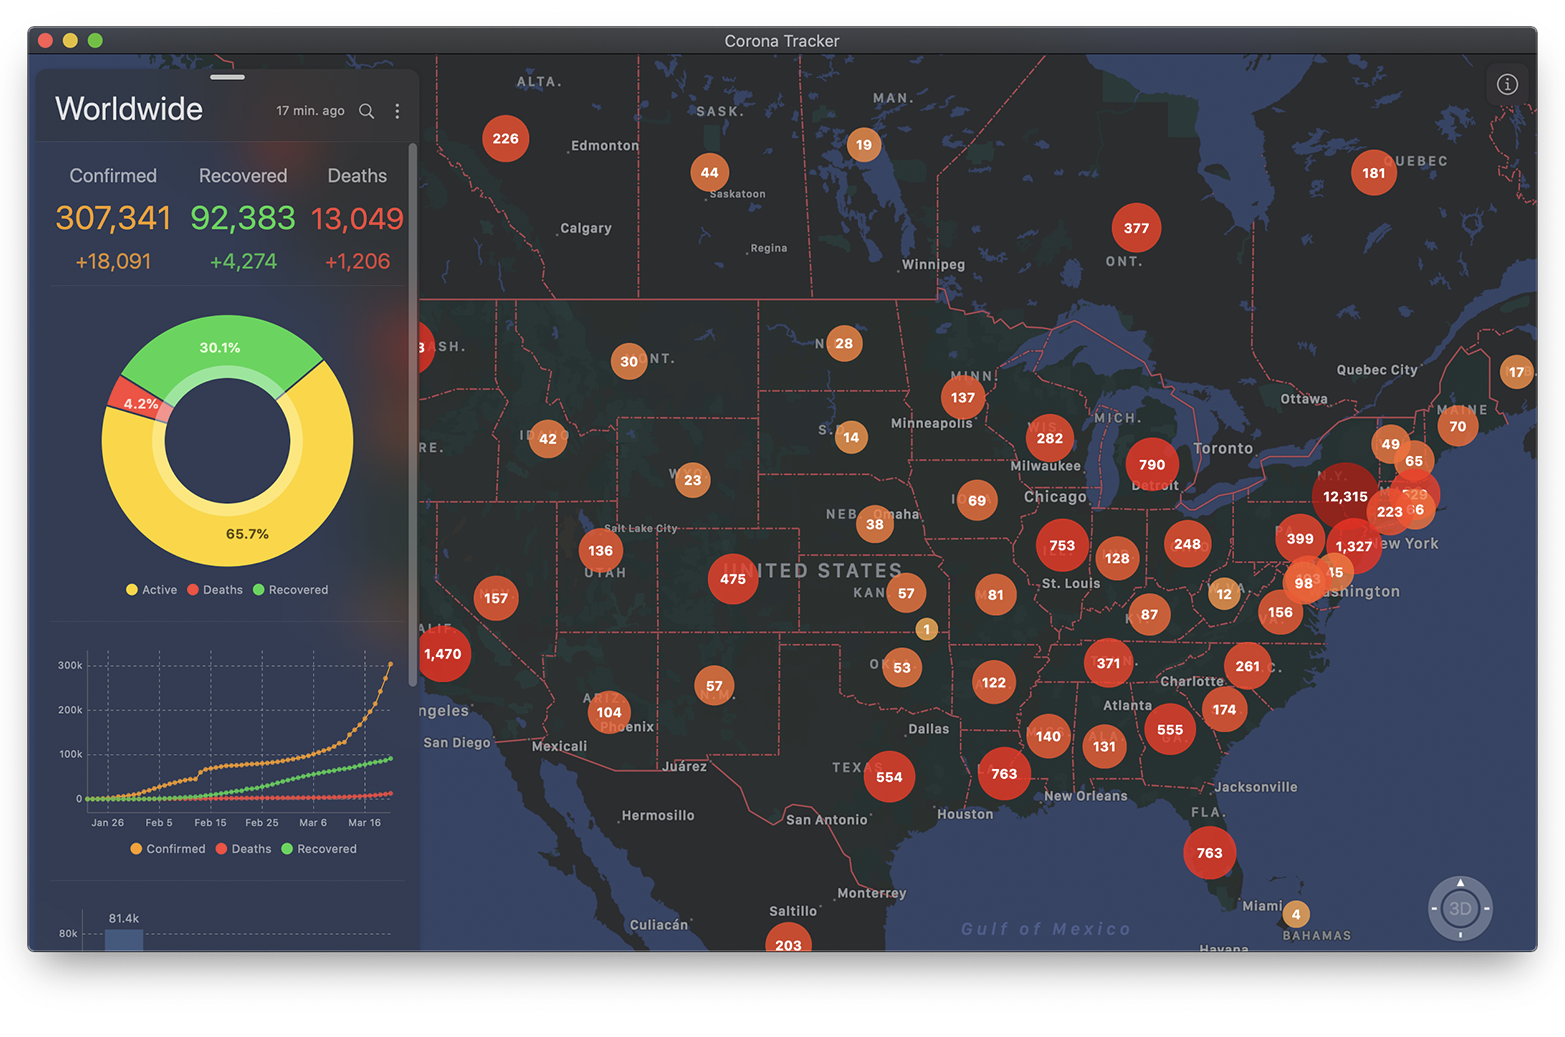
  • Distribution map with two levels of details:
    • Countries: When the user zooms out. Fewer details and reduced clutter.
    • Cities: When the user zooms in. More details.
  • Charts:
    • Current state chart for all countries (and cities).
    • Timeline chart for all countries (and cities).
    • Top affected countries chart with info about every country.
    • Daily new cases shows how fast the virus is spreading in a given country.
    • Cases since the 100th case how fast the virus is spreading in different countries.
    • Option for using a logarithmic scale.
  • Search for countries & cities.
  • Share stats & charts as images.
  • Today widget for worldwide stats.
  • Red color scale: Reflects the number of confirmed cases. In addition to increasing circle size.
  • Statistics: Including the number of confirmed, recovered, and deaths, in addition to percents.
  • iPad & macOS support.

image image

How to Use

1. iOS & macOS App

Build from source code

  1. Clone/Download the repo.
  2. Open Corona.xcodeproj in Xcode.
  3. Choose the right target (iOS or macOS).
  4. Build & run!

2. macOS App

Download the latest release for macOS.

Or install via brew:

brew cask install corona-tracker

Contribute

Please feel free to contribute pull requests or create issues for bugs and feature requests.

Author

Mhd Hejazi ([email protected])

Credits

Data

  • Johns Hopkins University Center for Systems Science and Engineering (JHU CSSE)
  • Robert Koch Institute (RKI)
  • Bundesministeriums für Soziales, Gesundheit, Pflege und Konsumentenschutz (BMSGPK)
  • Bing COVID-19 Tracker (Bing)

Features

Data Sources

Translations

Libraries

coronatracker's People

Contributors

ale111 avatar brotherlouie avatar comradekingu avatar connor avatar dev-sora avatar dev-yong avatar ejewik avatar fluffydev2019 avatar friederbluemle avatar hdatteln avatar hussamzain avatar jsf030 avatar jstart avatar kebbbnnn avatar lala1969 avatar loicgardiol avatar marquicodes avatar mhdhejazi avatar nesimtunc avatar patricks avatar pbeo avatar pdldm avatar ppamorim avatar racpsjcsp avatar rapx3 avatar reich452 avatar rhcpfan avatar risengan avatar sebastianbinder avatar wacumov avatar

Stargazers

 avatar  avatar  avatar  avatar  avatar  avatar  avatar  avatar  avatar  avatar  avatar  avatar  avatar  avatar  avatar  avatar  avatar  avatar  avatar  avatar  avatar  avatar  avatar  avatar  avatar  avatar  avatar  avatar  avatar  avatar  avatar  avatar  avatar  avatar  avatar  avatar  avatar  avatar  avatar  avatar  avatar  avatar  avatar  avatar  avatar  avatar  avatar  avatar  avatar  avatar  avatar  avatar  avatar  avatar  avatar  avatar  avatar  avatar  avatar  avatar  avatar  avatar  avatar  avatar  avatar  avatar  avatar  avatar  avatar  avatar  avatar  avatar  avatar  avatar  avatar  avatar  avatar  avatar  avatar  avatar  avatar  avatar  avatar  avatar  avatar  avatar  avatar  avatar  avatar  avatar  avatar  avatar  avatar  avatar  avatar  avatar  avatar  avatar  avatar  avatar

Watchers

 avatar  avatar  avatar  avatar  avatar  avatar  avatar  avatar  avatar  avatar  avatar  avatar  avatar  avatar  avatar  avatar  avatar  avatar  avatar  avatar  avatar  avatar  avatar  avatar  avatar  avatar  avatar  avatar  avatar  avatar  avatar  avatar  avatar  avatar  avatar  avatar  avatar  avatar  avatar  avatar  avatar  avatar  avatar  avatar  avatar  avatar  avatar  avatar  avatar  avatar  avatar  avatar  avatar  avatar  avatar  avatar  avatar  avatar  avatar  avatar  avatar  avatar  avatar  avatar  avatar  avatar

coronatracker's Issues

Refactor the data structure

The current design is something like this:

struct Report {
   let region: Region
}

struct TimeSeries {
  let region: Region
}

class DataManager {
  let reports: [Report]
  let timeSerieses: [TimeSeries]
}

We need to refactor this design to move reports and time series under Region. So every country region will have its report and time series, and sub-regions for the states/provinces/cities. And above all, we'll have the World region that has the country regions as its sub-regions.
So, basically, it's a tree of regions, which makes sense.

struct Region {
  let report: Report
  let timeSeries: TimeSeries
  let subRegions: [Region]
}

class DataManager {
  let worldRegion: Region /*
      subRegions for countries
           subRegions for states/provinces/cities
  */
}

This is a breaking change, so I suggest waiting until this task is completed before working on a new feature.

Plans to publish the ios app on appstore?

I think CoronaTracker is in a really usable state right now, would love to see it on the appstore.
I know that Apple put a few restrictions on those type of apps a few days/weeks ago, but the fact that this one is using the data from CSSE at the JHU might be a point?

history for daily data

after a period of 24 hours, the data (look screenshot) will be reset. it would be good if you could choose past days. what there were the maximum values (all values) before the 24h period reset.

sorry for the bad english

image

Is dayly statistics removed or...?

In last days I haven't seen the dayly statistics under (as shown in attatched pic), is it removed or is there something else?

Miss that information troumendssly.

Build I use is from Master.
E8E2A2E3-8215-427F-9348-64330AE7E0E6

Support for Mojave

Hi, any chance to get it to work on on Mojava 10.14.6 (18G4032)?

Thanks.

Can’t build for iOS

Hi,

I attached a screenshot of the erros I get during the runtime, if you need log files let me know.
Tried this on Xcode 11.3.image

v1.7 Crash on macOS

Opening v1.7 on macOS causes a crash and displays the following error:

Exception Type:        EXC_BAD_INSTRUCTION (SIGILL)
Exception Codes:       0x0000000000000001, 0x0000000000000000
Exception Note:        EXC_CORPSE_NOTIFY

Termination Signal:    Illegal instruction: 4
Termination Reason:    Namespace SIGNAL, Code 0x4
Terminating Process:   exc handler [28453]

Thread 0 Crashed:: Dispatch queue: com.apple.main-thread
0   maccatalyst.com.samabox.corona	0x0000000101513831 0x1014bf000 + 346161
1   maccatalyst.com.samabox.corona	0x000000010151238f 0x1014bf000 + 340879
2   com.apple.AppKit              	0x00007fff31abc93b -[NSToolbar _newItemFromDelegateWithItemIdentifier:propertyListRepresentation:willBeInsertedIntoToolbar:] + 139
3   com.apple.AppKit              	0x00007fff31aba970 -[NSToolbar _newItemFromItemIdentifier:propertyListRepresentation:requireImmediateLoad:willBeInsertedIntoToolbar:] + 297
4   com.apple.AppKit              	0x00007fff31abc53c -[NSToolbar _loadAllPlaceholderItems] + 505
5   com.apple.AppKit              	0x00007fff31abb182 -[NSToolbar _windowWillShowToolbar] + 91
6   com.apple.AppKit              	0x00007fff31abb0a9 -[NSWindow _showToolbar:animate:] + 196
7   com.apple.AppKit              	0x00007fff31abafd0 -[NSToolbar _show:animate:] + 35
8   com.apple.AppKit              	0x00007fff31ab8eed -[NSWindow setToolbar:] + 745
9   com.apple.UIKitMacHelper      	0x00007fff658f8c60 -[UINSWindow setToolbar:] + 49
10  com.apple.UIKitCore           	0x00007fff75160e6b -[UITitlebar _updateToolbar] + 42
11  com.apple.UIKitCore           	0x00007fff75160e2e -[UITitlebar setToolbar:] + 80

View of granular data points for regions or provinces

I split this issue into bugs (in my opinion) and a related feature request. It's about the new view of granular data points for regions or provinces.

Bugs:

  • The semicircular background layers for displaying numerical values at the provincial level are displayed empty at a certain zoom level, so they disturb the overview without displaying information.

  • The numerical values for the provinces overlap the numerical values for countries, and are displayed one level higher than the country values, so that when interacting, one involuntarily retrieves the numbers of the province instead of the desired country values.

Feature Request:

  • Personally, I don't like the way the numbers are displayed at the regional level, but that's certainly a matter of taste. What is simply imprecise, however, is the simultaneous representation of both levels on one country. For those countries for which regional sub-values are available, could you possibly frame the country circles accordingly, so that a tap on the country circle "folds out" the regional figures?

The data is not updated

Platform: iPhone SE
iOS: 10.3.2

I just updated to the latest version today and am running into this issue on my phone.
Can't update the data. Please make sure you're connected to the internet

Of course I've checked and my phone is online and all other apps are able to connect to the internet.
I also checked via Cellular, WiFi and even VPN and I always get the same error.

image

Can't scroll region view anymore

Scrolling up to see the region view controller was broken in the update v1.3 for iPhone 8 and 8 plus. Only the top of the graph can be seen.

e13ee18

Scroll seems to be broken on all iPhones actually. Just that the graphs can still be seen on the bigger screens.

Incorrect stats ?

095EDB98-BB0D-4DA5-9487-ACBC5CD76332

Why is France not appearing here ? It’s more affected than Brazil or Russia.

Thanks

Small errors in diagrams

I noticed a few little things:

  • In the diagram of the most affected countries, the 100,000 steps are different sizes. The first 100,000 are smaller than the subsequent ones, which distorts the diagram and makes the USA appear even more disproportionate in this case. This also applies to the full screen view after tapping.

  • There also seems to be some kind of rounding error. In the diagram of the worldwide development of cases, the same applies to the same extent as to individual countries such as Slovenia, which has just over 1,000 cases. In the case of the worldwide case development, 1.1 million cases become 1 million, in Slovenia 1,100 cases become 1,000 cases. After rounding, both cases are therefore shown twice with step 1 million and 1,000 respectively.

High Memory usage Mac App

The mac app uses a lot of ram. Starting at about ~110 MB all the way to ~300 MB.
Is this due to it being a catalyst app? It doesnt need that much ram on the iphone..

Map Annotation Popup intermittently contains stale data

Map Annotation Popup intermittently contains stale data

Initial investigation shows that this appears to be due to ReportAnnotationView instances having their report data updated only initially.

For added clarity, please see attached screenshot.

IMG_6484

doesnt work on ipad

i tried to compile it for my ipad (5. Generation), but the app crashes as soon as i try to start it.
i only tried it on my ipad because when i try recompiling it for my iPhone6s im getting
this error msg: The maximum number of apps for free development profiles has been reached.
Domain: com.apple.dt.MobileDeviceErrorDomain
Code: -402620383

i only had the corona tracker on my iphone, nothing else which i compiled myself.
i deleted an older version, rebooted but still the same. i dont know how to solve this.
everything i found with google didnt help, any help welcome...

thnx
Helmar

App crashes after 3-4 days since last build

For some reason the app always crashes about 3-4 days after the build. Restarting the iPhone or exiting manually does not change this. This is now the case for several versions. Maybe it has something to do with memory management, the handling of the loaded data?

Feature request: Disable animations

However animations look nice at first sight, it's getting extremely annoying after you click the third marker on the map after each, and you still have to wait that second to see the graph. I think you should add an option to disable them or at least constraint to 0.1-0.3 sec in length.

No live map

On the application I can't see the map with live stats. I can see all the graphs. Just not the map.
iPhone 11 Pro Max iOS 13.3

Question

The app look very beautiful and profrssional.
can you please create a version for windows?
with c# language using winforms / wpf,
or just an exe for download and install the app on windows.
its will be great, thank you!

Validation Fails

I have the latest Xcode version, my code base is basically the same as yours. The change I made is not related to the problem libraries:

App Store Connect Operation Error
CFBundleIdentifier Collision. There is more than one bundle with the CFBundleIdentifier value 'CSV' under the iOS application 'CovidIntel.app'.

App Store Connect Operation Error
CFBundleIdentifier Collision. There is more than one bundle with the CFBundleIdentifier value 'Disk' under the iOS application 'CovidIntel.app'.

App Store Connect Operation Error
Invalid Bundle. The bundle at 'CovidIntel.app/PlugIns/Widget.appex' contains disallowed nested bundles.

App Store Connect Operation Error
Invalid Bundle. The bundle at 'CovidIntel.app/PlugIns/Widget.appex' contains disallowed file 'Frameworks'.

"Tracker" App

Hi there,

you name you're app a somehow "tracker".
For me this is confusing.
Now they started to develop real tracker apps, to track down people who are infected with
covid-19 and tracking their contacts.
Your app is only a dashboard, or?
So I would like to suggest to take out the "tracking" term from your repository.

What do you think about that?

Greets,
Ted

P.S.: I started to develop such a tracking app.
https://github.com/MadTed/PD-Tracking-App-hackthepandemic/blob/master/description_of_the_app.txt
And of course, it should also have a dashboard. Perhaps you like to contribute?

Stay at Home / Shelter in Place Orders

Is there any way we can map this out? From a data science perspective, conjoined with infection rates this seems like it could be a useful model to look at (in terms of the success of isolation efforts). Alternatively, I might be inclined to think that this information could be misleading to people who are not already in Stay at Home / Shelter in Place zones and may misunderstand or underestimate the risks associated with not isolating.

Thoughts? Is this data even available? Could we map it into the app?

Crash on app launch: Can't load 3rd party libraries

Now #37 is fixed, but if I try to compile and launch the app crashes with the following error:

dyld: Library not loaded: @rpath/Disk.framework/Disk
  Referenced from: /private/var/containers/Bundle/Application/146088EE-130F-4790-B27B-021A2DE1FA89/Corona Tracker.app/Corona Tracker
  Reason: image not found

Provinces only appear when the phone language is English

@FluffyDev2019 :

The apperence of regions does Only appear IF I change my system language to English, if I have Swedish chosen (as is Default to most Swedes), no Regional "Dots" and no information to it is shown.

Shouldn't Regional dots/data be available even if other languages then English as system language is chosen?

With English set as system language:

5ED8F99A-EB3E-4AA7-A404-C0D072DE9212

With Swedish set as system language:

2B80E78C-AF2E-4965-AA81-6DCE90790942

Missing data for Florida

1A0FC1B0-0703-4107-9F25-6B7399440ED7
FFCC33A0-2FD2-4299-B026-576C6B146AAA

App shows no data in Florida. However WHO has cases but location includes County name. Also Colorado. Kansas shows nothing but who has cases there also.

Adding unit tests?

Hi, I really like your project and appreciate that you're doing this! Would adding some tests to the app be beneficial? I want to help but this is my first time trying to contribute, and was wondering if this would be something I could help with. Thank you!

Plus-minus sign for death cases

Version 1.6 Mac

When I checked the situation in the US, it showed that the increment of death cases in the US was “+-15”. I guess it is caused by the decrease of reported death cases (needs to be confirmed by checking the dataset)? I’ve attached the screenshot, please notice the US death cases.

Screen Shot 2020-04-02 at 8 24 59 PM

Build fails for macOS

The build instantly fails with the following error:

multiple configured targets of 'CSV' are being created for macOS
multiple configured targets of 'Disk' are being created for macOS

image

Use worldometers.info for live data

The current data source is not up to date sometimes. A better option is worldometers. But there is no available API for this website, so we have to scrap the numbers and match country names with those from the time series.

City-level data for more countries

Detailed and official data sources for many countries here and here.

We need to look into them, and probably incorporate some of them into the app to show city-level data for more countries.

Currently, the app does that for the US, Canada, Australia, and China.

Adding localization

Might be a good idea to prepare this app for localization. No idea how this works on code level, but glad to help out with a German translation as soon as it becomes possible on code level.

Recommend Projects

  • React photo React

    A declarative, efficient, and flexible JavaScript library for building user interfaces.

  • Vue.js photo Vue.js

    🖖 Vue.js is a progressive, incrementally-adoptable JavaScript framework for building UI on the web.

  • Typescript photo Typescript

    TypeScript is a superset of JavaScript that compiles to clean JavaScript output.

  • TensorFlow photo TensorFlow

    An Open Source Machine Learning Framework for Everyone

  • Django photo Django

    The Web framework for perfectionists with deadlines.

  • D3 photo D3

    Bring data to life with SVG, Canvas and HTML. 📊📈🎉

Recommend Topics

  • javascript

    JavaScript (JS) is a lightweight interpreted programming language with first-class functions.

  • web

    Some thing interesting about web. New door for the world.

  • server

    A server is a program made to process requests and deliver data to clients.

  • Machine learning

    Machine learning is a way of modeling and interpreting data that allows a piece of software to respond intelligently.

  • Game

    Some thing interesting about game, make everyone happy.

Recommend Org

  • Facebook photo Facebook

    We are working to build community through open source technology. NB: members must have two-factor auth.

  • Microsoft photo Microsoft

    Open source projects and samples from Microsoft.

  • Google photo Google

    Google ❤️ Open Source for everyone.

  • D3 photo D3

    Data-Driven Documents codes.