GithubHelp home page GithubHelp logo

mlange-42 / git-graph Goto Github PK

View Code? Open in Web Editor NEW
418.0 7.0 15.0 215 KB

Command line tool to show clear git graphs arranged for your branching model

License: MIT License

Rust 100.00%
git git-graph git-flow gitlab-flow graph command-line command-line-tool rust

git-graph's Introduction

git-graph

Tests GitHub Crate MIT license

A command line tool to visualize Git history graphs in a comprehensible way, following different branching models.

The image below shows an example using the GitFlow branching model for a comparison between graphs generated by git-graph (far left) versus other tools and Git clients.

GitFlow was chosen for its complexity, while any other branching model is supported, including user-defined ones.

Graph comparison between tools

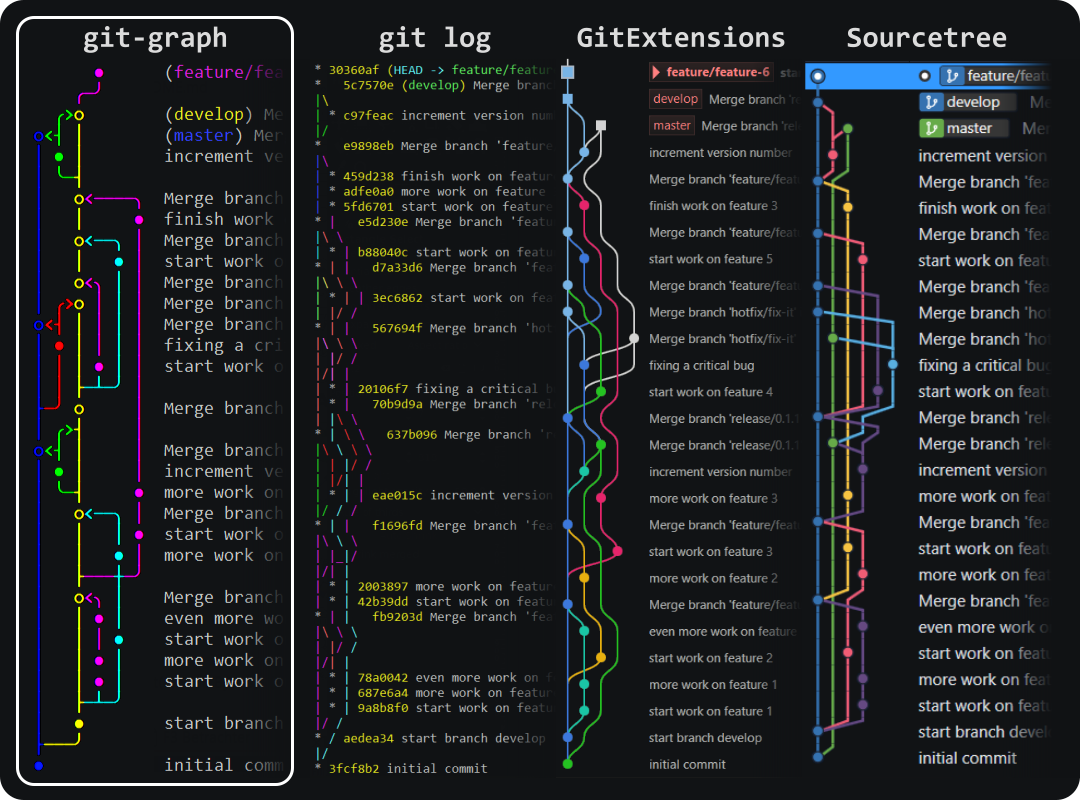
Decide for yourself which graph is the most comprehensible. ๐Ÿ˜Ž

If you want an interactive Git terminal application, see git-igitt, which is based on git-graph.

Features

  • View structured graphs directly in the terminal
  • Pre-defined and custom branching models and coloring
  • Different styles, including ASCII-only (i.e. no "special characters")
  • Custom commit formatting, like with git log --format="..."

Installation

Pre-compiled binaries

  1. Download the latest binaries for your platform
  2. Unzip somewhere
  3. Optional: add directory git-graph to your PATH environmental variable

Using cargo

In case you have Rust installed, you can install with cargo:

cargo install git-graph

Usage

For detailed information, see the manual.

For basic usage, run the following command inside a Git repository's folder:

git-graph

Note: git-graph needs to be on the PATH, or you need use the full path to git-graph:

C:/path/to/git-graph/git-graph

Branching models

Run git-graph with a specific model, e.g. simple:

git-graph --model simple

Alternatively, set the model for the current repository permanently:

git-graph model simple

Get help

For the full CLI help describing all options, use:

git-graph -h
git-graph --help

For styles and commit formatting, see the manual.

Custom branching models

Branching models are configured using the files in APP_DATA/git-graph/models.

  • Windows: C:\Users\<user>\AppData\Roaming\git-graph
  • Linux: ~/.config/git-graph
  • OSX: ~/Library/Application Support/git-graph

File names of any .toml files in the models directory can be used in parameter --model, or via sub-command model. E.g., to use a branching model defined in my-model.toml, use:

git-graph --model my-model

For details on how to create your own branching models see the manual, section Custom branching models.

Limitations

  • Summaries of merge commits (i.e. 1st line of message) should not be modified! git-graph needs them to categorize merged branches.
  • Supports only the primary remote repository origin.
  • Does currently not support "octopus merges" (i.e. no more than 2 parents)
  • On Windows PowerShell, piping to file output does not work properly (changes encoding), so you may want to use the default Windows console instead

Contributing

Please report any issues and feature requests in the issue tracker.

Pull requests are welcome. For major changes, please open an issue first to discuss what you would like to change.

git-graph's People

Contributors

djosh34 avatar kianmeng avatar mlange-42 avatar taro0079 avatar

Stargazers

 avatar  avatar  avatar  avatar  avatar  avatar  avatar  avatar  avatar  avatar  avatar  avatar  avatar  avatar  avatar  avatar  avatar  avatar  avatar  avatar  avatar  avatar  avatar  avatar  avatar  avatar  avatar  avatar  avatar  avatar  avatar  avatar  avatar  avatar  avatar  avatar  avatar  avatar  avatar  avatar  avatar  avatar  avatar  avatar  avatar  avatar  avatar  avatar  avatar  avatar  avatar  avatar  avatar  avatar  avatar  avatar  avatar  avatar  avatar  avatar  avatar  avatar  avatar  avatar  avatar  avatar  avatar  avatar  avatar  avatar  avatar  avatar  avatar  avatar  avatar  avatar  avatar  avatar  avatar  avatar  avatar  avatar  avatar  avatar  avatar  avatar  avatar  avatar  avatar  avatar  avatar  avatar  avatar  avatar  avatar  avatar  avatar  avatar  avatar  avatar

Watchers

 avatar  avatar  avatar  avatar  avatar  avatar  avatar

git-graph's Issues

Implement text-based visualization

So far, only output as SVG images is supported.

To better support pure console application, text-based printers are required. Optimally, git-graph should support ASCII as well as Unicode output.

For ASCII output, compare to git log --graph .... For Unicode output, git-forest or git-foresta might be a candidate for inspiration (for some images, see https://github.com/takaaki-kasai/git-foresta).

Unicode output can potentially produce clearer and more compact graphs, but may not be supported in every terminal.

Below are two possible versions how the following graph could look like in Unicode.

test

      โ—                    
      o<โ”               โ—  
      โ”‚ โ—               o  
โ—     โ”‚ โ”‚               โ”œ<โ”
โ”œโ”€โ”€โ”€โ”€โ”€โ”˜ โ”‚               โ”‚ โ—
โ—       โ”‚         โ—     โ”‚ โ”‚
o<โ”€โ”€โ”ฌโ”€โ”€โ”€โ”˜         โ”œโ”€โ”€โ”€โ”€โ”€โ”˜ โ”‚
โ”‚   โ—             โ—       โ”‚
โ”œโ”€โ”€>o             o       โ”‚
โ”‚   o<โ”€โ”€โ”         โ”œ<โ”€โ”€โ”ฌโ”€โ”€โ”€โ”˜
โ”‚   โ”‚   โ—         โ”‚   โ—    
โ”‚   โ”‚ โ— โ”‚         โ”‚   o    
โ”‚   โ”‚ โ”‚ โ—         โ”œโ”€โ”€>โ”ค    
โ”‚   โ”‚ โ”‚ โ—         โ”‚   o    
โ”‚   โ”œโ”€โ”ดโ”€โ”˜         โ”‚   โ”œ<โ”€โ”€โ”
โ”‚ โ”Œ>o             โ”‚   โ”‚   โ—
โ”‚ โ— โ”‚             โ”‚   โ”‚ โ— โ”‚
โ”‚ โ— โ”‚             โ”‚   โ”‚ โ”‚ โ—
o<โ”ค โ”‚             โ”‚   โ”‚ โ”‚ โ—
โ”‚ โ— โ”‚             โ”‚   โ”œโ”€โ”ดโ”€โ”˜
โ”‚ โ— โ”‚             โ”‚   o    
o<โ”ดโ”€โ”ค             โ”‚ โ”Œ>โ”ค    
โ”‚   o<โ”           โ”‚ โ— โ”‚    
โ”‚   โ”‚ โ—           โ”‚ โ— โ”‚    
โ”‚   โ”œโ”€โ”˜           o โ”‚ โ”‚    
โ”‚   โ—             โ”œ<โ”ค โ”‚    
โ”œโ”€โ”€โ”€โ”˜             โ”‚ โ— โ”‚    
o<โ”€โ”€โ”€โ”€โ”           โ”‚ โ— โ”‚    
โ”‚     โ—           o โ”‚ โ”‚    
โ”‚     โ—           โ”œ<โ”ดโ”€โ”ค    
โ”œโ”€โ”€โ”€โ”€โ”€โ”˜           โ”‚   o    
โ—                 โ”‚   โ”œ<โ”  
โ—                 โ”‚   โ”‚ โ—  
                  โ”‚   โ”œโ”€โ”˜  
                  โ”‚   โ—    
                  โ”œโ”€โ”€โ”€โ”˜    
                  o        
                  โ”œ<โ”€โ”€โ”€โ”€โ”  
                  โ”‚     โ—  
                  โ”‚     โ—  
                  โ”œโ”€โ”€โ”€โ”€โ”€โ”˜  
                  โ—        
                  โ—        

Find a way to combine topological and chronological order

Problem:

  • Commits should be in chronological order where possible (e.g. for synchronous work on multiple branches)
  • Does not conform with "broken" chronolgy through rebase

How git handles it:

  • git log shows chronological order, while
  • git log --graph shows topological order

For some considerations on that, and an algorithm for "remporal tolopogical sort", see https://pvigier.github.io/2019/05/06/commit-graph-drawing-algorithms.html

Later discovered that crate git2 allows to combine sort orders:

walk.set_sorting(git2::Sort::TOPOLOGICAL | git2::Sort::TIME)?;

which may already be the solution, but needs to be tested

Rendering breaks when commits have history outside scope

When rendering commits that have parents outside the rendered scope (by limiting using the -n flag) some commits look orphaned.

Ideally these should be rendered with the graph 'trailing' off the rendered screen, similar to the first screenshot.

Full history -n10
image image

Replace crate term_painter with another option for colored output

Disadvantages:

  • Does not work with write! etc., only with print!
  • Does not support truecolor
  • Causes misplaced line breaks, e.g. in a alacritty (which git does not)

Tests of other Crates:

  • yansi
    • Works with write!
    • Detects if color output is available (e.g. no coloring when piping to file)
    • Allows to enable color output on windows (Paint::enable_windows_ascii())
    • Supports text decoration (like bold or underlined)
    • Does not produce misplaced line breaks
    • Supports truecolor

Show tags and commits that can be reached through tags only

Problem: currently, only commits than can be reached from branches are displayed. "Unreachable" commits are filtered out to hide "remote commits" when option --local is given.

Commits only reachable from tags should also be displayed. Further, it should be possible to assign colors to "tag-only" commits.

Specify branch

The graph is always rendering all (local) branches and by default includes remote branches as well. I would like to limit rendering to commits that are only part of the currently checked out branch or a specified one.

Preferrably this would be the default configuration, while the current behaviour (listing all branch tips similar to git log --all) could be achieved by a flag such as git-graph --all.

Standard log graph model

I love the styling of the output of this tool and would like to use it more but I am so used to the standard log graph. I see you've got support for custom models, would it be possible to create a model that mimics the look of the standard log graph? And if so how might one go about doing that?

Document and rethink algorithms

Document algorithms for branch tracing, as well as sorting into columns.
Aims:

  • Provide the documentation for reference
  • Rethink algorithms, identify potential pitfalls
  • Simplify/structure code

(Sorting problems [#7] solved in solved with b5da905).

Better branch sorting algorithms

Currently, there are several branch sorting algorithms that are all suboptimal. The "best" so in most cases is ShortestFirst, which tries to keep short paths left (i.e. close to e.g. master or develop), where they in most cases branched from and merge into.

However, e.g. when branching from a feature branch and merging back into it, the results may be unsatisfying.

Optimally, the sorting algorithm would optimize the layout to minimize intersections between branches and merge/branch connections (i.e. non-vertical lines). A possible strategy would be to achieve that implicitly by trying to keep branches close to their "source" and/or "target". A more sophisticated strategy might optimize for minimal intersections explicitly.

How to change default white theme?

Hello , great job

Unfornutely idk why my font color is always white. Only when flag write --color always the theme is colored.

How can i permanently change the colors?

Enhance sorting of branches into visual columns

Problem: currently, branches are evaluated from top to bottom, which may result in the visualization on the left. Better would be the result on the right.

o         o
|\        |\
| \       | \
o  *      o  *
|\_|      |\ |
|  |\     | *|
|  | *    |/ |
| _|/     *  *
|/ |      | /
*  *      |/
| /       *
|/
*

Implement `Default` for `Settings` struct

Can I implement Default for Settings struct? I want to build more tests for this app, on this app is important to know the input/output of certain key functions. For example this one: print_unicode, you send it a GitGraph as input argument and it outputs a triplet of String<Vec>

By having the tests we can have living documentation on what every function has. A Default implementation for Settings will help me to build test data on the tests.

Branches merged from forks in separate columns/colors

Currently, merges of branch master/main from forks are displayed left of master/main, which may leave unnecessary space to the left.

Find a way to distinguish fork branches from repo branches, match them in RegEx separately.

This seems to be possible only by taking into account branch prefixes (i.e. user names) from merge summaries. Also, this would require to set up or detect the "owning user's" prefix(es).

watch mode?

This is so amazing!

Any way to support watch mode?

watch -n 2 git-graph

The above command does not support colors, unfortunately...

Colours are not displayed properly

Hi, I cannot reproduce the colours I see in the screenshots. I attach a picture of git-graph used on its own repository. I'm using the gnome terminal in Ubuntu and the model is git-flow. Do I have to configure anything else?

Captura desde 2024-03-07 15-25-55

Won't run

reference 'refs/remotes/qindapao/ellipse_rebase' not found

git log --graph works just fine

after removing them from .git/refs, git-graph worked fine

Allow selecting a sub-tree to draw instead, based on refspecs

Allow a vararg listing of refspecs, and visualize all n-1 refspecs with regards to the merge-base of the 1st refspec.

Or, in lay-mans terms: I have a main and two branches that were incrementally merged to main. I'd like the subgraph that tracs merge-base of all of the aforementioned refspecs on the bottom, the origin/main on top, and in-between the paths that those branches create with regards to main.

tl;dr:

$ git-graph master A B
 โ—‹<โ”€โ”€โ”                  cf43da7 (HEAD -> master, origin/master) Merge branch 'A' into 'master'
 โ—‹<โ” โ”‚                  ddcfb2d Merge branch 'B' into 'master'
 โ”‚ โ— โ”‚                  bcfb676 (B) ...
 โ”‚ โ”‚ โ—                  019ae78 (A) ,,,
 โ”œโ”€โ”ดโ”€โ”˜ 
 โ—‹                      9cca380 Merge branch 'X' into 'master'
$

Workarounds considered: git-graph -n 3, but -n 3 is not like git log -3: git-graph simply stops drawing at the 3rd line, instead of parsing+drawing HEAD~3... If you have a branch that's newer than the (origin/)master, then (origin/)master is not even visible

Recommend Projects

  • React photo React

    A declarative, efficient, and flexible JavaScript library for building user interfaces.

  • Vue.js photo Vue.js

    ๐Ÿ–– Vue.js is a progressive, incrementally-adoptable JavaScript framework for building UI on the web.

  • Typescript photo Typescript

    TypeScript is a superset of JavaScript that compiles to clean JavaScript output.

  • TensorFlow photo TensorFlow

    An Open Source Machine Learning Framework for Everyone

  • Django photo Django

    The Web framework for perfectionists with deadlines.

  • D3 photo D3

    Bring data to life with SVG, Canvas and HTML. ๐Ÿ“Š๐Ÿ“ˆ๐ŸŽ‰

Recommend Topics

  • javascript

    JavaScript (JS) is a lightweight interpreted programming language with first-class functions.

  • web

    Some thing interesting about web. New door for the world.

  • server

    A server is a program made to process requests and deliver data to clients.

  • Machine learning

    Machine learning is a way of modeling and interpreting data that allows a piece of software to respond intelligently.

  • Game

    Some thing interesting about game, make everyone happy.

Recommend Org

  • Facebook photo Facebook

    We are working to build community through open source technology. NB: members must have two-factor auth.

  • Microsoft photo Microsoft

    Open source projects and samples from Microsoft.

  • Google photo Google

    Google โค๏ธ Open Source for everyone.

  • D3 photo D3

    Data-Driven Documents codes.