GithubHelp home page GithubHelp logo

paulbrodersen / netgraph Goto Github PK

View Code? Open in Web Editor NEW
663.0 12.0 40.0 24.19 MB

Publication-quality network visualisations in python

License: GNU General Public License v3.0

Python 99.23% TeX 0.77%
network visualization network-analysis publication-quality-plots graph graph-tool igraph matplotlib network-science networkx

netgraph's Introduction

Netgraph

Publication-quality Network Visualisations in Python

Downloads DOI DOI

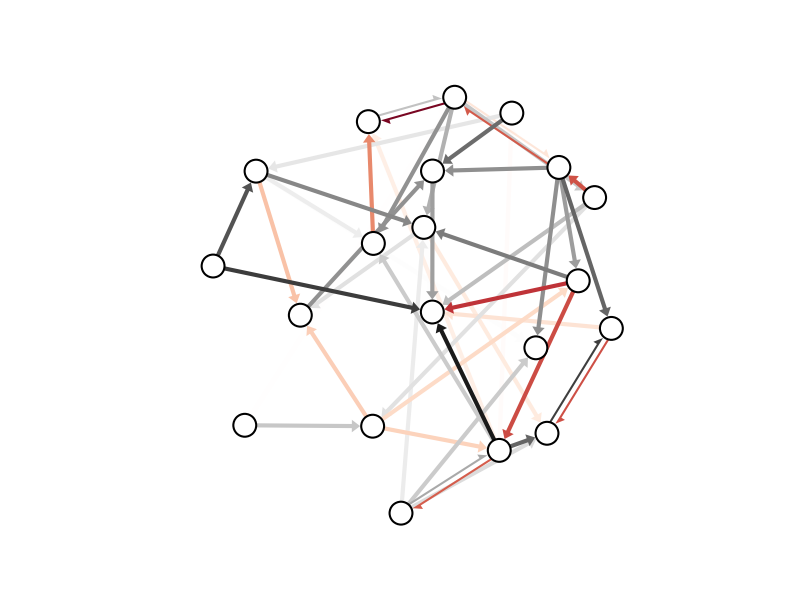
Netgraph is a Python library that aims to complement existing network analysis libraries such as such as networkx, igraph, and graph-tool with publication-quality visualisations within the Python ecosystem. To facilitate a seamless integration, Netgraph supports a variety of input formats, including networkx, igraph, and graph-tool Graph objects. Netgraph implements numerous node layout algorithms and several edge routing routines. Uniquely among Python alternatives, it handles networks with multiple components gracefully (which otherwise break most node layout routines), and it post-processes the output of the node layout and edge routing algorithms with several heuristics to increase the interpretability of the visualisation (reduction of overlaps between nodes, edges, and labels; edge crossing minimisation and edge unbundling where applicable). The highly customisable plots are created using Matplotlib, and the resulting Matplotlib objects are exposed in an easily queryable format such that they can be further manipulated and/or animated using standard Matplotlib syntax. Finally, Netgraph also supports interactive changes: with the InteractiveGraph class, nodes and edges can be positioned using the mouse, and the EditableGraph class additionally supports insertion and deletion of nodes and edges as well as their (re-)labelling through standard text-entry.

Installation

Install the current release of netgraph from PyPI:

pip install netgraph

If you are using (Ana-)conda (or mamba), you can also obtain Netgraph from conda-forge:

conda install -c conda-forge netgraph

Documentation

Numerous tutorials, code examples, and a complete documentation of the API can be found on ReadTheDocs.

Quickstart

import matplotlib.pyplot as plt
from netgraph import Graph, InteractiveGraph, EditableGraph

# Several graph formats are supported:

# 1) edge lists
graph_data = [(0, 1), (1, 2), (2, 0)]

# 2) edge list with weights
graph_data = [(0, 1, 0.2), (1, 2, -0.4), (2, 0, 0.7)]

# 3) full rank matrices
import numpy
graph_data = np.random.rand(10, 10)

# 4) networkx Graph and DiGraph objects (MultiGraph objects are not supported, yet)
import networkx
graph_data = networkx.karate_club_graph()

# 5) igraph.Graph objects
import igraph
graph_data = igraph.Graph.Famous('Zachary')

# 6) graph_tool.Graph objects
import graph_tool.collection
graph_data = graph_tool.collection.data["karate"]

# Create a non-interactive plot:
Graph(graph_data)
plt.show()

# Create an interactive plot, in which the nodes can be re-positioned with the mouse.
# NOTE: you must retain a reference to the plot instance!
# Otherwise, the plot instance will be garbage collected after the initial draw
# and you won't be able to move the plot elements around.
# For related reasons, if you are using PyCharm, you have to execute the code in
# a console (Alt+Shift+E).
plot_instance = InteractiveGraph(graph_data)
plt.show()

# Create an editable plot, which is an interactive plot with the additions
# that nodes and edges can be inserted or deleted, and labels and annotations
# can be created, edited, or deleted as well.
plot_instance = EditableGraph(graph_data)
plt.show()

# Netgraph uses Matplotlib for creating the visualisation.
# Node and edge artistis are derived from `matplotlib.patches.PathPatch`.
# Node and edge labels are `matplotlib.text.Text` instances.
# Standard matplotlib syntax applies.
fig, ax = plt.subplots(figsize=(5,4))
plot_instance = Graph([(0, 1)], node_labels=True, edge_labels=True, ax=ax)
plot_instance.node_artists[0].set_alpha(0.2)
plot_instance.edge_artists[(0, 1)].set_facecolor('red')
plot_instance.edge_label_artists[(0, 1)].set_style('italic')
plot_instance.node_label_artists[1].set_size(10)
ax.set_title("This is my fancy title.")
ax.set_facecolor('honeydew') # change background color
fig.canvas.draw() # force redraw to display changes
fig.savefig('test.pdf', dpi=300)
plt.show()

# Read the documentation for a full list of available arguments:
help(Graph)
help(InteractiveGraph)
help(EditableGraph)

Examples

Example visualisations

Citing Netgraph

If you use Netgraph in a scientific publication, I would appreciate citations to the following paper:

Brodersen, P. J. N., (2023). Netgraph: Publication-quality Network Visualisations in Python. Journal of Open Source Software, 8(87), 5372, https://doi.org/10.21105/joss.05372

Bibtex entry:

@article{Brodersen2023,
    doi     = {10.21105/joss.05372},
    url     = {https://doi.org/10.21105/joss.05372},
    year    = {2023}, publisher = {The Open Journal},
    volume  = {8},
    number  = {87},
    pages   = {5372},
    author  = {Paul J. N. Brodersen},
    title   = {Netgraph: Publication-quality Network Visualisations in Python},
    journal = {Journal of Open Source Software},
}

Recent changes

  • 4.13.1 Improved initialization of k parameter in get_fruchterman_reingold_layout (issue #79).
  • 4.13.0 Wrote an article on Netgraph for the Journal of Open Source Software (latest draft in /publication).
  • 4.12.12 Expanded the documentation to cover installation of optional dependencies, automated testing, and troubleshooting issues with Matplotlib event handling (issue #69).
  • 4.12.11 Mitigated a bug in EditableGraph that occurred when deleting a node while hovering over an edge incident to that node (issue #66).
  • 4.12.10 Fixed a bug with automatic node label rescaling if the node label fontsize was specified using the fontsize keyword argument (instead of just size).
  • 4.12.9 Fixed a bug that occurred when the distance argument to _shorten_line_by was equal or smaller than zero.
  • 4.12.8 Fixed a bug that occurred with recent numpy versions when using multi-partite or shell layouts with un-equal numbers of nodes in each layer (issue #65).
  • 4.12.7 Fixed a bug that occurred with recent Matplotlib versions when using the rectangle selector in InteractiveGraph.
  • 4.12.6 Added support for graphs with nodes but no edges to EditableGraph (issue #62).
  • 4.12.5 Added support for empty graphs in EditableGraph (issue #62).
  • 4.12.4 Turned off clipping of self-loop paths.
  • 4.12.3 Bugfix: stopped overwriting step parameter in get_community_layout.
  • 4.12.2 Improved node positions rescaling for some layouts & standardised node position padding across all layouts.
  • 4.12.1 Fixed a bug/deprecation issue that occurred with new versions of Matplotlib if an axis was provided (thanks @speedsmith!).
  • 4.12.0 Implemented the geometric node layout, which infers node positions from given edge lengths.
  • 4.11.8 Plotting of graphs with a single node is now actually supported. Thanks @Alexander-Wilms.
  • 4.11.7 Removed instances of (deprecated) np.float / np.int types (issue #58).
  • 4.11.6 Added documentation on hyperlinks (issue #56).
  • 4.11.5 Resolved a SyntaxWarning.
  • 4.11.4 Fixed a bug that occurred when using edge annotations.
  • 4.11.3 Cleaned build directory and removed several outdated files.
  • 4.11.2 Fixed a bug that prevented changing the axis background colour.
  • 4.11.1 Resolved warnings during build process.
  • 4.11.0 Switched from setup.py based installation to pyproject.toml/wheels.
  • 4.10.4 Added support for custom graph classes that inherit from networkx/igraph/graph-tool base Graph classes (issue #53).
  • 4.10.3 Improved the error message for incomplete iterable arguments (issue #55).
  • 4.10.2 Fixed issue #48 (again, sorry).
  • 4.10.1 Implemented flag that controls bundling of parallel edges in the curved edge layout (bundle_parallel_edges).
  • 4.10.0 Implemented grid-mode for the InteractiveGraph class to facilitate alignment of nodes (toggle with 'g').
  • 4.9.7 Fixed a bug introduced in version 4.9.5 in the computation of repulsive forces in the spring layout (i.e. the default layout).
  • 4.9.6 Fixed issue #51, which occurred in the community node layout if a node had no connections to other nodes in its community.
  • 4.9.5 Improved the routine that reduces node overlaps in the spring and community node layouts.
  • 4.9.4 Fixed a bug that occurred in get_curved_edges if the k parameter was not set explicitly.
  • 4.9.3 Improved placement of nodes in instances where all nodes are aligned within any one dimension.
  • 4.9.2 Fixed an issue that occurred when using the dot node layout for a graphs with multiple components.
  • 4.9.1 Fixed issue #48, which occurred when computing a curved edge layout for graphs with multiple components. Also improved edge routing slightly.
  • 4.9.0 Implemented a layered and a shell layout for multi-partite graphs.
  • 4.8.2 Fixed issue #45, which prevented a warning to be raised when trying to plot networkx.MultiGraph instances.
  • 4.8.1 Fixed issue #44, that occurred if a single node was plotted with the Sugiyama layout (thanks @wilkeber).
  • 4.8.0 Refined community node layout. Communities are rotated w.r.t. each other to reduce the length of edges between them.
  • 4.7.1 Fixed issue #41, which occurred when computing the community layout for communities without within-community edges.
  • 4.7.0 Implemented a radial tree node layout.
  • 4.6.0 Support drawing of graph_tool.Graph objects.
  • 4.5.0 Support custom mappings for mouse-over highlight events (issue #39).
  • 4.4.1 Corrected imports for testing _arcdiagram.py.
  • 4.4.0 Added bipartite node layouts.
  • 4.3.0 Added the ArcDiagram class and interactive/editable variants.
  • 4.2.4 Plotting of graphs with a single node is now supported.
  • 4.2.3 Fixed a bug that occurred when using the community layout with at least one community containing a single node.
  • 4.2.2 Fixed a bug that occurred every time an InteractiveGraph was initialised without tabular annotations.
  • 4.2.1 Added online documentation.

Help, I don't know how to do ...!

Please raise an issue. Include any relevant code and data in a minimal, reproducible example. If applicable, make a sketch of the desired result with pen and paper, take a picture, and append it to the issue.

Bug reports are, of course, always welcome. Please make sure to include the full error trace.

If you submit a pull request that fixes a bug or implements a cool feature, I will probably worship the ground you walk on for the rest of the week. Probably.

Finally, if you do email me, please be very patient. I rarely check the email account linked to my open source code, so I probably will not see your emails for several weeks, potentially longer. Also, I have a job that I love and that pays my bills, and thus takes priority. That being said, the blue little notification dot on GitHub is surprisingly effective at getting my attention. So please just raise an issue.

netgraph's People

Contributors

adleris avatar allanlrh avatar chenghuzi avatar danielskatz avatar hamedmp avatar paulbrodersen avatar speedsmith avatar vladimirfokow avatar

Stargazers

 avatar  avatar  avatar  avatar  avatar  avatar  avatar  avatar  avatar  avatar  avatar  avatar  avatar  avatar  avatar  avatar  avatar  avatar  avatar  avatar  avatar  avatar  avatar  avatar  avatar  avatar  avatar  avatar  avatar  avatar  avatar  avatar  avatar  avatar  avatar  avatar  avatar  avatar  avatar  avatar  avatar  avatar  avatar  avatar  avatar  avatar  avatar  avatar  avatar  avatar  avatar  avatar  avatar  avatar  avatar  avatar  avatar  avatar  avatar  avatar  avatar  avatar  avatar  avatar  avatar  avatar  avatar  avatar  avatar  avatar  avatar  avatar  avatar  avatar  avatar  avatar  avatar  avatar  avatar  avatar  avatar  avatar  avatar  avatar  avatar  avatar  avatar  avatar  avatar  avatar  avatar  avatar  avatar  avatar  avatar  avatar  avatar  avatar  avatar  avatar

Watchers

 avatar  avatar  avatar  avatar  avatar  avatar  avatar  avatar  avatar  avatar  avatar  avatar

netgraph's Issues

help with drawing a flowchart

I have two models both of which can output a value from fixed set of values (say ["A", "B", "C"]). For example, model_1 = ["A", "B", "C"], model_1 = ["A", "B", "C"]

I want to create a flowchart with starting nodes as model_1 and model_2 to show the following logic -

if output_model_1 = "A" and output_model_2 = "A":
   final_output = "A"
elif output_model_1 = "B" and output_model_2 = "B":
  final_output = "B"
elif output_model_1 = "C" and output_model_2 = "C":
  final_output = "C"
elif (output_model_1 = "A" and output_model_2 = "B") or (output_model_1 = "B" and output_model_2 = "A"):
  final_output = "C"
elif (output_model_1 = "A" and output_model_2 = "C") or (output_model_1 = "C" and output_model_2 = "A"):
  final_output = "A"
elif (output_model_1 = "B" and output_model_2 = "C") or (output_model_1 = "C" and output_model_2 = "B"):
  final_output = "B"

Can you please help? Many thanks!

Supporting highlighting nodes on mouse over.

Based on this problem it would be nice to have an option of highlighting a collection of nodes depending on some input dictionary when I mouse over some key node.

My example code so far:

import matplotlib.pyplot as plt
import networkx as nx

from netgraph import Graph # pip install netgraph

node_labels = {1: 'pโ†’q', 2: 'ยฌq', 3: 'ยฌ (ยฌp)', 4: 'ยฌp', 5: 'ยฌpโˆง ยฌ (ยฌp)', 6: 'p', 7: 'q', 8: 'qโˆง ยฌq', 9: 'ยฌp'}
color_map = {1: 'red', 2: 'red', 3: 'red', 4: 'red', 5: 'lightblue', 6: 'lightblue', 7: 'lightblue', 8: 'lightblue', 9: 'blue'}
edge_labels = {(3, 5): 'โˆงI', (4, 5): 'โˆงI', (4, 6): 'ยฌE', (5, 6): 'ยฌE', (1, 7): 'โ†’E', (6, 7): 'โ†’E', (2, 8): 'โˆงI', (7, 8): 'โˆงI', (8, 9): 'ยฌE', (3, 9): 'ยฌE'}
highlight = {1: {1}, 2: {2}, 3: {3}, 4: {4}, 5: {3, 4, 5}, 6: {3, 6}, 7: {1, 3, 7}, 8: {1, 2, 3, 8}, 9: {1, 2, 9}}

graph = nx.from_edgelist(edge_labels, nx.DiGraph())

Graph(graph, node_layout='dot',
      node_labels=node_labels, node_label_fontdict=dict(size=21),
      edge_labels=edge_labels, edge_label_fontdict=dict(size=14), edge_label_rotate=False,
      node_color=color_map, node_edge_color=color_map, arrows=True
)

plt.show()

The dictionary highlight could be a possible input parameter. The functionality could be similar to that one of the interactive graphs.
If I mouse over some key node from the dictionary highlight int the example code, the functionality would highlight all the value nodes. For example, mouse over node 9 would highlight nodes 1, 2, 9, because of the following shape of highlight = ... **9: {1, 2, 9}**}

I need this to highlight the origin assumptions of some the propositions in proof graphs like the one in the example above. The most simple approach for me so far is this library at moment and so it would be nice to have this functionality in it too. Thank you!

Unable to use it for large graphs

Hello,
I have encountered the same error several times and I finally took some time to check that it indeed comes from the package. Here is a reproducible example :

import numpy
from netgraph import Graph
n_nodes = 2730
A = np.random.binomial(n =1, p = 0.002, size = (n_nodes ,n_nodes ))
clusters = np.random.randint(5, size=n_nodes )
G = nx.from_numpy_array(A, create_using=nx.DiGraph)
print('Is the graph weakly connected ? : {}'.format(nx.is_weakly_connected(G)))
print('Is the graph strongly connected ? : {}'.format(nx.is_weakly_connected(G)))
G_netgraph = Graph(G;
             node_layout="community",
             edge_layout='straight',
             node_layout_kwargs=dict(node_to_community = {node:clusters[node] for node in G.nodes} )
             )

I get the following error : KeyError: 13
The key changes with the graphs.

If you have a hint of what's happening, I would really appreciate it. I would love to use the package on large graph. The plots are really beautiful.
Thanks
Rรฉmi

Is there way to get position of node after manual tweaking?

Hi,

Excellent job for the Interactivity drawing network.

In my case, I'll draw rectangles after each node to represent their attributions. So I wonder if there is a way to get node position so I can refresh the matplotlib drawing?

Like this example, I wanna move the rectangles together with nodes.
jjaIsS.png

Here is my code in jupyterlab

%matplotlib widget
import matplotlib
import numpy as np
import matplotlib.pyplot as plt; plt.ion()
import networkx as nx
import netgraph

fig, axs = plt.subplots(figsize = (10,10))

nodes = np.array(['A', 'B', 'C', 'D', 'E', 'F', 'G'])
edges = np.array([['A', 'B'], ['A', 'C'], ['B', 'D'], ['B', 'E'], ['C', 'F'], ['C', 'G']])
pos_ = np.array([[0, 0], [-2, 1], [2, 1], [-3, 2], [-1, 2], [1, 2], [3, 2]])

G = nx.Graph()
G.add_nodes_from(nodes)
G.add_edges_from(edges)

x_move = 0
y_move = 0
block_size = 0.5
for pos in pos_:
	rect1  = matplotlib.patches.Rectangle((pos[0]+x_move,pos[1]+y_move), 0.85*block_size, 0.75*block_size, facecolor='red', edgecolor=None)
	axs.add_patch(rect1)

I = netgraph.InteractiveGraph(G,
                              node_positions=dict(zip(nodes, pos_)),
                              node_labels=dict(zip(nodes,nodes)),
                              node_label_bbox=dict(fc="lightgreen", ec="black", boxstyle="square", lw=3),
                              node_size=12,
)

Division by zero when rescaling vertically aligned components

Hi Paul!
First, thank you for netgraph! I find it really useful to visualize parts of my work and I love the InteractiveGraphs!
Now to the issue I came across. I use netgraph to visualize computational graphs I build and reconfigure, i.e., mostly to check that whatever I configured is connected correctly. The sugiyama layout works sufficiently well for this purpose, but sometimes my graph is split into multiple components. For small sub-graphs, the sugiyama layout vertically aligns the nodes, which creates a problem when rescaling the layout to fit into the bounding box. Basically, I run into a division by zero at the following line:

node_positions /= np.max(node_positions, axis=0)

Here is a minimal reproducible example that triggers this case:

import networkx as nx
import netgraph as ng

G = nx.DiGraph()
G.add_node('A')
G.add_node('B')
G.add_edge('A', 'B')
edge_list = [edge for edge in G.edges]
node_layout = ng.get_sugiyama_layout(edge_list)

The result is that the node positions contain nan values:

node_layout
{'A': array([nan,  1.]), 'B': array([nan, -0.])}

I understand that you are quite busy, so I'll leave here my suggested fix. For my cases, it seems that simply not normalizing when the nodes are aligned, should do the trick:

np.divide(node_positions, np.max(node_positions, axis=0), where=np.max(node_positions, axis=0) != 0, out=node_positions)

instead of

node_positions /= np.max(node_positions, axis=0)

Best,
Pablo

zero-size array to reduction operation minimum which has no identity

Trying to create a community network graph but fails with the error:
*ValueError: zero-size array to reduction operation minimum which has no identity*

Everything works using networksx, but since netgraph allows for edge bundling and prettier graphs I would love for it to work.
The only code needed to reproduce would be the one below (links_filtered is a pandas edgelist).

G=nx.from_pandas_edgelist(links_filtered, 'from', 'to')

node_to_community = community.community_louvain.best_partition(G)

Graph(G, node_layout='community', node_layout_kwargs=dict(node_to_community=node_to_community))

How to modify node_label_fontdict?

I apologize for posting this here, as it is not a bug or issue but instead a question regarding the adjustment of node label font sizes, one that I doubt would yield a response on StackOverflow.

At https://netgraph.readthedocs.io/en/latest/graph_classes.html

it states that node_label_fontdict consists of keyword arguments passed to matplotlib.text.Text. I'm looking at matplotlib.text.Text right now and see the familiar keyword argument fontsize. It's not clear what an example dictionary, node_label_fontdict would look like if I merely wanted to change my label font size.

BTW, this package is really nice. I plan to use it for community detection in the context of EEG signal analysis.

Curved layout does not work for multi-component graphs.

Hi Paul,

I am having a problem with the scale parameter of the Graph class.
First of all, I am not assigning any value to it and I leave it as the default (1.0 1.0).
Debugging a bit, I figure out that that value is changed internally by the function "get_layout_for_multiple_components" to (0.67, 1). In this way I always get an error saying that some of the nodes are outside the origin-scale area.

I tried with the spring, circular and multipartite layout and all of them produce the same error.
Am I setting something wrong?

Graph(G, 
            node_layout = 'circular',
            node_size = 8,
            node_color = node_color,
            node_labels = node_label,
            node_edge_width = border,
            node_label_fontdict = dict(size=font_size),
            node_edge_color = edge_color,
            node_label_offset = 0.15,
            node_alpha = 1,
                
            arrows = True,
            edge_layout = 'curved',
            edge_label = show_edge_labels,
            edge_labels = edge_label,
            edge_label_fontdict = dict(size=font_size),
            edge_color = edge_color, 
            edge_width = edge_width,
            edge_label_position = 0.35)

Interactive Graph not working in Jupyter notebook

Hello,

I can generate a directed graph using the code in the readme file, but when it displays in Jupyter notebook it is not interactive. Is there something I need to enable in Jupyter Notebooks to make the image interactive? I do not see any other guidance in your documentation.
Here is my code:

import networkx as nx
import matplotlib.pyplot as plt
import netgraph

edgls = [(1,2),(2,6),(1,2),(2,6),(2,12),(3,2),(3,9),(3,7),(3,8),(4,15),
         (4,12),(5,16),(5,18),(6,24),(7,25),(8,25),(8,15),(9,15),(9,19),
         (9,12),(10,14),(11,10),(12,13),(13,14),(13,19),(14,10),(15,6),
         (15,10),(16,14),(16,20),(16,22),(17,14),(17,26),(18,17),(19,11),
         (20,6),(21,22),(21,15),(23,6),(25,21),(26,9)]

sdmodel = nx.DiGraph()
sdmodel.add_edges_from(edgls)

plt.figure(figsize=(11,11))
netgraph.draw(sdmodel)

plot_instance = netgraph.InteractiveGraph(sdmodel)

Thank you!

Interactive Graph: starting node positions

Is it somehow possible to start the interactive Graph with previously serialized node_positions?

I have successfuly used the interactive graph to define my layout but now I would like to edit it when a new node is added.

I tried overwritting it directly but that only breaks everything.

interGraph = netgraph.InteractiveGraph(graph)
interGraph.node_positions = new_positions

I'm trying to use this to accomplish a Process Status Monitoring:

image

Type checking of graph objects

When I create a class that simply inherits a networkx Graph, the plotter won't work. For example, this works fine:

g = networkx.Graph([(1,2)])
netgraph.Graph(g)

However if I do a simple inheritance I get an error.

class NewGraph(networkx.Graph):
    pass
g = NewGraph([(1,2)])
netgraph.Graph(g)
NotImplementedError: Input graph must be one of: 

	list
	tuple
	set
	networkx.Graph
	igraph.Graph
Currently, type(graph) = <class '__main__.NewGraph'>

Instead of checking the graph objects with isinstance, it's doing a string check of the class name in _parser.py. Per the code's comments, this is to avoid importing (potentially slow or non-existent) modules just for type checking. However this prevents any possibility of extending code.

Is it possible to allow importing for type checking? What's the standard way to do this in python? I'm assume it's a try-except for the module imports and keeping track of which are loaded. Are igraph and networkx so slow to import that this can't be done?

In the meantime I need this capability badly enough that I've monkey patched my way around it.

Error when plotting community with only one node

Code example:

import networkx as nx
import netgraph as ng
import matplotlib.pyplot as plt

graph = nx.Graph([(0, 1)])
ng.Graph(graph, node_layout='community', node_layout_kwargs={'node_to_community': {0: 0, 1: 1}})
plt.show()

Error trace:

Traceback (most recent call last):
  File "D:\Projects\PycharmProjects\CommunityDetection\netgraph_bug.py", line 7, in <module>
    ng.Graph(graph, node_layout='community', node_layout_kwargs={'node_to_community': {0: 0, 1: 1}})
  File "C:\ProgramData\Miniconda3\envs\CommunityDetection\lib\site-packages\netgraph\_main.py", line 1306, in __init__
    super().__init__(edges, *args, **kwargs)
  File "C:\ProgramData\Miniconda3\envs\CommunityDetection\lib\site-packages\netgraph\_main.py", line 286, in __init__
    self.node_positions = self._initialize_node_layout(
  File "C:\ProgramData\Miniconda3\envs\CommunityDetection\lib\site-packages\netgraph\_main.py", line 426, in _initialize_node_layout
    return self._get_node_positions(node_layout, node_layout_kwargs, origin, scale)
  File "C:\ProgramData\Miniconda3\envs\CommunityDetection\lib\site-packages\netgraph\_main.py", line 441, in _get_node_positions
    node_positions = get_community_layout(
  File "C:\ProgramData\Miniconda3\envs\CommunityDetection\lib\site-packages\netgraph\_node_layout.py", line 62, in wrapped_layout_function
    return layout_function(edges, *args, **kwargs)
  File "C:\ProgramData\Miniconda3\envs\CommunityDetection\lib\site-packages\netgraph\_node_layout.py", line 870, in get_community_layout
    relative_node_positions = _get_node_positions(edges, node_to_community)
  File "C:\ProgramData\Miniconda3\envs\CommunityDetection\lib\site-packages\netgraph\_node_layout.py", line 931, in _get_node_positions
    subgraph_node_positions = get_fruchterman_reingold_layout(
  File "C:\ProgramData\Miniconda3\envs\CommunityDetection\lib\site-packages\netgraph\_node_layout.py", line 62, in wrapped_layout_function
    return layout_function(edges, *args, **kwargs)
  File "C:\ProgramData\Miniconda3\envs\CommunityDetection\lib\site-packages\netgraph\_node_layout.py", line 257, in get_fruchterman_reingold_layout
    assert len(edges) > 0, "The list of edges has to be non-empty."
AssertionError: The list of edges has to be non-empty.

Package versions:

networkx=2.6.3
netgraph=4.6.1

Arrow style unintentinally changed when using Matplotlib 2?

Hi, first of all, I'm really glad you made this... it produces really nice plots for weighted graphs, which is something I've missing!

There are however some small problems when using Matplotlib 2:

  1. There's a gigantic margin around the plot.
  2. The arrows are now of the 'fancy' type, not the 'simple' type โ€“ see what I mean by 'fancy' and 'simple' in this Matplotlib Gallery Example:

Your plot:

My plot (1200 dpi, white border cropped):

My plot (Matplotlib default dpi, uncropped):

Also, these warnings are thrown:

/Users/allan/src/netgraph/netgraph.py:129: RuntimeWarning: invalid value encountered in less
  weights[weights<edge_vmin] = edge_vmin
/Users/allan/src/netgraph/netgraph.py:130: RuntimeWarning: invalid value encountered in greater
  weights[weights>edge_vmax] = edge_vmax
/Users/allan/homeInstalled/miniconda3/envs/py36/lib/python3.6/site-packages/matplotlib/colors.py:494: RuntimeWarning: invalid value encountered in less
  cbook._putmask(xa, xa < 0.0, -1)
/Users/allan/src/netgraph/netgraph.py:612: RuntimeWarning: invalid value encountered in true_divide
  v = v / np.linalg.norm(v) # unit
/Users/allan/src/netgraph/netgraph.py:620: RuntimeWarning: divide by zero encountered in double_scalars
  dx *= (r-offset)/r
/Users/allan/src/netgraph/netgraph.py:620: RuntimeWarning: invalid value encountered in double_scalars
  dx *= (r-offset)/r
/Users/allan/src/netgraph/netgraph.py:621: RuntimeWarning: divide by zero encountered in double_scalars
  dy *= (r-offset)/r
/Users/allan/src/netgraph/netgraph.py:621: RuntimeWarning: invalid value encountered in double_scalars
  dy *= (r-offset)/r

Some things regarding InteractivelyConstructDestroyGraph

Hi, I ran into an issue when using InteractivelyConstructDestroyGraph where deleting nodes would not delete the node from the dictionary node_positions. Adding del self.node_positions[node] to the method _delete_node(self, node) in _interactive_invariants.py resolved the issue for me.

I am also having an issue where newly added nodes sometimes can not be used (deleted, moved, adding edges to other nodes) until another node has been selected and the initial node has been reselected.

To reproduce it keep adding and deleting one node at the time. Eventually the node won't be deletable. The error that pops up is the following

Traceback (most recent call last):
  File "C:\...\matplotlib\cbook\__init__.py", line 196, in process
    func(*args, **kwargs)
  File "C:\...\netgraph\_interactive_variants.py", line 462, in _on_key_add_or_destroy
    self._delete_nodes()
  File "C:\...\netgraph\_interactive_variants.py", line 511, in _delete_nodes
    nodes = [self._draggable_artist_to_node[artist] for artist in self._selected_artists]
  File "C:\...\netgraph\_interactive_variants.py", line 511, in <listcomp>
    nodes = [self._draggable_artist_to_node[artist] for artist in self._selected_artists]
KeyError: <matplotlib.patches.Circle object at 0x00000207CE248708>

The issue is minor since it does not break anything but slightly annoying.

For something completely different. I also found it very useful to uncomment the line for adding bidirectional edges in _add_edges(self), moving it to a new separate method _add_bidirectional_edges(self) and adding a hotkey.

Unable to scale figure with Netgraph on PyQt window

Hello!

I am trying to embed Netgraph's plots inside my PyQt application, however I am not being able to make the figure occupy the entire window nor scale with it. The graphs keep touching only one of the borders of the figure, and I can't make the figure in only one direction (x or y).

It's been a while since I started to try to make this right, looking into MatPlotLib's documentations. I have even written a few questions at StackOverflow about it, however without any success.(Scalable MatPlotLib Figure with PyQt window and FigureCanvas not entirely filing PyQt Window)

The behavior I face can be seen in the image:

image

It is possible to see that the graph can't touch the horizontal borders of the Window, doesn't matter how I scale it. I also keep receiving this Warnings whenever I touch the blank space between the border of the Figure and the border of the Window.

What I want is for the graph to always touch the border of the window.

Could you help me somehow? At this point I don't know if this could be something related to the Netgraph library itself.
Here is the code I am using for testing:

import sys
import matplotlib; matplotlib.use("Qt5Agg")

from PyQt5 import QtWidgets
from matplotlib.backends.backend_qt5agg import FigureCanvasQTAgg
import matplotlib.pyplot as plt
from netgraph import EditableGraph


class MplCanvas(FigureCanvasQTAgg):
    def __init__(self, parent=None):
        figure = plt.figure()
        figure.set_figheight(8)
        figure.set_figwidth(6)
        plt.tight_layout()
        figure.patch.set_visible(False)
        super(MplCanvas, self).__init__(figure)
        self.setParent(parent)
        self.ax = plt.axes([0,0,1,1], frameon=False)
        self.ax.axis('off')
        self.ax.get_xaxis().set_visible(False)
        self.ax.get_yaxis().set_visible(False)
        self.graph = EditableGraph([(0, 1)], ax=self.ax)
        plt.autoscale(axis='both', tight=True)
        self.updateGeometry()


class MainWindow(QtWidgets.QMainWindow):
    def __init__(self, *args, **kwargs):
        super(MainWindow, self).__init__(*args, **kwargs)

        self.canvas = MplCanvas(self)
        self.lbl = QtWidgets.QLabel(self)
        self.setCentralWidget(self.canvas)


def main():

    app = QtWidgets.QApplication(sys.argv)
    w = MainWindow()
    w.show()
    app.exec_()


if __name__ == "__main__":
    main()

netgraph doesn't recognize nx.DiGraph() as a directed graph

Hello,
When running the following code, netgraph doesn't draw arrows on edges.
Doesn't netgraph recognize the following G as a directed graph?

import matplotlib.pyplot as plt
import netgraph
import networkx as nx
n = 5
G = nx.DiGraph()
G.add_nodes_from(range(n))
G.add_edges_from([(i, (i+1)%n) for i in range(n)]) # directed cycle
plt.subplots(1,1)
netgraph.draw(G, directed=True) # doesn't draw arrows
plt.show()

cycle_graph

Redrawing Edge Labels

I am working on a visualization of a network that includes moveable nodes with edge labels that are updated by streaming data. Currently I am using randint to update a pandas dataframe while I work on the plotting.

The current code can generate the nodes and allows them to move and also updates the edge labels, but it feels "clunky" and every once in a while the plot flashes the axes (which I do not want to see). I believe this is just an artifact of clearing and regenerating the plot. I can't seem to find a good hook in netgraph to simply refresh graph without doing a clear and redraw which will inevitably get worse as the network grows. Any ideas on how to make this smoother?

Here is the current code:

import pandas as pd
import matplotlib.pyplot as plt
#plt.ion()
import networkx as nx
import random as r
import netgraph
import numpy as np

#Graph creation:
G=nx.Graph(type="")

#edges automatically create nodes
df=pd.read_csv('diyNodeSet.csv')  
G = nx.from_pandas_edgelist(df, source='sdr', target='rxr', \
    create_using=nx.DiGraph)

#Create edge list from dataframe
df['xy']=list(zip(df.sdr,df.rxr))
ed=list(zip(df.br,df.pct))
el=dict(zip(df.xy,ed))

pos = nx.layout.circular_layout(G)  ##initial node placement

# drag nodes around #########
plot_instance =   netgraph.InteractiveGraph(G,  node_positions=pos, node_color='red', edge_labels=el)

#update the edge labels with random data
import threading
interval = 3

def updatePlot(oldPlot):
    nodePos=oldPlot.node_positions
    new_pct=pd.Series([r.randint(1, 100),r.randint(1, 100),r.randint(1, 100),r.randint(1, 100)], name='pct', index=[0,1,2,3])
    df.update(new_pct)
    ed=list(zip(df.br,df.pct))
    el=dict(zip(df.xy,ed))
    oldPlot.fig.clear()
    global plot_instance
    plot_instance =   netgraph.InteractiveGraph(G,  node_positions=nodePos, node_color='red', edge_labels=el)

#call update each interval    
def startTimer():
    threading.Timer(interval, startTimer).start()
    updatePlot(plot_instance)
   
startTimer()

Orthogonal layout

Is there any way to render the network graph with orthogonal layout?

RecursionError: maximum recursion depth exceeded while calling a Python object

I have a large network which for which I would like to visualize communities and multiple components.

I can load it in Cytoscape and do it there but I was looking for pythonic solution as it is much easier to export publication quality plot from matplotlib than Cytoscape.

However, it fails with RecursionError: maximum recursion depth exceeded while calling a Python object.

Is there a way to override this? I am working on a computer cluster and have enough RAM and memory for handling this

My notarization of a Mac app is failing, and I'm wondering if netgraph is the cause.

I'm developing some software for Mac using python, tkinter, and pyinstaller. As I add more features, I check to make sure the result can be successfully notarized by Apple. Now notarization fails, and the error log is making reference to QtDesigner, QtWebView, QtBluetooth, and a few other executables starting with Qt. My software was not written using QtDesigner, and I've never seen any of the names before. Are they associated with netgraph, the only new module I've installed since my last successful notarization? If so, are they necessary for use of the Graph class, which is all I really need right now from netgraph for purposes of creating static plots of network communities.

If the above executables aren't really necessary for using the Graph class, I will probably delete them from my software package's contents.

Thanks

Paul

Deprecation issue installing netgraph

I tried to install netgraph in my project, and this problem appeared;

DEPRECATION: netgraph is being installed using the legacy 'setup.py install' method, because it does not have a 'pyproject.toml' and the 'wheel' package is not installed. pip 23.1 will enforce this behaviour change. A possible replacement is to enable the '--use-pep517' option. Discussion can be found at https://github.com/pypa/pip/issues/8559

Would it be possible to update netgraph to match these new installation settings?

Interactive Netgraph does not show directed edges

Hi,
Thanks a lot for the library!

I wanted to draw a directed graph in interactive format.

import matplotlib.pyplot as plt
import netgraph
import networkx as nx
n = 5
G = nx.DiGraph()
G.add_nodes_from(range(n))
G.add_edges_from([(i, (i+1)%n) for i in range(n)]) # directed cycle
plot_instance = netgraph.InteractiveGraph(G, draw_arrows=True, directed=True,node_labels=True)
#netgraph.draw(G, draw_arrows=True) # doesn't draw arrows
plt.show()

The intended graph should look like this: (contains arrow)
Screenshot 2021-09-28 at 2 13 08 PM

But the code above generates a graph like this: (has no arrow)
Screenshot 2021-09-28 at 2 14 36 PM

How can I include arrow in interactive graphs?
Thank you!

Can I connect two graphs and still retain their individual references?

Hi! I am using Networkx to draw several graphs in a figure. Each graph is represented in a circular layout and may have an edge with another circle. The issue is that I can't use Networkx's union function, otherwise I'll end up with a single graph if two individual ones have an edge between them. What I wanted was to just join them with an edge but still retain their individual references, since it may be that I there is a link between one of the graphs mentiones earlier and another one in the future. The reference is important to me because I still want to be able to plot them individually in a circle layout, rather than plotting them together in a circle layout.

Cheers!

Hyperlink or selectable text from annotations?

Hey,

I'm currently using the library on a project and have a usecase for linking to a URL based on node attributes. I have the annotation showing on node click, but realized that the link is not selectable or clickable. Would it be possible to do either of those (hyperlinks would be preferred but selectable text is good too)?

Thanks

Plt does not work on Pycharm IDE

The plots generated by your examples in the readme quickly open and then crash/close. No error message is shown. Thus, I believe it's some sort problem either Pycharm IDE or compatibility issues with the latest version matplotlib.

Support for NetworkX Multigraph?

Hi,
I have been trying to plot multigraphs using netgraph but it seems it is not supported. Here is a minimal example and error message:

# Simple example of a graph with two nodes and two parallel edges between them
G = nx.MultiDiGraph()
G.add_nodes_from(range(2))
G.add_edge(0, 1, key=0, weight=1)
G.add_edge(0, 1, key=1, weight=1)
# plot the graph using netgraph
Graph(G,node_labels={0:'a',1:'b'},edge_layout='curved',arrows=True)

Error Trace:

---------------------------------------------------------------------------
ValueError                                Traceback (most recent call last)
/var/folders/8t/nc0dxp394llg8dc047hmbqsh0000gn/T/ipykernel_54472/3976304237.py in <module>
      5 G.add_edge(0, 1, key=1, weight=1)
      6 # plot the graph using netgraph
----> 7 Graph(G,node_labels={0:'a',1:'b'},edge_layout='curved',arrows=True)

/opt/anaconda3/lib/python3.9/site-packages/netgraph/_main.py in __init__(self, graph, edge_cmap, *args, **kwargs)
   1352             kwargs.setdefault('node_zorder', node_zorder)
   1353 
-> 1354         super().__init__(edges, *args, **kwargs)
   1355 
   1356 

/opt/anaconda3/lib/python3.9/site-packages/netgraph/_main.py in __init__(self, edges, nodes, node_layout, node_layout_kwargs, node_shape, node_size, node_edge_width, node_color, node_edge_color, node_alpha, node_zorder, node_labels, node_label_offset, node_label_fontdict, edge_width, edge_color, edge_alpha, edge_zorder, arrows, edge_layout, edge_layout_kwargs, edge_labels, edge_label_position, edge_label_rotate, edge_label_fontdict, origin, scale, prettify, ax, *args, **kwargs)
    267                  *args, **kwargs
    268     ):
--> 269         self.edges = _parse_edge_list(edges)
    270 
    271         self.nodes = self._initialize_nodes(nodes)

/opt/anaconda3/lib/python3.9/site-packages/netgraph/_parser.py in _parse_edge_list(edges)
    138     """Ensures that the type of edges is a list, and each edge is a 2-tuple."""
    139     # Edge list may be an array, or a list of lists. We want a list of tuples.
--> 140     return [(source, target) for (source, target) in edges]
    141 
    142 

/opt/anaconda3/lib/python3.9/site-packages/netgraph/_parser.py in <listcomp>(.0)
    138     """Ensures that the type of edges is a list, and each edge is a 2-tuple."""
    139     # Edge list may be an array, or a list of lists. We want a list of tuples.
--> 140     return [(source, target) for (source, target) in edges]
    141 
    142 

ValueError: too many values to unpack (expected 2)

ArcDiagram node_order layout param not being applied

Hi there! Very nice library, trying to leverage the ArcDiagram plot and running into an issue. I'm creating a graph where the nodes represent percentages (string labels '0' to '100') and the edges are all from '0' to whatever the percentage is for the datapoint (e.g. '55'). I would like to render the arc diagram with the nodes arranged 0-100 in a linear fashion, and am passing in the ordered list of nodes to the ArcDiagram constructor's node_order param as ['0', '1', '2',...'99', '100'] but the graph rendering appears to be ignoring this.

Am I using node_order incorrectly or is it not being applied for some reason?

Thanks!

"fixed_nodes" argument of get_fruchterman_reingold_layout function isn't handled properly for multi-component graphs

python version: 3.8.10
netgraph version: 4.1.0

I'm trying to use the get_fruchterman_reingold_layout function to get node positions for plotting. When used on edges/nodes from a small graph, it fails, raising ValueError: Some given node positions are not within the data range specified by origin and scale! and showing different scale values than the ones that were actually provided.

Below is a minimal example: using the smaller list of edges results in error, while the second, bigger one, is fine.

#! /usr/bin/env python3

import netgraph

import warnings
warnings.filterwarnings("ignore")

nodes = [0, 1, 2, 3, 4, 5, 6, 7, 8, 9, 10, 11, 12, 13, 14, 15, 16, 17, 18, 19, 20, 21, 22, 23, 24, 25, 26, 27, 28, 29, 40, 41, 42, 43, 44, 45, 46, 47, 48, 49, 50, 51, 52, 53, 54, 55, 56, 57, 58, 59, 60, 61, 62, 63, 64, 65, 66, 67, 68, 69]

# not enough edges
edges = [(0, 5), (0, 8), (0, 21), (0, 27), (1, 6),]

# enough edges
#edges = [(0, 5), (0, 8), (0, 21), (0, 27), (1, 6), (1, 7), (1, 10), (1, 11), (1, 16), (1, 27), (2, 3), (2, 8), (2, 9), (2, 14), ]

selected_node = 0

plot_x, plot_y = 1.7786, 1

pos = netgraph.get_fruchterman_reingold_layout(
    edges=edges,
    nodes=nodes,
    origin=(0,0),
    scale=(plot_x,plot_y),
    node_size=0,
    node_positions={selected_node:(plot_x/2,plot_y/2)},
    fixed_nodes=[selected_node],
)

print(pos)

interactive graph not working when changing shape

I created a graph with networkx 2.1. Then, I used netgraph 3.1.2 to display my graph in Jupiter Notebook (using Python 3.5) as an Interactive graph, when I want to use a different shape for different nodes, the nodes aren't moving unless they are circles.

I tried both changing all nodes to different shapes, and having some circles and some different shapes. The selection (multiple nodes) functionality is no longer functional when I change shapes too. (I'm guessing it has something to do with the node creation that is being somehow altered)

_normalize_string_argument should send the dict "values" not the "keys" to the _check_types function

Hi it's me again :)
Just caught a small bug and the fix is very simple (see below).

Symptom:

When trying to supply a dict for the node_shape argument (so that different nodes can have different shapes) it currently throws an exception:

 _main.py", line 1167, in _check_types
  raise TypeError(msg)
  TypeError: Item 0 in node_shape is of the wrong type.
     Expected type: <class 'str'>
     Actual type: <class 'int'>

Cause:

The first arg that currently is sent to the _check types function is str_or_dict which then gets iterated over as "for item in items". So it it's a dict, it's the keys which get iterated over rather than the values .

Fix:

The first arg that is sent to the **_check type**s function should be str_or_dict.values() instead of the current str_or_dict (as it correctly is in _normalize_numeric_argument)

Support for joining edges with bounding boxes of text labels of nodes

netgraph doesn't support enclosing text labels in nodes and directing edges to the bounding boxes of text labels. At the current version nodes could be regular polygons or circles only. BaseGraph.draw_edges method instantiates edge_artist that supports offset that is constant:

 edge_artist  = EdgeArtist(
                ...
                offset      = node_size[target],
                ...
            )

node_size[target] is a constant value. Hovewer, while creating bounding boxes of text labels, it would be nice to have a support for rectangular nodes that encloses text labels [1]. Also, netgraph lacks support for dynamic recomputation of the offset while dragging source nodes in order to point arrows of edges to exact positions of bounding boxes of rectangles ot text labels (it should remain unique for each edge that points to the same node)[2]. Currently, it is able to point arrows only to specific offsets of each node that remains constant. I'm able to write code for both [1] and [2] and I can share it but I'm not sure if it's possible to allow each node artist to have attributes responsible for different height and width, not node_size only.

Community Layout

Hi Paul,

I'm having trouble using the plot community functionality. The graph I'm constructing is a simple stochastic block model with two uneven sized communities. For some reason, I keep getting an error that reads "The list of edges has to be non-empty", even through the graph object g has 24 nodes and a variable, but certainly non-zero number of edges. I've tried passing in the Networks graph object as an adjacency matrix, edge list, and others forms but for some reason the Graph class isn't recognizing the edges in g. Do you have any advice? I've pasted the example below. Essentially the only part of the code that I've changed from the tutorial is the generative graph model (stochastic block model).

For clarity, networkx version is 2.6.3 and netgraph version is 4.4.1

from netgraph import Graph

# create a modular graph
partition_sizes = np.asarray([4,20])
probs = np.asarray([[0.0, 0.75], [0.75, 0.0]])
g = nx.stochastic_block_model(sizes, probs, seed=0)

# create a dictionary that maps nodes to the community they belong to
node_to_community = dict()
node = 0
for community_id, size in enumerate(partition_sizes):
    for _ in range(size):
        node_to_community[node] = community_id
        node += 1

community_to_color = {
    0 : 'tab:blue',
    1 : 'tab:orange'
}
node_color = {node: community_to_color[community_id] for node, community_id in node_to_community.items()}

Graph(nx.adjacency_matrix(g).todense(),
      node_color=node_color, node_edge_width=0, edge_alpha=0.1,
      node_layout='community', node_layout_kwargs=dict(node_to_community=node_to_community),
      edge_layout='bundled', edge_layout_kwargs=dict(k=2000),
)

plt.show()

AttributeError: 'dict_values' object has no attribute 'append'

Hi, when I run the 'InteractivelyConstructDestroyGraph' example code from the README.md I get the following error when trying to add new nodes using the hotkey 'A',
AttributeError: 'dict_values' object has no attribute 'append'.
It directs to _interactive_variants.py line 489, in _add_node, self._draggable_artists.append(node_artist)
I am using version 3.1.6 of Netgraph with Python 3.7

On another note I am wondering if there is a way to draw a background image underneath the graph?

Netgraph plot disappears

When I execute a netgraph example as a Python script, the plot window appears and disappears almost instantly. However, when I execute each line of code in the Python prompt, the plot window stays.

An MWE:

import numpy as np
import matplotlib.pyplot as plt; plt.ion()
import netgraph

graph = [
(0, 1),
(1, 2),
(2, 0)
]

netgraph.draw(graph, node_labels={0: '0', 1: '1', 2: '2'})

The same problem occurs with networkx directed graphs as well.

RuntimeWarning: invalid value encountered in true_divide

I'm trying to replicate the approach for the community node layout described at https://netgraph.readthedocs.io/en/latest/sphinx_gallery_output/plot_10_community_layout.html#sphx-glr-sphinx-gallery-output-plot-10-community-layout-py

Here's my example, where my graph is undirected with no self-loops. The communities are detected using networkx louvain method:

XKCD_COLORS = {
    'cloudy blue': '#acc2d9',
    'dark pastel green': '#56ae57',
    'dust': '#b2996e',
    'electric lime': '#a8ff04',
    'fresh green': '#69d84f'}
colors=list(XKCD_COLORS.values())

import networkx as nx
import networkx.algorithms.community as nc
from netgraph import Graph
import numpy as np
from matplotlib import pyplot as plt

A=np.random.randn(8,8) # adjacency matrix: eight nodes; undirected; no self-loops
np.fill_diagonal(A, 0)
A=A+A.T
G=nx.from_numpy_matrix(A)

channels=['A','B','C','D','E','F','G','H']
Nc=len(channels)
labels_dict={i:channels[i] for i in range(Nc)}
nodes=range(Nc)

clusters=nc.louvain_communities(G) # returns communities as a list of sets, each set forming a cluster. 

node_to_community = dict() # use clusters above to create node_to_community dictionary;
for i in range(Nc):
    for j in range(len(clusters)):
        if nodes[i] in clusters[j]:
            node_to_community.update({i:j})

community_to_color = {i: colors[i] for i in range(len(clusters))}
node_color = {node: community_to_color[community_id] for node, community_id in node_to_community.items()}

Graph(G,node_color=node_color, node_labels=labels_dict,node_edge_width=0, edge_alpha=0.1, node_layout='community', node_layout_kwargs=dict(node_to_community=node_to_community),
edge_layout='bundled', edge_layout_kwargs=dict(k=2000))
plt.show()

I obtain a correct graph, but accompanying it is the following error message:

Warning (from warnings module):
  File "/Library/Frameworks/Python.framework/Versions/3.9/lib/python3.9/site-packages/netgraph/_edge_layout.py", line 761
    displacement = compatibility * delta / distance_squared[..., None]
RuntimeWarning: invalid value encountered in true_divide

there is no InteractivelyCreateDestroyGraph

Traceback (most recent call last):
  File "test.py", line 12, in <module>
    plot_instance = netgraph.InteractivelyCreateDestroyGraph(graph, draw_arrows=True, ax=ax)
AttributeError: module 'netgraph' has no attribute 'InteractivelyCreateDestroyGraph'

Interactive Variants (InteractiveHypergraph, InteractivelyConstructDestroyGraph ...) throwing 'no attribute' exceptions

I copied the code below from the README, and changed 'InteractiveGraph' with 'InteractivelyConstructDestroyGraph'.
When I try the keystrokes as indicated in the source code (e.g. "Pressing 'A' will add a node to the graph", "Pressing 'D' will remove a selected node") I get the following exceptions:

Pressing 'A' gives:

File "/usr/local/lib/python3.7/site-packages/netgraph/_interactive_variants.py", line 458, in _on_key_add_or_destroy
self._add_node(event)
File "/usr/local/lib/python3.7/site-packages/netgraph/_interactive_variants.py", line 485, in _add_node
self.draw_nodes({node:pos}, **self.kwargs)
AttributeError: 'InteractivelyConstructDestroyGraph' object has no attribute 'kwargs'

Pressing 'D' (after selecting a node) gives:

File "/usr/local/lib/python3.7/site-packages/netgraph/_interactive_variants.py", line 462, in _on_key_add_or_destroy
self._delete_nodes()
File "/usr/local/lib/python3.7/site-packages/netgraph/_interactive_variants.py", line 514, in _delete_nodes
edges = [(source, target) for (source, target) in self.edge_list if ((source in nodes) or (target in nodes))]
AttributeError: 'InteractivelyConstructDestroyGraph' object has no attribute 'edge_list'

Here's the code:

import matplotlib.pyplot as plt
import networkx as nx
from netgraph import InteractiveGraph
from netgraph._interactive_variants import InteractivelyConstructDestroyGraph

g = nx.house_x_graph()

node_data = {
4 : dict(s = 'Additional annotations can be revealed\nby clicking on the corresponding plot element.', fontsize=20, backgroundcolor='white')
}
edge_data = {
(0, 1) : dict(s='Clicking on the same plot element\na second time hides the annotation again.', fontsize=20, backgroundcolor='white')
}

fig, ax = plt.subplots(figsize=(10, 10))
plot_instance = InteractivelyConstructDestroyGraph(g, node_size=5, edge_width=3,
node_labels=True, node_label_offset=0.08, node_label_fontdict=dict(size=20),
node_data=node_data, edge_data=edge_data, ax=ax)
plt.show()

Prettier arrowheads

I propose a nicer arrowhead shape fo netgraph as follows.
How do you think about.

arrowhead

from matplotlib import pyplot as plt
from shapely.geometry.polygon import Polygon
from descartes import PolygonPatch
poly = Polygon([[-3,1], [0,9], [3,1], [0,3], [-3,1]])
fig = plt.figure()
ax = fig.add_subplot(111)
ax.set_xlim(-5, 5)
ax.set_ylim(0, 10)
ax.set_aspect(1)
ax.add_patch(PolygonPatch(poly))
plt.show()

ValueError when trying to plot

Python version: 3.10.6
netgraph version: 4.10.2

I have a network g, and I have created a pos dict using a networkx layout function. The output for the list of nodes and pos print are:
print(list(g.nodes)) gives ['0', '1', '2', '3', '4', '5', '6', '7', '8', '9']
print(pos) gives

{0: array([1.0000000e+00, 1.4702742e-08]),
 1: array([0.809017  , 0.58778526]),
 2: array([0.30901698, 0.95105655]),
 3: array([-0.30901702,  0.95105649]),
 4: array([-0.80901699,  0.58778526]),
 5: array([-9.99999988e-01, -7.27200340e-08]),
 6: array([-0.80901693, -0.58778529]),
 7: array([-0.30901711, -0.95105646]),
 8: array([ 0.30901713, -0.95105646]),
 9: array([ 0.80901694, -0.58778529])}

When I try to plot the network using netgraph, I get the following error:
Graph(g, node_layout=pos, node_edge_width=1, edge_alpha=1, edge_width=1)

ValueError: node_layout is incomplete. The following elements are missing:
-4
-2
-8
-1
-6
-3
-7
-9
-0
-5

I don't understand the problem. My pos dict has all node positions.

Edit: I found the reason when this happens. It happens when the network is taken from a gml file. i have reproduced the issue here: https://colab.research.google.com/drive/1zhe68opt4NlF4BPVc8L1GcdRVdCCbH--

AttributeError: 'DummyVertex' object has no attribute 'data'

Reproducing Example:

import networkx as nx
import matplotlib.pyplot as plt
from netgraph import Graph

G = nx.DiGraph()
G.add_nodes_from([0, 1, 2, 3, 4])
G.add_edges_from([(0, 1),
                  (1, 2),
                  (0, 2),
                  (1, 3),
                  (3, 4)])
Graph(graph=G, arrows=True, node_layout='dot', node_labels=True,
      node_label_fontdict={'size':14}, node_label_offset=0.1)
plt.show()

This results in error:
AttributeError: 'DummyVertex' object has no attribute 'data'

My package versions are:

networkx=2.6.2
netgraph=4.0.4
grandalf=0.7

Possible fix:
_node_layout.py:588

    # extract node positions
    node_positions = dict()
    for v in graph.C[0].sV:
        node_positions[v.data] = v.view.xy
    # for layer in layout.layers:
    #     for vertex in layer:
    #         node_positions[vertex.data] = vertex.view.xy

Plotting of self-loop is not supported

Fixing the previous bug about true_division in numpy here #10, it would be nice to support self-loops.

/anaconda3/lib/python3.6/site-packages/netgraph/_main.py:848: UserWarning: Plotting of self-loops not supported. Ignoring edge (X, Y).
  warnings.warn("Plotting of self-loops not supported. Ignoring edge ({}, {}).".format(source, target))

AttributeError: type object 'RegularPolygon' has no attribute 'xy' with matplotlib version 3.4.1

I just created a fresh install from this conda environment file:

name: myNewEnv
channels:
  - conda-forge
dependencies:
  - python=3.8
  - jupyterlab=3
  - ipympl
  - matplotlib
  - networkx
  - pip
  - pip:
    - netgraph

Then I wanted to just import the libraries, i.e.:

import networkx 
import netgraph
import matplotlib.pyplot as plt 
import matplotlib.image as mpimg

But here was was stopped with the following exception:

---------------------------------------------------------------------------
AttributeError                            Traceback (most recent call last)
~\Anaconda3\envs\myNewEnv\lib\site-packages\netgraph\_main.py in RegularPolygon()
    605     try: # seems deprecated for newer versions of matplotlib
--> 606         center = property(matplotlib.patches.RegularPolygon._get_xy,
    607                           matplotlib.patches.RegularPolygon._set_xy)

AttributeError: type object 'RegularPolygon' has no attribute '_get_xy'

During handling of the above exception, another exception occurred:

AttributeError                            Traceback (most recent call last)
<ipython-input-1-8690930b5b60> in <module>
      1 import networkx  
----> 2 import netgraph  
      3 import matplotlib.pyplot as plt 
      4 import matplotlib.image as mpimg 

~\Anaconda3\envs\myNewEnv\lib\site-packages\netgraph\__init__.py in <module>
     79 __email__ = "[email protected]"
     80 
---> 81 from ._main import (draw,
     82                     draw_nodes,
     83                     draw_node_labels,

~\Anaconda3\envs\myNewEnv\lib\site-packages\netgraph\_main.py in <module>
    597 
    598 
--> 599 class RegularPolygon(matplotlib.patches.RegularPolygon):
    600     """
    601     The API for matplotlib.patches.Circle and matplotlib.patches.RegularPolygon in matplotlib differ substantially.

~\Anaconda3\envs\myNewEnv\lib\site-packages\netgraph\_main.py in RegularPolygon()
    607                           matplotlib.patches.RegularPolygon._set_xy)
    608     except AttributeError:
--> 609         center = matplotlib.patches.RegularPolygon.xy
    610 
    611 

AttributeError: type object 'RegularPolygon' has no attribute 'xy'

The execution of the code import matplotlib; print(matplotlib.__version__) results in 3.4.1.

changing edge style

Hi,

using an old version of the software I generated this graph:
atc_hg

now I updated the software and I am trying to generate the same graph, but now the edge style is different:
dag

Is there a way to set the edge style in order to get the graph as in the first image?

Thanks

Fit/scale an InteractiveGraph to its matplotlib axe

First, sorry if raising an issue is not the proper way to log my question.

I have a PyQt app where I draw graphs with various number of nodes.

After determining the nodes positions (in my case using nx.shell_layout(G)), I draw an InteractiveGraph (thanks to your advice on a SO question I opened a few days ago) and it works fine.

However, I can see that the graph is not "adjusted" to the matplotlib canvas it is attached to. It seems to me that netgraph (or networkx) auto determines a "frame" depending on the number of nodes it has to display. So when you click/move the nodes, they are not "displayed" if you moved outside of this frame, which is smaller than my overall matplotlib size.

So I would like to know if there is a way to adjust this frame (or box) so that its limits fit the one of my matplotlib canvas?

PyQt integration

Hello,

We have an application with PyQt, and we would like to use netgraph to our solution.
However, we are not being able to make the graphs interactive, apparently the Qt does not bypass the click events to the plot.

Any idea how we could solve it?

Here is an example:

import sys

import matplotlib
import matplotlib.pyplot as plt

from netgraph import InteractiveGraph

from PyQt5 import QtWidgets

from matplotlib.backends.backend_qt5agg import FigureCanvasQTAgg, NavigationToolbar2QT
from matplotlib.figure import Figure

import networkx as nx

matplotlib.use('Qt5Agg')


class MplCanvas(FigureCanvasQTAgg):

    def __init__(self, parent=None, width=5, height=4, dpi=100):
        fig = Figure(figsize=(width, height), dpi=dpi)
        self.axes = fig.add_subplot(111)

        g = nx.house_x_graph()

        fig, ax = plt.subplots(figsize=(10, 10))

        plot_instance = InteractiveGraph(g)

        super(MplCanvas, self).__init__(fig)


class MainWindow(QtWidgets.QMainWindow):

    def __init__(self, *args, **kwargs):
        super(MainWindow, self).__init__(*args, **kwargs)

        sc = MplCanvas(self, width=5, height=4, dpi=100)

        toolbar = NavigationToolbar2QT(sc, self)

        layout = QtWidgets.QVBoxLayout()
        layout.addWidget(toolbar)
        layout.addWidget(sc)

        widget = QtWidgets.QWidget()
        widget.setLayout(layout)
        self.setCentralWidget(widget)

        self.show()


app = QtWidgets.QApplication(sys.argv)
w = MainWindow()
app.exec_()

Arrowheads disappear for thin arrows & arrow width is wrong?

The arrowhead scales with the width of the arrow, bu so much that it might disappear:

figure_1

And shouldn't one of the arrows from the mutually connected nodes be even wider, considering it's weight relative to the other connections?

Figure is produces with the following code:

#!/usr/bin/env python
# -*- coding: utf8 -*-

import matplotlib as mpl
mpl.use('Qt5Agg')
import matplotlib.pyplot as plt
import numpy as np
import netgraph
import networkx as nx

mat = np.array([[ 0.0       ,  0.0       ,  0.0       ,  0.0       ,  0.0       ,  0.09025436,  0.01328399],   # noqa
                [ 0.0       ,  0.0       ,  0.0       ,  0.0       ,  0.0       ,  0.0       ,  0.0       ],   # noqa
                [ 0.0       ,  0.0       ,  0.0       ,  0.0       ,  0.0       ,  0.0       ,  0.0       ],   # noqa
                [ 0.0       ,  0.0       ,  0.0       ,  0.0       ,  0.0       ,  0.0       ,  0.0       ],   # noqa
                [ 0.0       ,  0.0       ,  0.0       ,  0.0       ,  0.0       ,  0.0       ,  0.0       ],   # noqa
                [ 0.0       ,  0.0       ,  0.0       ,  0.0       ,  0.05444029,  0.0       ,  0.0       ],   # noqa
                [ 0.08      ,  0.0       ,  0.0       ,  0.0       ,  0.0       ,  0.0       ,  0.0       ]])  # noqa
mat[mat == 0.0] = np.NaN

# Create networkx graph in order to use networkx layout engines
g = nx.from_numpy_matrix(mat, create_using=nx.DiGraph())
pos = nx.drawing.layout.circular_layout(g)
node_positions = list(pos.values())

# Create figure
fig, ax = plt.subplots()
netgraph.draw_nodes(node_positions, node_size=3)
netgraph.draw_edges(mat, node_positions, node_size=3, edge_width=15*mat+0.4)

# Adjust axis limits
npArr = np.array(node_positions)
maxX, maxY = 1.3*np.max(node_positions, axis=0)
minX, minY = 1.3*np.min(node_positions, axis=0)
ax.set_ylim(minY, maxY)
ax.set_xlim(minX, maxX)


plt.show()

TypeError ufunc`true_divide` - networkx DiGraph + netgraph

Getting the following error when drawing a networkx Digraph().

networkx version: 2.0
netgraph version: 3.1.2
python 3

---------------------------------------------------------------------------
TypeError                                 Traceback (most recent call last)
<ipython-input-63-2bd83e0b2753> in <module>()
----> 1 netgraph.draw(G, draw_arrows=True)

/anaconda3/lib/python3.6/site-packages/netgraph/_main.py in draw(graph, node_positions, node_labels, edge_labels, edge_cmap, ax, **kwargs)
     77         # but if the variance in weights is large, this typically results in less
     78         # visually pleasing results.
---> 79         edge_color  = get_color(edge_weight, cmap=edge_cmap)
     80         kwargs.setdefault('edge_color',  edge_color)
     81 

/anaconda3/lib/python3.6/site-packages/netgraph/_main.py in get_color(mydict, cmap, vmin, vmax)
    313     #  - the colormap midpoint is at zero-value, and
    314     #  - negative and positive values have comparable intensity values
--> 315     values /= np.nanmax([np.nanmax(np.abs(values)), abs(vmax), abs(vmin)]) # [-1, 1]
    316     values += 1. # [0, 2]
    317     values /= 2. # [0, 1]

TypeError: ufunc 'true_divide' output (typecode 'd') could not be coerced to provided output parameter (typecode 'l') according to the casting rule ''same_kind''

Recommend Projects

  • React photo React

    A declarative, efficient, and flexible JavaScript library for building user interfaces.

  • Vue.js photo Vue.js

    ๐Ÿ–– Vue.js is a progressive, incrementally-adoptable JavaScript framework for building UI on the web.

  • Typescript photo Typescript

    TypeScript is a superset of JavaScript that compiles to clean JavaScript output.

  • TensorFlow photo TensorFlow

    An Open Source Machine Learning Framework for Everyone

  • Django photo Django

    The Web framework for perfectionists with deadlines.

  • D3 photo D3

    Bring data to life with SVG, Canvas and HTML. ๐Ÿ“Š๐Ÿ“ˆ๐ŸŽ‰

Recommend Topics

  • javascript

    JavaScript (JS) is a lightweight interpreted programming language with first-class functions.

  • web

    Some thing interesting about web. New door for the world.

  • server

    A server is a program made to process requests and deliver data to clients.

  • Machine learning

    Machine learning is a way of modeling and interpreting data that allows a piece of software to respond intelligently.

  • Game

    Some thing interesting about game, make everyone happy.

Recommend Org

  • Facebook photo Facebook

    We are working to build community through open source technology. NB: members must have two-factor auth.

  • Microsoft photo Microsoft

    Open source projects and samples from Microsoft.

  • Google photo Google

    Google โค๏ธ Open Source for everyone.

  • D3 photo D3

    Data-Driven Documents codes.