GithubHelp home page GithubHelp logo

publiclab / simple-data-grapher Goto Github PK

View Code? Open in Web Editor NEW
38.0 38.0 52.0 936 KB

Turns CSVs into graphs in a few simple steps; embeds onto other websites!

Home Page: https://publiclab.github.io/simple-data-grapher/

License: GNU General Public License v3.0

JavaScript 95.99% HTML 4.01%

simple-data-grapher's Introduction

simple-data-grapher

Code of Conduct Build Status

Turns CSVs into graphs in a few simple steps; embeds onto other websites!

Quick Setup :

Installation Instructions:

  1. Clone this repository to your local environment. git clone https://github.com/publiclab/simple-data-grapher
  2. Run npm install to install all the necessary packages required.
  3. Open examples/index.html in your browser to look at the preview of the library.

Instructions for a developer:

  1. Make the changes you are working on in respective /src files.
  2. After doing or while doing the changes run npm run build for making the changes in the dist/.
  3. Run npm run test to run the tests.
  4. Test your changes on a browser by opening examples/index.html.
  5. For finding linting issues run npm run lint

We are using babel to transpile code into es5 and browserify to require different files and watch to watch the changes and build the changes. For testing we are using mocha.

Flow: Basic Flow of the Library

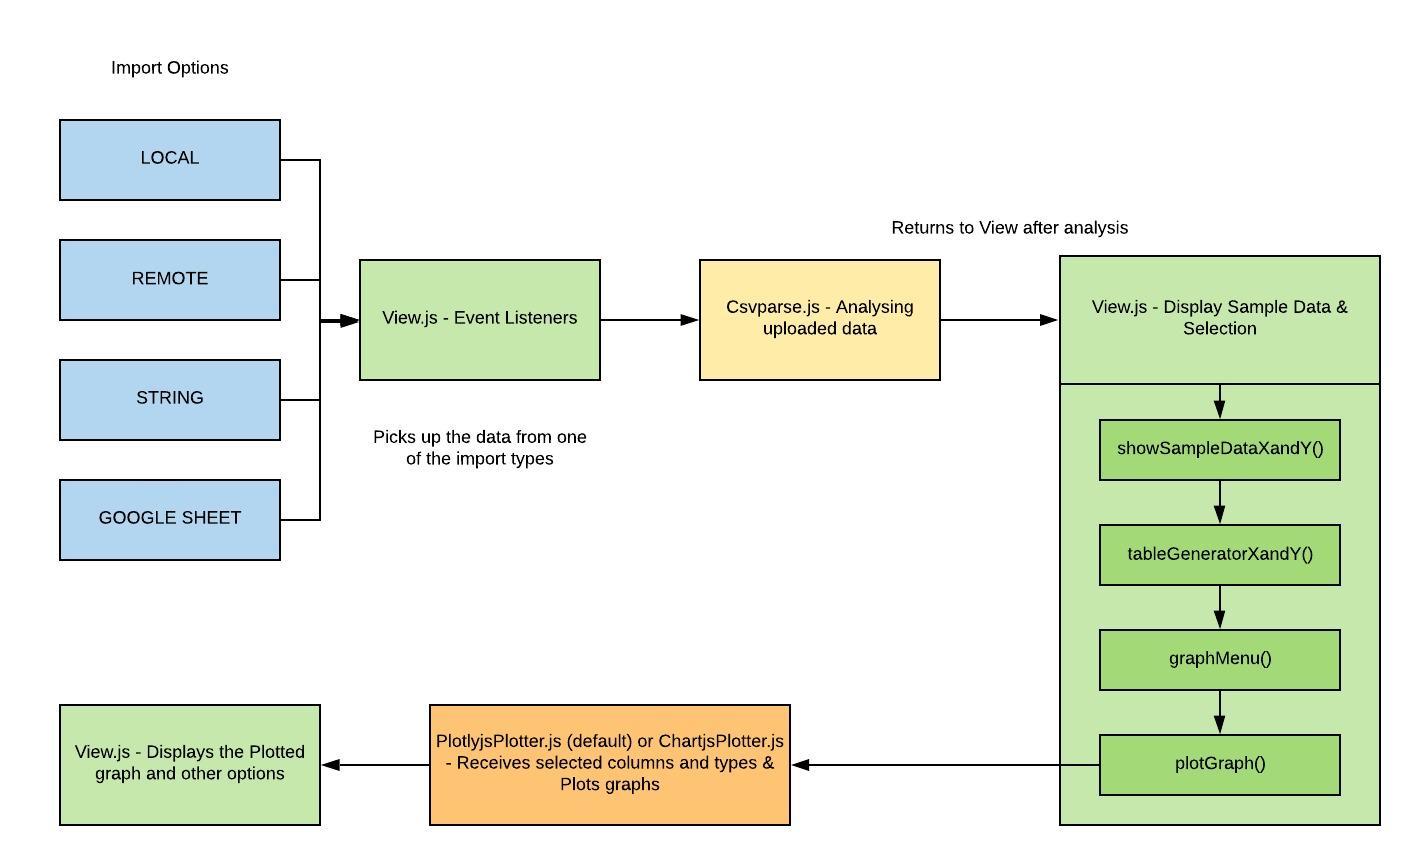
  • View.js: First reads the input files through the event listeners and sends the file to Csvparser.js, then once the required information is received, it displays a sample of the data. It then takes the selected data by the user, through the afterSampleData() method, and goes to the plotting library, and displays the graph.

  • Csvparser.js: Receives the file and it's format type and:

    • Parses the CSV
    • Determines headers
    • Determines a matrix for the complete data
    • Extracts sample data to be displayed to the user for selection
    • Creates a transpose of the data
  • PlotlyjsPlotter.js (default) or ChartjsPlotter.js: Assembles the received data according to its format and plots the graph on the canvas element.

Peripheral Features in Stand-alone

  • Add Graph: It is checked at showSampleDataXandY(), where the number of currently plotted graphs is incremented and it is sent as a flag, where the newly plotted graph has to be appended in the chart area, and not clear the canvas.

  • Create Spreadsheet: Uses the transpose created by Csvparser.js and creates a (excel or xlsx) spreadsheet using SheetJS and downloads it.

  • CODAP Export: CODAP is used here to view the CSV data in a proper tabular form. From there, the user can view a summary of their data, view a more readable form of it and use other tools that CODAP's Plugin API offers. The user can also export their data as a CSV directly to their Google Drive.

Plotlyjs v/s Chartjs

I created an adapter function which can easily switch between the two charting libraries, as one can be advantageous over the other in different situations.

  • Plotlyjs is more extensively used than Chartjs
  • Plotlyjs provides options like:
    • Zooming
    • Panning
    • Autoscaling
    • Downloading the graph as an image
    • Box and Lasso select
    • Edit graph in Plotlyjs editor
  • Chartjs:
    • Better comparison
    • Better color scheme and design
    • More informative tooltips

Flow in plots2

The basic flow remains the same as in the standalone library.

Features introduced on integration

  • Save the data: The user can save their uploaded CSV and use it later for plotting.

  • Using previously uploaded data for plotting: Users can use their previously uploaded files for plotting in simple-data-grapher.

  • Associate a file title and description with the uploaded data.

  • Per-User Data Page: Lists down all the files a user has saved, their title & description. The user can delete as well as download the files.

Publish as a Research Note

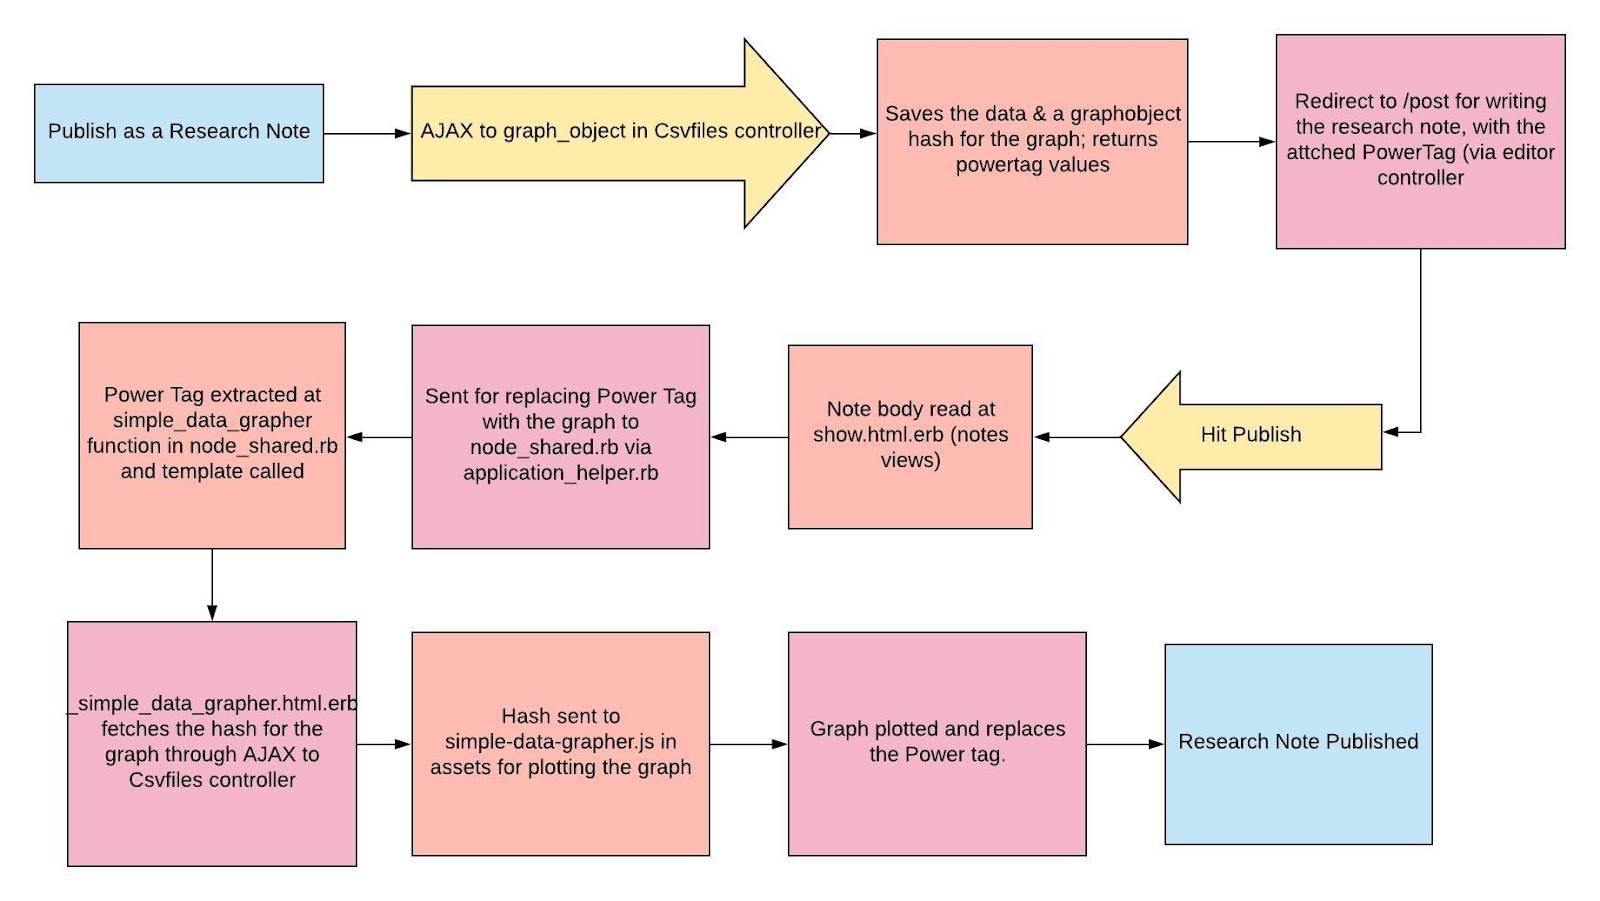
The user can publish their plotted charts as a Research Note on Public Lab and discuss their findings.

Flow

simple-data-grapher's People

Contributors

9devilal avatar chen-robert avatar chiragbhansali avatar dependabot[bot] avatar doomsdan avatar genesis331 avatar guyett92 avatar ishagupta18 avatar jywarren avatar mjkaehr avatar myungwoo-y avatar namangupta01 avatar pythongiant avatar rcya1 avatar sergeytkachenko-cj avatar uzay-g avatar vladimirmikulic avatar

Stargazers

 avatar  avatar  avatar  avatar  avatar  avatar  avatar  avatar  avatar  avatar  avatar  avatar  avatar  avatar  avatar  avatar  avatar  avatar  avatar  avatar  avatar  avatar  avatar  avatar  avatar  avatar  avatar  avatar  avatar  avatar  avatar  avatar  avatar  avatar  avatar  avatar  avatar  avatar

Watchers

 avatar  avatar  avatar  avatar  avatar  avatar  avatar  avatar  avatar  avatar  avatar  avatar  avatar  avatar  avatar  avatar  avatar  avatar  avatar  avatar  avatar

simple-data-grapher's Issues

Weekly community check-in #25 (Favourite IDE)

Hi everybody πŸ˜ƒ !

We all at Public Lab 🎈 - learn, grow, work, brainstorm ideas, contribute together so why not share about our weekly goals and the awesome work we have done at Public Lab with each other, so we can support and collaborate with each other better. We have a Community Check-In each week, where every community member can share something about their work from the past week and about their current week's goal 🎯 . You are also welcome to share fun-fact πŸ˜„ , new ideas πŸ’‘ , your learning goals β˜‘οΈ .

We believe in collaborative efforts to support our community. We are running a learning platform which helps a newcomer to become master of tomorrow. πŸ’―

If you're new here, welcome, and please comment a Hello below, we would love to work with you. If you're looking for new issues, please try some of our first-timers-only issues.

We're SO EXCITED to have your help!

Is there anything, you would like to share with us from past week's work? What is your plan for this week?

If you have not planned yet, just leave a Hello! πŸ‘‹ so that we know that you are in sync with us πŸ”ƒ and doing well!

The coming weeks will be full of code πŸ’» , tasks πŸ—’οΈ, fun πŸŽ‰ and excitement πŸ˜ƒ!!

As always, if you're waiting for a review, or if you're stuck, please request help here OR leave a comment with @publiclab/mentors @publiclab/reviewers for some input. πŸ™Œ

Gitter

Gitter is an active chatroom in our community and we'll be sending weekly reminders about check-ins there. Be sure to sign up there for these updates or just to join the conversation. You can also join us through http://publiclab.org/chat πŸ’¬.

This Week's Theme:

Share about your favourite IDE and what makes it special. Also, if you don't have anyone favourite mention the ones you like and reason.

You can find our list of previous check-ins here

Note to Summer of Code interns:

Hi, we request all the SoC students to include the below-mentioned points in their check-in comment:

  • FTOs created in the previous week
  • Progress for your project
  • Upcoming week's goals
  • PR reviewed by you in the previous week
  • Work completed last week.
  • What things you did collaboratively last week? This is really important we want team spirit.
    It is like a weekly scrum. Be flexible.
  • Feel free to tell us about your absence too, if you're taking a break.
  • Issue/PR you're struggling with (if any)

With FTOs and PR reviews, we are seeking to develop a much more friendly and collaborative platform. We want you all will involve people in your project. You all will develop skills like leadership along the way.

Thank you!

`npm start` default port

Hi, this is a first-timers-only issue. This means we've worked to make it more legible to folks who either haven't contributed to our codebase before, or even folks who haven't contributed to open source before.

If that's you, we're interested in helping you take the first step and can answer questions and help you out as you do. Note that we're especially interested in contributions from people from groups underrepresented in free and open source software!

We know that the process of creating a pull request is the biggest barrier for new contributors. This issue is for you πŸ’

If you have contributed before, consider leaving this one for someone new, and looking through our general help wanted issues. Thanks!

πŸ€” What you will need to know.

Nothing. This issue is meant to welcome you to Open Source :) We are happy to walk you through the process.

Problem

After cloning the repository and installing dependencies,

git clone https://github.com/publiclab/simple-data-grapher.git
cd simple-data-grapher
npm install

there is an error on npm start if the $PORT environmental variable is not set.

TypeError [ERR_INVALID_OPT_VALUE]: The value "{ port: true, host: '0.0.0.0' }" is invalid for option "options"

This is because the npm start script in package.json assumes that $PORT is already defined.

"start": "http-server -c-1 -p $PORT",

πŸ“‹Solution

You should find a way to set a default value for the $PORT environmental variable in package.json. This stackoverflow article may be helpful as well.

  • πŸ™‹ Claim this issue: Comment below. If someone else has claimed it, ask if they've opened a pull request already and if they're stuck -- maybe you can help them solve a problem or move it along!

  • πŸ“ Update

  • πŸ’Ύ Commit your changes

  • πŸ”€ Start a Pull Request. There are two ways how you can start a pull request:

  1. If you are familiar with the terminal or would like to learn it, here is a great tutorial on how to send a pull request using the terminal.

  2. You can also edit files directly in your browser and open a pull request from there.

  • 🏁 Done Ask in comments for a review :)

πŸ€”β“ Questions?

Leave a comment below!

Is someone else already working on this?

We encourage you to link to this issue by mentioning the issue # in your pull request, so we can see if someone's already started on it. If someone seem stuck, offer them some help! Otherwise, take a look at some other issues you can help with. Thanks!

Making the graphs more conclusive

Right now, I think the data we are plotting and the graphs being produced are well and good but its hard for the user to derive some conclusions from it.
After the merging of #29, we need to think of making the graphs more useful.

Firstly, we need to implement the time-slider, which is very important right now, since the data is huge. I am working on it, I have tried to remove a couple of bugs but I am facing some problems there and would appreciate it if people could help me out there.

Then, I think we need to show some kind of table, which can show some statistical data, like say Entry A: 500
Entry B: 200 and so on

Also, we need better legends, captions and tooltips for a better display.

We can also have a line of best fit, to show the trend in the data.
What else do you all think should be included in a graph to make it more conclusive?

@jywarren @namangupta01 @sagarpreet-chadha @SidharthBansal @gauravano @Souravirus

Change 'Create Spreadsheet' button's style

Hi, this is a first-timers-only issue. This means we've worked to make it more legible to folks who either haven't contributed to our codebase before, or even folks who haven't contributed to open source before.

If that's you, we're interested in helping you take the first step and can answer questions and help you out as you do. Note that we're especially interested in contributions from people from groups underrepresented in free and open source software!

We know that the process of creating a pull request is the biggest barrier for new contributors. This issue is for you πŸ’

If you have contributed before, consider leaving this one for someone new, and looking through our general help wanted issues. Thanks!

πŸ€” What you will need to know.

Nothing. This issue is meant to welcome you to Open Source :) We are happy to walk you through the process.

Problem

Change Create Spreadsheet button's bootstrap class and add a fa icon to it.

πŸ“‹Solution

  • πŸ™‹ Claim this issue: Comment below. If someone else has claimed it, ask if they've opened a pull request already and if they're stuck -- maybe you can help them solve a problem or move it along!

  • πŸ“ Update

In the following line:

this.element.innerHTML = '<div class="body_container"><div class="main_heading_container"><h2 class="main_heading"> Simple Data Grapher</h2><p class="sub_heading">Plot and Export Graphs with CSV data</p></div><div class="heading_container"><ul class="headings"><li class="item-1">Upload CSV Data</li><li class="item-2">Select Columns & Graph Type</li><li class="item-3">Plotted Graph & Export Options</li></ul></div><div id=' + this.carousalId + ' class="carousel ' + this.carousalClass + ' slide" data-ride="carousel"><div class="indicators"><ol class="carousel-indicators"> <li data-target="#' + this.carousalId + '" data-slide-to="0" class="active" id="up"></li> <li data-target="#' + this.carousalId + '" data-slide-to="1"></li> <li data-target="#' + this.carousalId + '" data-slide-to="2"></li></ol></div><div class="carousel-inner"><div class="carousel-item active"><div class="main_container"><div class="container_drag_drop"><span class="btn btn-outline-primary btn-file input_box"><p class="drag_drop_heading" id=' + this.dragDropHeadingId + '> <u> Choose a csv file </u> or drag & drop it here </p><input type="file" class="csv_file" id=' + this.elementId + "_csv_file" + ' accept=".csv"></span></div><h6 class="or"><span>OR</span></h6><div class="container_remote_link"><input type="text" class="remote_file text_field" placeholder="url of remote file" id=' + this.elementId + "_remote_file" + ' ></div><h6 class="or"><span>OR</span></h6><div class="container_csv_string"><textarea class="csv_string text_field" id=' + this.elementId + "_csv_string" + ' placeholder="Paste a CSV string here" ></textarea></div><h6 class="or"><span>OR</span></h6><div class="container_google_sheet"><input type="text" class="google_sheet text_field" id=' + this.elementId + "_google_sheet" + ' placeholder="Link of published Google Sheet" ></div><div class="upload_button"><button type="button" class="btn btn-primary" id=' + this.uploadButtonId + ' >Upload CSV</button></div></div></div><div class="carousel-item tables"><div class="button_container"><div><input type="checkbox" name=' + this.xyToggleName + ' checked data-toggle="toggle" class="xytoggle" data-width="150" data-onstyle="success" data-offstyle="warning" data-height="40"></div><div class="plot_button"><button type="button" class="btn btn-primary" id=' + this.plotGraphId + ' >Plot Graph</button></div></div><div class="table_container"><div id=' + this.tableXParentId + ' ><table id=' + this.tableXId + ' class="table"></table></div><div id=' + this.tableYParentId + ' class="hidden"><table id=' + this.tableYId + ' class="table"></table></div><div><table id=' + this.graphMenuId + ' class="table table-dark"></table></div></div></div><div class="carousel-item graph"><div class="feature_buttons"><button type="button" class="btn btn-primary" id=' + this.addGraphButtonId + '> Add Graph</button><button type="button" class="btn btn-primary" id=' + this.createSpreadsheetButtonId + '> Create Spreadsheet</button></div><div id=' + this.canvasContinerId + ' ></div></div></div></div></div>';

Change this:

<button type="button" class="btn btn-primary" id=' + this.createSpreadsheetButtonId + '> Create Spreadsheet</button>

TO

<button type="button" class="btn btn-success" id=' + this.createSpreadsheetButtonId + '> Create Spreadsheet <i class="fa fa-plus" aria-hidden="true"></i></button>

(This is being done to change the styling of the button)

  • πŸ’Ύ Commit your changes

  • πŸ”€ Start a Pull Request. There are two ways how you can start a pull request:

  1. If you are familiar with the terminal or would like to learn it, here is a great tutorial on how to send a pull request using the terminal.

  2. You can also edit files directly in your browser and open a pull request from there.

  • 🏁 Done Ask in comments for a review :)

πŸ€”β“ Questions?

Leave a comment below!

Is someone else already working on this?

We encourage you to link to this issue by mentioning the issue # in your pull request, so we can see if someone's already started on it. If someone seem stuck, offer them some help! Otherwise, take a look at some other issues you can help with. Thanks!

Carousel for Design

I was thinking of using a bootstrap carousel, for this design (to navigate between the 3 tabs), as it might look elegant and will be easy to maintain:

image

What are your views on this @namangupta01 @jywarren ?

Add Code of Conduct badge and build status badge in the readme

Hi, this is a first-timers-only issue. This means we've worked to make it more legible to folks who either haven't contributed to our codebase before, or even folks who haven't contributed to open source before.

If that's you, we're interested in helping you take the first step and can answer questions and help you out as you do. Note that we're especially interested in contributions from people from groups underrepresented in free and open source software!

We know that the process of creating a pull request is the biggest barrier for new contributors. This issue is for you πŸ’

If you have contributed before, consider leaving this one for someone new, and looking through our general help wanted issues. Thanks!

πŸ€” What you will need to know.

Nothing. This issue is meant to welcome you to Open Source :) We are happy to walk you through the process.

πŸ“‹ Step by Step

  • πŸ™‹ Claim this issue: Comment below. If someone else has claimed it, ask if they've opened a pull request already and if they're stuck -- maybe you can help them solve a problem or move it along!

  • πŸ“ Update

Add the code of Conduct badge and build status badge to the readme.
Just after the title in the readme, you can add these two lines.

[![Code of Conduct](https://img.shields.io/badge/code-of%20conduct-green.svg)](https://publiclab.org/conduct)
[![Build Status](https://travis-ci.com/publiclab/simple-data-grapher.svg?branch=main)](https://travis-ci.com/publiclab/simple-data-grapher)
  • πŸ’Ύ Commit your changes

  • πŸ”€ Start a Pull Request. There are two ways how you can start a pull request:

  1. If you are familiar with the terminal or would like to learn it, here is a great tutorial on how to send a pull request using the terminal.

  2. You can also edit files directly in your browser and open a pull request from there.

  • 🏁 Done Ask in comments for a review :)

Please keep us updated

πŸ’¬β° - We encourage contributors to be respectful to the community and provide an update within a week of claiming a first-timers-only issue. We're happy to keep it assigned to you as long as you need if you update us with a request for more time or help, but if we don't see any activity a week after you claim it we may reassign it to give someone else a chance. Thank you in advance!

If this happens to you, don't sweat it! Grab another open issue.

Is someone else already working on this?

πŸ”—- We encourage contributors to link to the original issue in their pull request so all users can easily see if someone's already started on it.

πŸ‘₯- If someone seems stuck, offer them some help! Otherwise, take a look at some other issues you can help with. Thanks!

πŸ€”β“ Questions?

Leave a comment below!

Update tests to pass Travis CI build

Note: We are preparing to participate in Google Code-in, and have reserved this issue for participants in GCI - but we'd love to have your help with another one! Please check out https://code.publiclab.org to see more.

What's the problem (or idea)

The Travis CI build for the project fails due to the recent updates in the UI of the project.

What should be done?

You need to update these two test cases, to help pass the CI build.

it ("should test main heading", async function(){
const headingValue = await page.$eval('.main_heading', el => el.innerHTML);
assert.equal(headingValue," Simple Data Grapher");
});
it ("should test sub heading", async function(){
const headingValue = await page.$eval('.sub_heading', el => el.innerHTML);
assert.equal(headingValue,"Plot and Export Graphs with CSV data");
});

Reference

You can check the recent failed build log here: https://travis-ci.com/publiclab/simple-data-grapher/builds/141074484

Thank You 😊

Gif should be added for showing the working of this project

Is your feature request related to a problem? Please describe.
Being a beginner whenever I try to upload a csv file I end getting a default graph sometimes in place of the desired solution . Also, I am unable to understand the flow of the process apart from that given in the README.md file.

Describe the feature/solution you'd like
A small Gif should be added for the users to understand the working of this project in our main website as well as in README.md.

Export Option for Google Sheet

I am working on a demo of the simple-data-grapher library to be hosted on heroku and also implement the Google Sheets feature there, as after struggling for few days I realized that we need a server to make that work, as credentials can't be set in the browser itself.
Here's a link which explains it better googleapis/google-api-nodejs-client#1620.
So once the demo is up and running, we can probably create a similar kind on an actual server.
@jywarren @namangupta01 @gauravano what do you think?

Add test case for the footer

Note: We are preparing to participate in Google Code-in, and have reserved this issue for participants in GCI - but we'd love to have your help with another one! Please check out https://code.publiclab.org to see more.

What's the idea (or problem)

There have been recent updates in the UI of the project. We have our footer added recently. So it will be good to add a UI test for that.

What should be done?

You need to add test cases for the footer in this file. It includes all the UI test cases.

https://github.com/publiclab/simple-data-grapher/blob/main/spec/js/ui_tests.js

Thank You 😊

Remove console.log statements

Hi, this is a first-timers-only issue. This means we've worked to make it more legible to folks who either haven't contributed to our codebase before, or even folks who haven't contributed to open source before.

If that's you, we're interested in helping you take the first step and can answer questions and help you out as you do. Note that we're especially interested in contributions from people from groups underrepresented in free and open source software!

We know that the process of creating a pull request is the biggest barrier for new contributors. This issue is for you πŸ’

If you have contributed before, consider leaving this one for someone new, and looking through our general help wanted issues. Thanks!

πŸ€” What you will need to know.

Nothing. This issue is meant to welcome you to Open Source :) We are happy to walk you through the process.

Problem

Excess console.log statements in src files.

πŸ“‹Solution

  • πŸ™‹ Claim this issue: Comment below. If someone else has claimed it, ask if they've opened a pull request already and if they're stuck -- maybe you can help them solve a problem or move it along!

  • πŸ“ Update

Remove the console.log statements in the files below!

console.log(this);

console.log(temp,"omg");

console.log(document.getElementById(xx));

console.log(this,"this");

console.log(this.csvParser.completeCsvMatrix);

  • πŸ’Ύ Commit your changes

  • πŸ”€ Start a Pull Request. There are two ways how you can start a pull request:

  1. If you are familiar with the terminal or would like to learn it, here is a great tutorial on how to send a pull request using the terminal.

  2. You can also edit files directly in your browser and open a pull request from there.

  • 🏁 Done Ask in comments for a review :)

πŸ€”β“ Questions?

Leave a comment below!

Is someone else already working on this?

We encourage you to link to this issue by mentioning the issue # in your pull request, so we can see if someone's already started on it. If someone seem stuck, offer them some help! Otherwise, take a look at some other issues you can help with. Thanks!

Removing unused code

Hi, this is a first-timers-only issue. This means we've worked to make it more legible to folks who either haven't contributed to our codebase before, or even folks who haven't contributed to open source before.

If that's you, we're interested in helping you take the first step and can answer questions and help you out as you do. Note that we're especially interested in contributions from people from groups underrepresented in free and open source software!

We know that the process of creating a pull request is the biggest barrier for new contributors. This issue is for you πŸ’

If you have contributed before, consider leaving this one for someone new, and looking through our general help wanted issues. Thanks!

πŸ€” What you will need to know.

Nothing. This issue is meant to welcome you to Open Source :) We are happy to walk you through the process.

Problem

Some of the code which was previously written is not required anymore.

πŸ“‹Solution

Remove
<button type="button" class="btn btn-success" id=' + this.gsheetId + '> Export as Google </button><div class="g-signin2" data-onsuccess=' + this.onSignIn + '></div> at line

this.element.innerHTML = '<div class="body_container"><div class="main_heading_container"><h2 class="main_heading"> Simple Data Grapher</h2><p class="sub_heading">Plot and Export Graphs with CSV data</p></div><div class="heading_container"><ul class="headings"><li class="item-1">Upload CSV Data</li><li class="item-2">Select Columns & Graph Type</li><li class="item-3">Plotted Graph & Export Options</li></ul></div><div id=' + this.carousalId + ' class="carousel ' + this.carousalClass + ' slide" data-ride="carousel"><div class="indicators"><ol class="carousel-indicators"> <li data-target="#' + this.carousalId + '" data-slide-to="0" class="active" id="up"></li> <li data-target="#' + this.carousalId + '" data-slide-to="1"></li> <li data-target="#' + this.carousalId + '" data-slide-to="2"></li></ol></div><div class="carousel-inner"><div class="carousel-item active"><div class="main_container"><div class="container_drag_drop"><span class="btn btn-outline-primary btn-file input_box"><p class="drag_drop_heading" id=' + this.dragDropHeadingId + '> <u> Choose a csv file </u> or drag & drop it here </p><input type="file" class="csv_file" id=' + this.elementId + "_csv_file" + ' accept=".csv"></span></div><h6 class="or"><span>OR</span></h6><div class="container_remote_link"><input type="text" class="remote_file text_field" placeholder="url of remote file" id=' + this.elementId + "_remote_file" + ' ></div><h6 class="or"><span>OR</span></h6><div class="container_csv_string"><textarea class="csv_string text_field" id=' + this.elementId + "_csv_string" + ' placeholder="Paste a CSV string here" ></textarea></div><h6 class="or"><span>OR</span></h6><div class="container_google_sheet"><input type="text" class="google_sheet text_field" id=' + this.elementId + "_google_sheet" + ' placeholder="Link of published Google Sheet" ></div><div class="upload_button"><button type="button" class="btn btn-primary" id=' + this.uploadButtonId + ' >Upload CSV</button></div></div></div><div class="carousel-item tables"><div class="button_container"><div><input type="checkbox" name=' + this.xyToggleName + ' checked data-toggle="toggle" class="xytoggle" data-width="150" data-onstyle="success" data-offstyle="warning" data-height="40"></div><div class="plot_button"><button type="button" class="btn btn-primary" id=' + this.plotGraphId + ' >Plot Graph</button></div></div><div class="table_container"><div id=' + this.tableXParentId + ' ><table id=' + this.tableXId + ' class="table"></table></div><div id=' + this.tableYParentId + ' class="hidden"><table id=' + this.tableYId + ' class="table"></table></div><div><table id=' + this.graphMenuId + ' class="table table-dark"></table></div></div></div><div class="carousel-item graph"><div class="feature_buttons"><button type="button" class="btn btn-primary" id=' + this.addGraphButtonId + '> Add Graph</button><button type="button" class="btn btn-success" id=' + this.createSpreadsheetButtonId + '> Create Spreadsheet<i class="fa fa-plus" aria-hidden="true"></i></button><button type="button" class="btn btn-success" id=' + this.gsheetId + '> Export as Google </button><div class="g-signin2" data-onsuccess=' + this.onSignIn + '></div></div><div id=' + this.canvasContinerId + ' ></div></div></div></div></div>';

and

exportSheet(){
console.log("clicked");
}

in https://github.com/publiclab/simple-data-grapher/blob/main/src/View.js

  • πŸ™‹ Claim this issue: Comment below. If someone else has claimed it, ask if they've opened a pull request already and if they're stuck -- maybe you can help them solve a problem or move it along!

  • πŸ“ Update

  • πŸ’Ύ Commit your changes

  • πŸ”€ Start a Pull Request. There are two ways how you can start a pull request:

  1. If you are familiar with the terminal or would like to learn it, here is a great tutorial on how to send a pull request using the terminal.

  2. You can also edit files directly in your browser and open a pull request from there.

  • 🏁 Done Ask in comments for a review :)

πŸ€”β“ Questions?

Leave a comment below!

Is someone else already working on this?

We encourage you to link to this issue by mentioning the issue # in your pull request, so we can see if someone's already started on it. If someone seem stuck, offer them some help! Otherwise, take a look at some other issues you can help with. Thanks!

Adding CORS Proxy for remote files

When the user adds a link to a remote CSV file, we were getting CORS
Access to XMLHttpRequest at 'file url' from origin 'null' has been blocked by CORS policy: Request header field range is not allowed by Access-Control-Allow-Headers in preflight response.

To resolve this, I have used a CORS proxy

function receive(data){ console.log(data,"data"); } function func(){ var data=[] const proxyurl = "https://cors-anywhere.herokuapp.com/"; const url = "http://insight.dev.schoolwires.com/HelpAssets/C2Assets/C2Files/C2ImportCalEventSample.csv"; fetch(proxyurl + url) .then(response => response.text()) .then(contents => receive(contents)) .catch(() => console.log("Can’t access " + url + " response. Blocked by browser?")) }

This seems to work fine. What do you think, @jywarren ?

Setup Travis CI in the project

Please Note: We are preparing to participate in Google Code-in, and have reserved this issue for participants in GCI - but we'd love to have your help with another one! Please check out https://code.publiclab.org to see more

What's the feature request? Please describe.

Travis CI makes developing software efficient and it ensures we deploy clean code that follows good practice and also detects if there are possible bugs or deficits in our code caused by a change or refactor in our project.

Describe the solution you'd like

So we should set up Travis CI in this project by creating a file .travis.yml in the root directory with proper configuration.

Additional context

This service simply means to automate the process by running test cases each time a new commit is pushed.

Thank You 😊

Refactor html to follow standard structure

Note:- We are preparing to participate in Google Code-in, and have reserved this issue for participants in GCI - but we'd love to have your help with another one! Please check out https://code.publiclab.org to see more.

What's the problem (or idea)

The HTML code we have in our project doesn't follow the standard structure. Now, we have two HTML files -

  1. https://github.com/publiclab/simple-data-grapher/blob/main/index.html
  2. https://github.com/publiclab/simple-data-grapher/blob/main/examples/index.html

What should be done?

You need to refactor it to follow the standard basic structure with all the tags like html head title body etc.

Thank You 😊

Add build, watch script to the Project

With the introducing of new project structure, we want to use the various dependencies present in the project package.json file. For that we will use require but for using it we need something that bundles up all the required libraries or modules. For that, we should have any kind of task runner for compiling node_modules. What do you say @jywarren and @IshaGupta18 ? Should we go for grunt or something else?

Remove unnecessary console.log statements

Please Note: We are preparing to participate in Google Code-in, and have reserved this issue for participants in GCI - but we'd love to have your help with another one! Please check out https://code.publiclab.org to see more

Problem
There are a lot of unnecessary console.log statements defined inside all the javascript functions
in src folder.

Expected behavior

We should remove all of those console statements

Link to file

You can find all the files https://github.com/publiclab/simple-data-grapher/tree/main/src

Add a proper header/navbar in the main page

Note:- We are preparing to participate in Google Code-in, and have reserved this issue for participants in GCI - but we'd love to have your help with another one! Please check out https://code.publiclab.org to see more.

Describe the idea or (feature)

We need to add a proper header/navbar to the main page and provide some general information in it like the GitHub repo link and a bit about the application.

Reference

Take reference from this: https://beta.sequencer.publiclab.org/

Thank You 😊

Save file option for Create Spreadsheet Button

Is your feature request related to a problem? Please describe.
Whenever we try to do Create Spreadsheet+, it usually downloads a file with a default name, what if the user wants to save the file with some username in his/her desired location.

Describe the feature/solution you'd like
On clicking Create Spreadsheet+ button a file dialog for the user should be opened to choose where he/she can save the file.

Typo error in contributing.md

Hi, this is a first-timers-only issue. This means we've worked to make it more legible to folks who either haven't contributed to our codebase before, or even folks who haven't contributed to open source before.

If that's you, we're interested in helping you take the first step and can answer questions and help you out as you do. Note that we're especially interested in contributions from people from groups underrepresented in free and open source software!

We know that the process of creating a pull request is the biggest barrier for new contributors. This issue is for you πŸ’

If you have contributed before, consider leaving this one for someone new, and looking through our general help wanted issues. Thanks!

πŸ€” What you will need to know.

Nothing. This issue is meant to welcome you to Open Source :) We are happy to walk you through the process.

Problem

There is a typo error in contributing.md.

πŸ“‹Solution

  • πŸ™‹ Claim this issue: Comment below. If someone else has claimed it, ask if they've opened a pull request already and if they're stuck -- maybe you can help them solve a problem or move it along!

  • πŸ“ Update

The first line in contributing.md says To install PLOTS2 locally, follow the instructions in the....

Change PLOTS2 -> SIMPLE-DATA-GRAPHER

  • πŸ’Ύ Commit your changes

  • πŸ”€ Start a Pull Request. There are two ways how you can start a pull request:

  1. If you are familiar with the terminal or would like to learn it, here is a great tutorial on how to send a pull request using the terminal.

  2. You can also edit files directly in your browser and open a pull request from there.

  • 🏁 Done Ask in comments for a review :)

πŸ€”β“ Questions?

Leave a comment below!

Is someone else already working on this?

We encourage you to link to this issue by mentioning the issue # in your pull request, so we can see if someone's already started on it. If someone seem stuck, offer them some help! Otherwise, take a look at some other issues you can help with. Thanks!

Add a footer to the page

Note:- We are preparing to participate in Google Code-in, and have reserved this issue for participants in GCI - but we'd love to have your help with another one! Please check out https://code.publiclab.org to see more.

Describe the idea or (feature)

We need to add a footer to the main page and provide some general information on it.

Reference

We can take a reference from this: https://beta.sequencer.publiclab.org/

reference
Thank You 😊

Add config.yml for welcoming new users

Note: We are preparing to participate in Google Code-in, and have reserved this issue for participants in GCI - but we'd love to have your help with another one! Please check out https://code.publiclab.org to see more.

Hi, this is a first-timers-only issue. This means we've worked to make it more legible to folks who either haven't contributed to our codebase before, or even folks who haven't contributed to open source before.

If that's you, we're interested in helping you take the first step and can answer questions and help you out as you do. Note that we're especially interested in contributions from people from groups underrepresented in free and open source software!

We know that the process of creating a pull request is the biggest barrier for new contributors. This issue is for you πŸ’

If you have contributed before, consider leaving this one for someone new, and looking through our general help wanted issues. Thanks!

πŸ€” What you will need to know.

Nothing. This issue is meant to welcome you to Open Source :) We are happy to walk you through the process.

Problem

We want to add the https://github.com/behaviorbot/welcome for our repository to welcome new contributors for New Issue Welcome , New PR Welcome , First PR Merge

πŸ“‹Solution

  • πŸ™‹ Claim this issue: Comment below. If someone else has claimed it, ask if they've opened a pull request already and if they're stuck -- maybe you can help them solve a problem or move it along!

  • πŸ“ Update

Add the config.yml file inside .github of the home directory with content as per config.yml present in plots2 repo https://github.com/publiclab/plots2/blob/master/.github/config.yml

Don't forget to replace all occurrences of plots2 with simple-data-grapher

  • πŸ’Ύ Commit your changes

  • πŸ”€ Start a Pull Request. There are two ways how you can start a pull request:

  1. If you are familiar with the terminal or would like to learn it, here is a great tutorial on how to send a pull request using the terminal.

  2. You can also edit files directly in your browser and open a pull request from there.

  • 🏁 Done Ask in comments for a review :)

πŸ€”β“ Questions?

Leave a comment below!

Is someone else already working on this?

We encourage you to link to this issue by mentioning the issue # in your pull request, so we can see if someone's already started on it. If someone seem stuck, offer them some help! Otherwise, take a look at some other issues you can help with. Thanks!

Publish Graphs as a Research Note

Is your feature request related to a problem? Please describe.
Once we complete the integration with plots2, one of the features for Public Lab users could be to publish the created graphs as a Research Note.

Propose ideas to implement this feature
This is how I thought of doing it while I was writing my proposal.
image

However, I am not sure how to go about it exactly.

Do we store the graphs as images and render them in notes or how would we implement the partial thing exactly.

Additional context

I would love it if anyone could suggest a flow of things here. On how should we go about it.

@jywarren @namangupta01 @rexagod @gauravano @sagarpreet-chadha @IgorWilbert

updated README for new contributors

I just came across this repo, (scrolling github XD)
Kind of clueless.
It would be nice to have a few things explained in the readme file.
Some parts of the proposal, maybe?

Remove unused variable

Hi, this is a first-timers-only issue. This means we've worked to make it more legible to folks who either haven't contributed to our codebase before, or even folks who haven't contributed to open source before.

If that's you, we're interested in helping you take the first step and can answer questions and help you out as you do. Note that we're especially interested in contributions from people from groups underrepresented in free and open source software!

We know that the process of creating a pull request is the biggest barrier for new contributors. This issue is for you πŸ’

If you have contributed before, consider leaving this one for someone new, and looking through our general help wanted issues. Thanks!

πŸ€” What you will need to know.

Nothing. This issue is meant to welcome you to Open Source :) We are happy to walk you through the process.

Problem

There is one unused variable f in the parse() method.

πŸ“‹Solution

Delete the variable

var f=this.parseReturn;

  • πŸ™‹ Claim this issue: Comment below. If someone else has claimed it, ask if they've opened a pull request already and if they're stuck -- maybe you can help them solve a problem or move it along!

  • πŸ“ Update

  • πŸ’Ύ Commit your changes

  • πŸ”€ Start a Pull Request. There are two ways how you can start a pull request:

  1. If you are familiar with the terminal or would like to learn it, here is a great tutorial on how to send a pull request using the terminal.

  2. You can also edit files directly in your browser and open a pull request from there.

  • 🏁 Done Ask in comments for a review :)

πŸ€”β“ Questions?

Leave a comment below!

Is someone else already working on this?

We encourage you to link to this issue by mentioning the issue # in your pull request, so we can see if someone's already started on it. If someone seem stuck, offer them some help! Otherwise, take a look at some other issues you can help with. Thanks!

Redesign Add Graph Button

Hi, this is a first-timers-only issue. This means we've worked to make it more legible to folks who either haven't contributed to our codebase before, or even folks who haven't contributed to open source before.

If that's you, we're interested in helping you take the first step and can answer questions and help you out as you do. Note that we're especially interested in contributions from people from groups underrepresented in free and open source software!

We know that the process of creating a pull request is the biggest barrier for new contributors. This issue is for you πŸ’

If you have contributed before, consider leaving this one for someone new, and looking through our general help wanted issues. Thanks!

πŸ€” What you will need to know.

Nothing. This issue is meant to welcome you to Open Source :) We are happy to walk you through the process.

Problem

The current Add Graph button is a simple bootstrap primary button.
image

πŸ“‹Solution

<button type="button" class="btn btn-primary" id=' + this.addGraphButtonId + '> Add Graph</button>

Change the above line in

this.element.innerHTML = '<div class="body_container"><div class="main_heading_container"><h2 class="main_heading"> Simple Data Grapher</h2><p class="sub_heading">Plot and Export Graphs with CSV data</p></div><div class="heading_container"><ul class="headings"><li class="item-1">Upload CSV Data</li><li class="item-2">Select Columns & Graph Type</li><li class="item-3">Plotted Graph & Export Options</li></ul></div><div id=' + this.carousalId + ' class="carousel ' + this.carousalClass + ' slide" data-ride="carousel"><div class="indicators"><ol class="carousel-indicators"> <li data-target="#' + this.carousalId + '" data-slide-to="0" class="active" id="up"></li> <li data-target="#' + this.carousalId + '" data-slide-to="1"></li> <li data-target="#' + this.carousalId + '" data-slide-to="2"></li></ol></div><div class="carousel-inner"><div class="carousel-item active"><div class="main_container"><div class="container_drag_drop"><span class="btn btn-outline-primary btn-file input_box"><p class="drag_drop_heading" id=' + this.dragDropHeadingId + '> <u> Choose a csv file </u> or drag & drop it here </p><input type="file" class="csv_file" id=' + this.elementId + "_csv_file" + ' accept=".csv"></span></div><h6 class="or"><span>OR</span></h6><div class="container_remote_link"><input type="text" class="remote_file text_field" placeholder="url of remote file" id=' + this.elementId + "_remote_file" + ' ></div><h6 class="or"><span>OR</span></h6><div class="container_csv_string"><textarea class="csv_string text_field" id=' + this.elementId + "_csv_string" + ' placeholder="Paste a CSV string here" ></textarea></div><h6 class="or"><span>OR</span></h6><div class="container_google_sheet"><input type="text" class="google_sheet text_field" id=' + this.elementId + "_google_sheet" + ' placeholder="Link of published Google Sheet" ></div><div class="upload_button"><button type="button" class="btn btn-primary" id=' + this.uploadButtonId + ' >Upload CSV</button></div></div></div><div class="carousel-item tables"><div class="button_container"><div><input type="checkbox" name=' + this.xyToggleName + ' checked data-toggle="toggle" class="xytoggle" data-width="150" data-onstyle="success" data-offstyle="warning" data-height="40"></div><div class="plot_button"><button type="button" class="btn btn-primary" id=' + this.plotGraphId + ' >Plot Graph</button></div></div><div class="table_container"><div id=' + this.tableXParentId + ' ><table id=' + this.tableXId + ' class="table"></table></div><div id=' + this.tableYParentId + ' class="hidden"><table id=' + this.tableYId + ' class="table"></table></div><div><table id=' + this.graphMenuId + ' class="table table-dark"></table></div></div></div><div class="carousel-item graph"><div class="feature_buttons"><button type="button" class="btn btn-primary" id=' + this.addGraphButtonId + '> Add Graph</button><button type="button" class="btn btn-success" id=' + this.createSpreadsheetButtonId + '> Create Spreadsheet<i class="fa fa-plus" aria-hidden="true"></i></button><button type="button" class="btn btn-success" id=' + this.gsheetId + '> Export as Google </button><div class="g-signin2" data-onsuccess=' + this.onSignIn + '></div></div><div id=' + this.canvasContinerId + ' ></div></div></div></div></div>';

By adding some styling, probably a fa fa-icon or some other color!

  • πŸ™‹ Claim this issue: Comment below. If someone else has claimed it, ask if they've opened a pull request already and if they're stuck -- maybe you can help them solve a problem or move it along!

  • πŸ“ Update

  • πŸ’Ύ Commit your changes

  • πŸ”€ Start a Pull Request. There are two ways how you can start a pull request:

  1. If you are familiar with the terminal or would like to learn it, here is a great tutorial on how to send a pull request using the terminal.

  2. You can also edit files directly in your browser and open a pull request from there.

  • 🏁 Done Ask in comments for a review :)

πŸ€”β“ Questions?

Leave a comment below!

Is someone else already working on this?

We encourage you to link to this issue by mentioning the issue # in your pull request, so we can see if someone's already started on it. If someone seem stuck, offer them some help! Otherwise, take a look at some other issues you can help with. Thanks!

Dividing work for Summer Of Code

Hi @IshaGupta18, I think it would be better if we divide our work here and make a checklist so that we have a list of all the work to be done and also know who is working on which part? And also it will keep track of our work.
What do you say? and @jywarren also?

Update Graph feature

Describe the feature/solution you'd like
I was thinking of implementing an "Update Graph" feature. We had this feature before the "Add Graph" feature was introduced, but now since we have multiple graphs, we have to write this feature again. But it would be a little tough since we'll have to save every graph's configuration even after it is plotted, which will be a heavy burden. The add graph feature might be substantial since the user can simply add another graph instead of updating the current one. But either ways, updating the graph is a good functionality to have. Also, we should have a delete graph feature as well. What is your take on both these? @jywarren @Souravirus @IgorWilbert @gauravano @namangupta01

Describe alternatives you've considered
Add Graph is an alternate for this.

Propose ideas to implement this feature
We will have to maintain a hash, with the graph id as key and it's configuration as it's value. Every time the user will click on "update graph" for a graph, we will reset the sample data tables and graph type table to the graph's configuration.

Add space in the button for clarity

Hi, this is a first-timers-only issue. This means we've worked to make it more legible to folks who either haven't contributed to our codebase before, or even folks who haven't contributed to open source before.

If that's you, we're interested in helping you take the first step and can answer questions and help you out as you do. Note that we're especially interested in contributions from people from groups underrepresented in free and open source software!

We know that the process of creating a pull request is the biggest barrier for new contributors. This issue is for you πŸ’

If you have contributed before, consider leaving this one for someone new, and looking through our general help wanted issues. Thanks!

πŸ€” What you will need to know.

Nothing. This issue is meant to welcome you to Open Source :) We are happy to walk you through the process.

Problem

πŸ“‹Solution

  • πŸ™‹ Claim this issue: Comment below. If someone else has claimed it, ask if they've opened a pull request already and if they're stuck -- maybe you can help them solve a problem or move it along!

  • πŸ“ Update
    Add space after Create Spreadsheet in this line below

    this.element.innerHTML = '<div class="body_container"> <div class="main_heading_container"> <h2 class="main_heading"> Simple Data Grapher</h2> <p class="sub_heading">Plot and Export Graphs with CSV data</p> </div><div class="heading_container"> <ul class="headings"> <li class="item-1">Upload CSV Data</li> <li class="item-2">Select Columns & Graph Type</li> <li class="item-3">Plotted Graph & Export Options</li> </ul> </div> <div id=' + this.carousalId + ' class="carousel ' + this.carousalClass + ' slide" data-ride="carousel" data-interval="false"> <div class="indicators"> <ol class="carousel-indicators"> <li data-target="#' + this.carousalId + '" data-slide-to="0" class="active" id="up" class="first_indicator"></li> <li data-target="#' + this.carousalId + '" data-slide-to="1" class="second_indicator"></li> <li data-target="#' + this.carousalId + '" data-slide-to="2" class="third_indicator"></li> </ol> </div> <div class="carousel-inner"> <div class="carousel-item active"> <div class="parent_main_container"> <div><p id="import_description"> text_for_replacement</p></div> <div class="main_container"> <div class="main_grid_container"> <div class="container_drag_drop grid-item imports"> <p class="sub_heading_import"> Local File </p> <span class="btn btn-outline-primary btn-file input_box shadow"> <p class="drag_drop_heading" id=' + this.dragDropHeadingId + '><u> Choose a csv file </u> or drag & drop it here </p> <input type="file" class="csv_file" id=' + this.fileUploadId + ' accept=".csv"> </span> <button type="button" class="btn btn-dark des" id=' + "popover" + this.fileUploadId + '> <i class="fa fa-list"></i> </button> </div> <div class="container_remote_link grid-item imports"> <p class="sub_heading_import"> Remote File </p> <input type="text" class="remote_file text_field shadow" placeholder="url of remote file" id=' + this.remoteFileUploadId + ' > <button type="button" class="btn btn-dark des" id=' + "popover" + this.remoteFileUploadId + '><i class="fa fa-list"></i></button> </div> <div class="container_csv_string grid-item imports"> <p class="sub_heading_import"> String File </p> <textarea class="csv_string text_field shadow" id=' + this.csvStringUploadId + ' placeholder="Paste a CSV string here" ></textarea> <button type="button" class="btn btn-dark des" id=' + "popover" + this.csvStringUploadId + '><i class="fa fa-list"></i></button> </div> <div class="container_google_sheet grid-item imports"> <p class="sub_heading_import"> Google Sheet </p> <div class="google_sheet_container"> <input type="text" class="google_sheet text_field shadow" id=' + this.googleSheetUploadId + ' placeholder="Link of published Google Sheet" > <button type="button" class="btn btn-dark des" id=' + "popover" + this.googleSheetUploadId + '><i class="fa fa-list"></i></button> </div> </div> </div> <div id=' + this.upload_button_container + ' class="upload_button"> <button type="button" class="btn btn-primary uploadButton" id=' + this.uploadButtonId + ' >Upload CSV</button> </div> </div> <div style="visibility: hidden;"><p> heyyyyy</p></div> </div> </div> <div class="carousel-item tables"> <div class="button_container"> <div> <input type="checkbox" name=' + this.xyToggleName + ' checked data-toggle="toggle" class="xytoggle" id="xy" data-width="150" data-onstyle="success" data-offstyle="warning" data-height="40"> </div> <div class="plot_button"> <button type="button" class="btn btn-primary plotGraph" id=' + this.plotGraphId + ' >Plot Graph</button> </div> </div> <div class="table_container"> <div id=' + this.tableXParentId + ' > <table id=' + this.tableXId + ' class="table"></table> </div> <div id=' + this.tableYParentId + ' class="hidden"> <table id=' + this.tableYId + ' class="table"></table> </div><div id="menu_holder"></div></div> </div> <div class="carousel-item graph"> <div id=' + this.feature_button_container + ' class="feature_buttons"> <button type="button" class="btn btn-primary addGraph" id=' + this.addGraphButtonId + '> Add Graph</button> <button type="button" class="btn btn-success createSpreadsheet" id=' + this.createSpreadsheetButtonId + '> Create Spreadsheet<i class="fa fa-plus" aria-hidden="true"></i></button> <button type="button" class="btn btn-info codapExport" id=' + this.codapExportButton + ' data-toggle="modal" data-target="#exampleModalCenter">View and Export to CODAP</button> </div> <div class="parent_canvas_container"><div id=' + this.canvasContinerId + ' ></div></div> </div> </div> </div></div><div class="modal fade" id="exampleModalCenter" tabindex="-1" role="dialog" aria-labelledby="exampleModalCenterTitle" aria-hidden="true"> <div class="modal-dialog modal-lg modal-dialog-centered" id="modal-style" role="document"> <div class="modal-content"> <div class="modal-header"> <h5 class="modal-title" id="exampleModalLongTitle">CODAP</h5> <button type="button" class="close" data-dismiss="modal" aria-label="Close"> <span aria-hidden="true">&times;</span> </button> </div> <div class="modal-body" id="body_for_CODAP"></div> </div> </div></div>';

  • πŸ’Ύ Commit your changes

  • πŸ”€ Start a Pull Request. There are two ways how you can start a pull request:

  1. If you are familiar with the terminal or would like to learn it, here is a great tutorial on how to send a pull request using the terminal.

  2. You can also edit files directly in your browser and open a pull request from there.

  • 🏁 Done Ask in comments for a review :)

πŸ€”β“ Questions?

Leave a comment below!

Is someone else already working on this?

We encourage you to link to this issue by mentioning the issue # in your pull request, so we can see if someone's already started on it. If someone seem stuck, offer them some help! Otherwise, take a look at some other issues you can help with. Thanks!

Resolve linting errors

Hi, this is a first-timers-only issue. This means we've worked to make it more legible to folks who either haven't contributed to our codebase before, or even folks who haven't contributed to open source before.

If that's you, we're interested in helping you take the first step and can answer questions and help you out as you do. Note that we're especially interested in contributions from people from groups underrepresented in free and open source software!

We know that the process of creating a pull request is the biggest barrier for new contributors. This issue is for you πŸ’

If you have contributed before, consider leaving this one for someone new, and looking through our general help wanted issues. Thanks!

πŸ€” What you will need to know.

Nothing. This issue is meant to welcome you to Open Source :) We are happy to walk you through the process.

Problem

πŸ“‹Solution

  • πŸ™‹ Claim this issue: Comment below. If someone else has claimed it, ask if they've opened a pull request already and if they're stuck -- maybe you can help them solve a problem or move it along!

  • πŸ“ Update

// install ESLint
$ npm i -g eslint

// navigate and run linter
$ cd simple-data-grapher && eslint --fix .

// format code to fix linting errors

After the errors are fixed, proceed as specified below.

  • πŸ’Ύ Commit your changes

  • πŸ”€ Start a Pull Request. There are two ways how you can start a pull request:

  1. If you are familiar with the terminal or would like to learn it, here is a great tutorial on how to send a pull request using the terminal.

  2. You can also edit files directly in your browser and open a pull request from there.

  • 🏁 Done Ask in comments for a review :)

πŸ€”β“ Questions?

Leave a comment below!

Is someone else already working on this?

We encourage you to link to this issue by mentioning the issue # in your pull request, so we can see if someone's already started on it. If someone seem stuck, offer them some help! Otherwise, take a look at some other issues you can help with. Thanks!

Testing Suites

Currently, we are working with Mocha in our tests in this repo. However, I think we should chime in a couple of thoughts here regarding this.
We should do a comparison between Mocha, Jasmine, and Jest, the first 2 being used in different PL's repos, as far as I know.
https://medium.com/welldone-software/an-overview-of-javascript-testing-in-2019-264e19514d0a
https://stackshare.io/stackups/jasmine-vs-jest-vs-mocha
The above are a couple of posts which discuss the three.
Here are a couple of resources from @jywarren https://marcofranssen.nl/jasmine-vs-mocha/ and like he said, @Souravirus has switched to Mocha in plots2 (publiclab/plots2#2967 (comment))
So if we could discuss the pros and cons of the three, it would be pretty great! I am beginning to write tests in mocha, just for the sake of understanding it right now.
Also, I would love a suggestion on a testing framework for UI testing.
cc @jywarren @rexagod @namangupta01 @gauravano @Souravirus @IgorWilbert

Planning Issue : Sensor Data Upload and Display Library

Here's a checklist of what is left to do:

  • Integration with plots2

Model and Controller are ready. We need to establish routes and save files against the user.

  • Displaying per-user data

Once the integration with plots2 is complete, we can move to its page design and implementation.

  • Create charts from previously uploaded files

After integration, just have to list out the files uploaded by the user and normal flow resumes

  • Publish as a research note (Post Integration)

  • Browsable Time Slider (Work in progress) [Implemented through Plotly]

  • Add Graph feature from the same CSV (Work in progress)

  • Add multiple graphs from multiple CSVs (Work in progress)

  • Export Options (Discussion)
    Save as Image (done)
    Save as Excel spreadsheet (done)

  • More UI Designing (Work in progress)
    A decent design is ready, which is easy to understand and work with. We will be advancing towards
    the complete design a little later in the timeline, so that the functional stuff can be implemented and
    tested on priority.

  • Testing (WIP)
    Learning about testing and testing frameworks. Also, some code will be restructured and refactored,
    as the process of going through testing made me realize that the code can be structured for a better
    understanding of it, as that's one of the reasons why tests are written: To easily understand what
    the code aims to achieve.

@namangupta01 @jywarren what do you think is left and can be added here? Please feel free to! Thanks!

Browsable Time Slider

I was trying to make the browsable time slider using https://github.com/schme16/Chart.js-RangeSlider .

But when I included the script file https://gitcdn.link/cdn/schme16/Chart.js-RangeSlider/677a7eb6c295772606d300697eaf552245e7f171/dist/RangeSlider-all.min.js, it seems to be interfering with the bootstrap's JS file and shows an error like

image

What could be the reason that the scripts are interfering with each other? Is there a way to fix it, because I tried but couldn't, we can keep trying or any other suggestions for time sliders? @jywarren @namangupta01 Thank You!

Integration With Plots2

This is the next thing we need to do.
Once this is integrated with the main site like PL editor, the functionality will remain the same, but we need to understand how this is to be done.
I am not very sure about how to begin with it, and it would be great if I could get some guidance here for the same.
Once we have integrated this, we have to implement (some or all) of the following features:

  • Displaying per-user data

  • Publishing generated charts as a Research Note

  • Plot charts from previously uploaded files.

Detailed explanations can be found at https://publiclab.org/notes/IshaGupta18/03-04-2019/gsoc-proposal-sensor-data-upload-and-display-library

@jywarren @namangupta01 @gauravano @rexagod @IgorWilbert it would be great if you all could start me up with this one. Thanks a ton!

Recommend Projects

  • React photo React

    A declarative, efficient, and flexible JavaScript library for building user interfaces.

  • Vue.js photo Vue.js

    πŸ–– Vue.js is a progressive, incrementally-adoptable JavaScript framework for building UI on the web.

  • Typescript photo Typescript

    TypeScript is a superset of JavaScript that compiles to clean JavaScript output.

  • TensorFlow photo TensorFlow

    An Open Source Machine Learning Framework for Everyone

  • Django photo Django

    The Web framework for perfectionists with deadlines.

  • D3 photo D3

    Bring data to life with SVG, Canvas and HTML. πŸ“ŠπŸ“ˆπŸŽ‰

Recommend Topics

  • javascript

    JavaScript (JS) is a lightweight interpreted programming language with first-class functions.

  • web

    Some thing interesting about web. New door for the world.

  • server

    A server is a program made to process requests and deliver data to clients.

  • Machine learning

    Machine learning is a way of modeling and interpreting data that allows a piece of software to respond intelligently.

  • Game

    Some thing interesting about game, make everyone happy.

Recommend Org

  • Facebook photo Facebook

    We are working to build community through open source technology. NB: members must have two-factor auth.

  • Microsoft photo Microsoft

    Open source projects and samples from Microsoft.

  • Google photo Google

    Google ❀️ Open Source for everyone.

  • D3 photo D3

    Data-Driven Documents codes.