d3-contour
Compute contour polygons using marching squares.
Installing
If you use NPM, npm install d3-contour. Otherwise, download the latest release. You can also load directly from d3js.org, either as a standalone library or as part of D3 4.0. AMD, CommonJS, and vanilla environments are supported. In vanilla, a d3 global is exported:
<script src="https://d3js.org/d3-contour.v1.min.js"></script>
<script>
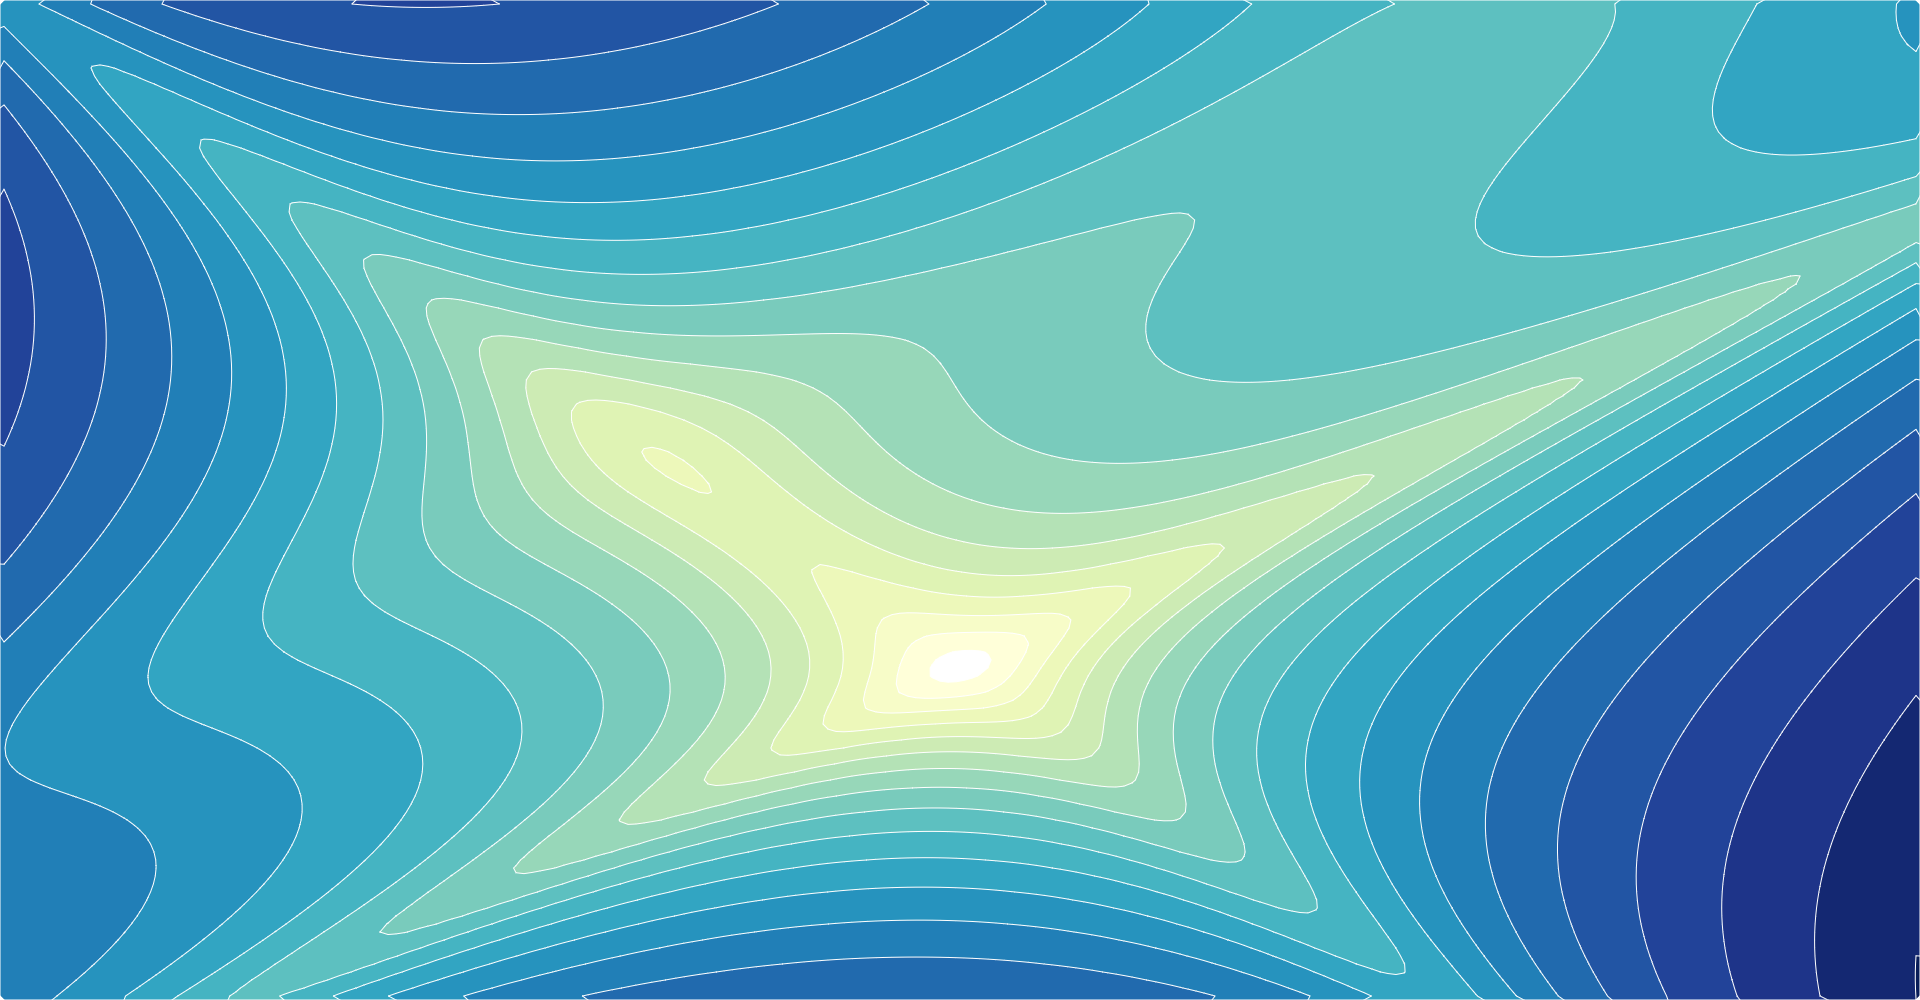
// Populate a grid of n×m values where -2 ≤ x ≤ 2 and -2 ≤ y ≤ 1.
var n = 256, m = 256, values = new Array(n * m);
for (var j = 0.5, k = 0; j < m; ++j) {
for (var i = 0.5; i < n; ++i, ++k) {
values[k] = goldsteinPrice(i / n * 4 - 2, 1 - j / m * 3);
}
}
// Compute the contour polygons at log-spaced intervals; returns an array of MultiPolygon.
var contours = d3.contours()
.size([n, m])
.thresholds(d3.range(2, 21).map(p => Math.pow(2, p)))
(values);
// See https://en.wikipedia.org/wiki/Test_functions_for_optimization
function goldsteinPrice(x, y) {
return (1 + Math.pow(x + y + 1, 2) * (19 - 14 * x + 3 * x * x - 14 * y + 6 * x * x + 3 * y * y))
* (30 + Math.pow(2 * x - 3 * y, 2) * (18 - 32 * x + 12 * x * x + 48 * y - 36 * x * y + 27 * y * y));
}
</script>Try d3-contour in your browser.
API Reference
Constructs a new contour generator with the default settings.
Computes the contours for the given array of values, returning an array of GeoJSON MultiPolygon geometry objects. Each geometry object represents the area where the input values area greater than or equal to the corresponding threshold value; the threshold value for each geometry object is exposed as geometry.value.
The input values must be an array of length n×m where [n, m] is the contour generator’s size; furthermore, each values[i + jn] must represent the value at the position ⟨i, j⟩. For example, to construct a 256×256 grid for the Goldstein–Price function where -2 ≤ x ≤ 2 and -2 ≤ y ≤ 1:
var n = 256, m = 256, values = new Array(n * m);
for (var j = 0.5, k = 0; j < m; ++j) {
  for (var i = 0.5; i < n; ++i, ++k) {
    values[k] = goldsteinPrice(i / n * 4 - 2, 1 - j / m * 3);
  }
}

function goldsteinPrice(x, y) {
  return (1 + Math.pow(x + y + 1, 2) * (19 - 14 * x + 3 * x * x - 14 * y + 6 * x * x + 3 * y * y))
      * (30 + Math.pow(2 * x - 3 * y, 2) * (18 - 32 * x + 12 * x * x + 48 * y - 36 * x * y + 27 * y * y));
}
The returned geometry objects are typically passed to d3.geoPath to display, using null or d3.geoIdentity as the associated projection.
If size is specified, sets the expected size of the input values grid to the contour generator and returns the contour generator. The size is specified as an array [n, m] where n is the number of columns in the grid and m is the number of rows; n and m must be positive integers. If size is not specified, returns the current size which defaults to [1, 1].
# contours.smooth([smooth]) <>
If smooth is specified, sets whether or not the generated contour polygons are smoothed using linear interpolation. If smooth is not specified, returns the current smoothing flag, which defaults to true.
# contours.thresholds([thresholds]) <>
If thresholds is specified, sets the threshold generator to the specified function or array and returns this contour generator. If thresholds is not specified, returns the current threshold generator, which by default implements Sturges’ formula.
Thresholds are defined as an array of values [x0, x1, …]. The first generated contour corresponds to the area where the input values are greater than or equal to x0; the second contour corresponds to the area where the input values are greater than or equal to x1, and so on. Thus, there is exactly one generated MultiPolygon geometry object for each specified threshold value; the threshold value is exposed as geometry.value.
If a count is specified instead of an array of thresholds, then the input values’ extent will be uniformly divided into approximately count bins; see d3.ticks.

