Hinge allows users to request an export of their personal data that was collected while they were using the app. If you have a Hinge account, you can request your data by going to Settings -> Download My Data. It typically takes between 24 and 48 hours to fulfill this request, and once the data are ready, Hinge provides a .zip file with your personal data.
The data export provided by Hinge contains several files, but the main thing is the index.html file, which is used to render a web page with tabs showing different data. The tabs provided by Hinge are labeled: User, Matches, Prompts, Media, Subscriptions, Fresh Starts, and Selfie Verification. Aside from viewing changes to your prompts or seeing which pictures you've uploaded, these data are not particularly useful, especially on the Matches tab which should be the most interesting part.
The Matches tab in the Hinge export contains a list of "Matches", or rather "interactions" as I call them in this project, like this:
Match # 1 2024-01-22 20:13:22 Like
Match # 2 2024-01-23 20:15:42 Like
Match # 3 2024-01-23 20:37:27 Match
2024-01-23 20:39:45 Chat: Hello, World!
2024-01-23 21:49:26 Remove
The list of Matches provided by Hinge leaves a lot to be desired, which is why I decided to build this project analyzing and visualizing interesting insights from the Hinge data export.
The application is a multi page Dash Plotly application that runs in a Docker container on port 8050. Create a Docker build image with: docker compose build and run the app with: docker compose up -d. The app will be available at http://0.0.0.0:8050/. To bring the container down, use docker compose down.
The page will render with information about the app and instructions on how to use it.
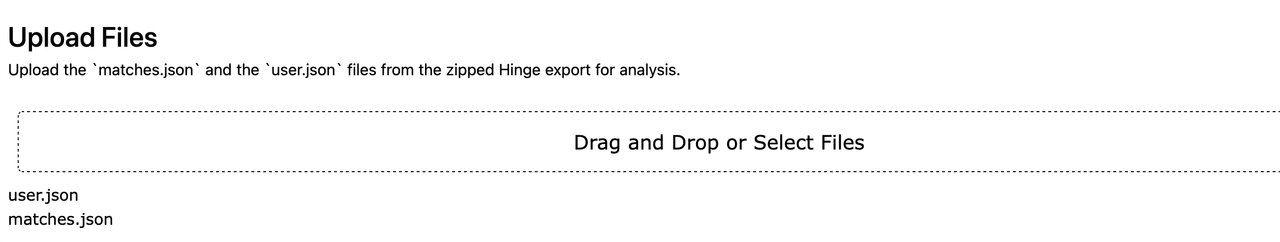
The "Upload Files" section allows users to upload a matches.json or user.json file for analysis. At the moment, the program expects the file to be called matches.json or user.json, as they are in the export provided by Hinge. After a file has been selected, it should show the uploaded file name(s) under the upload box.
The "Data Insights" section contains links to display pages with data related to match data or user data. Click on "Matches" or "Users" to show the information and graphs for either topic. The visualizations will initially show as blank graphs until a file has been upload and the graphs have been reloaded. Clicking the "Reload Graphs" button will regenerate the graphs with the uploaded data.
The match analytics page contains several graphs that show different aspects of the match data. Hinge only provides data on the user's actions for privacy reasons, so most of the data pertains to how the user interacted with other users.
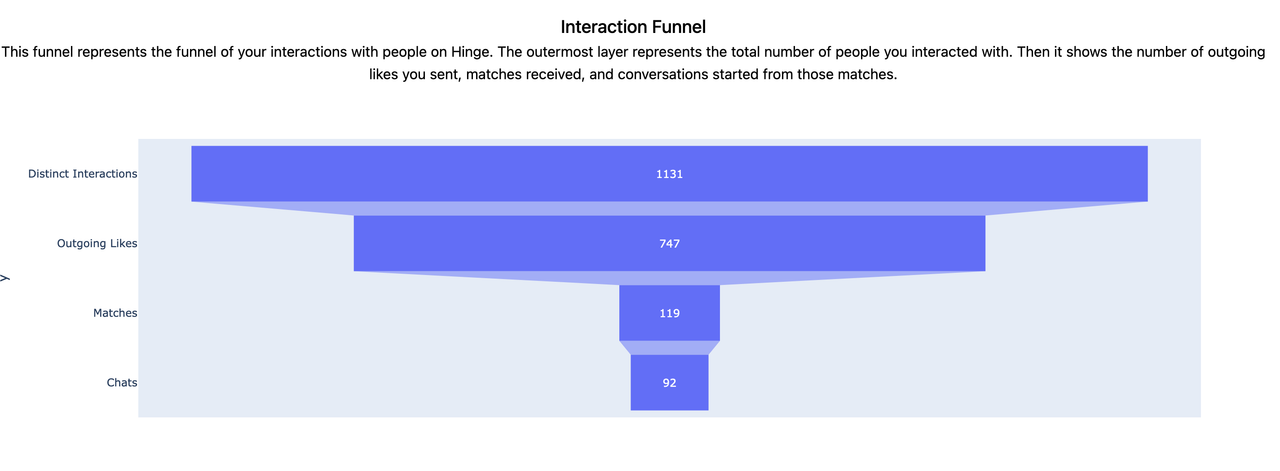
The first graph is the Interaction Funnel, which is a visualization of the different types of interactions that occurred between the user and other users. The outermost part of the funnel "Distinct Interactions" is the total number of unique interactions that occurred. This is a combination of likes the user received and did not reciprocate, likes the user sent and were not reciprocated, and likes the user sent that lead to matches and chats.
The funnel is a good way to see how many interactions were initiated by the user and how many lead to matches and conversations.
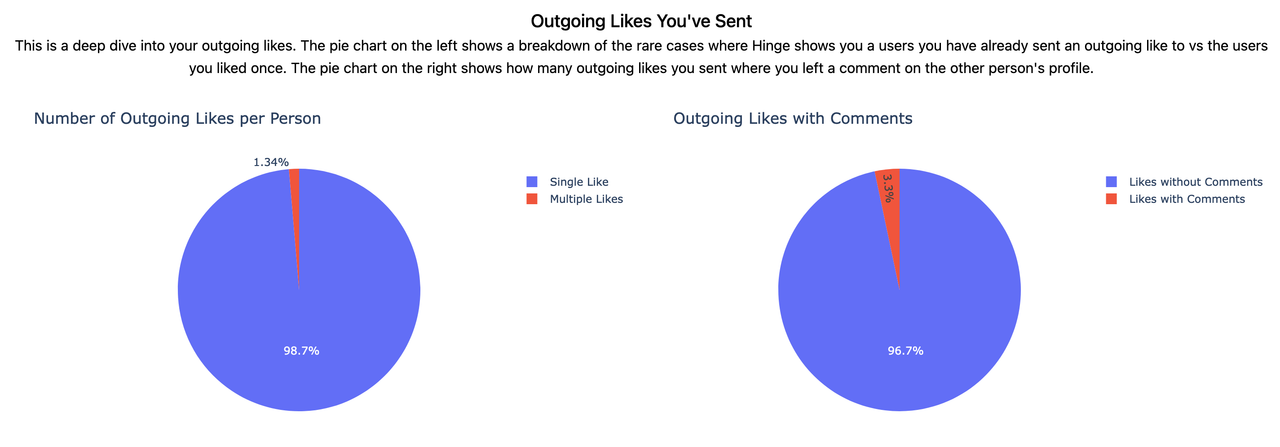
The Outgoing Likes You've Sent section contains charts that go into more detail about the user's outgoing likes. The first chart shows users on the app that the user liked more than once. This scenario is perplexing, as it is not clear how this can happen, but does occur infrequently in the data. The second pie chart to the right shows the ratio of how many outgoing likes the user sent with a comment.
Underneath the pie charts, there is a table called What You're Commenting When You Like Someone's Content, that shows the comments the user left on other users' profiles when the user liked them. This table is useful for seeing what the user was saying to other users when they liked them.
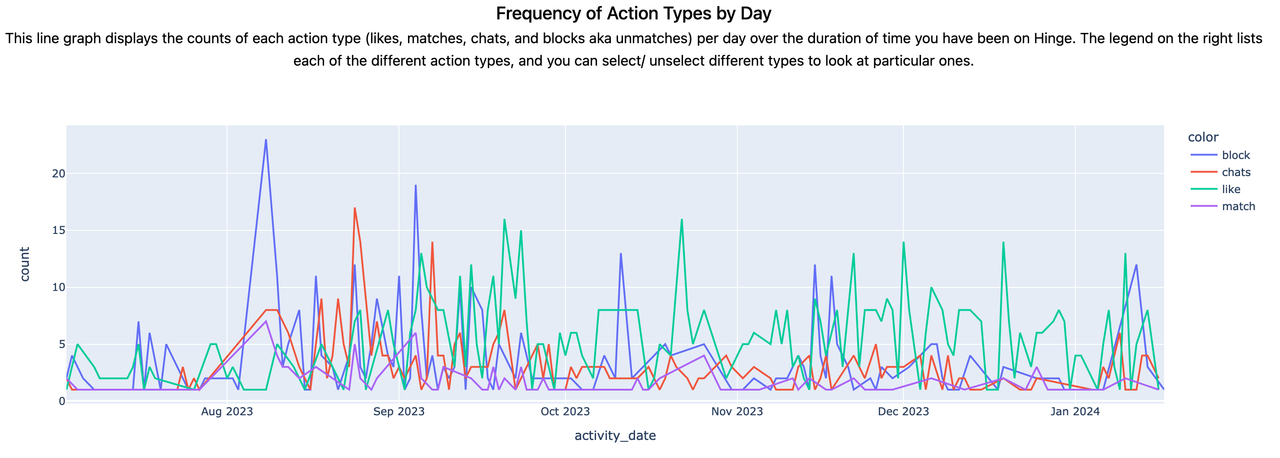
The next section Frequency of Action Types by Day, shows the frequency of different actions the user took on the app by day. This is useful for seeing patterns of activity and when they were most active on the app.
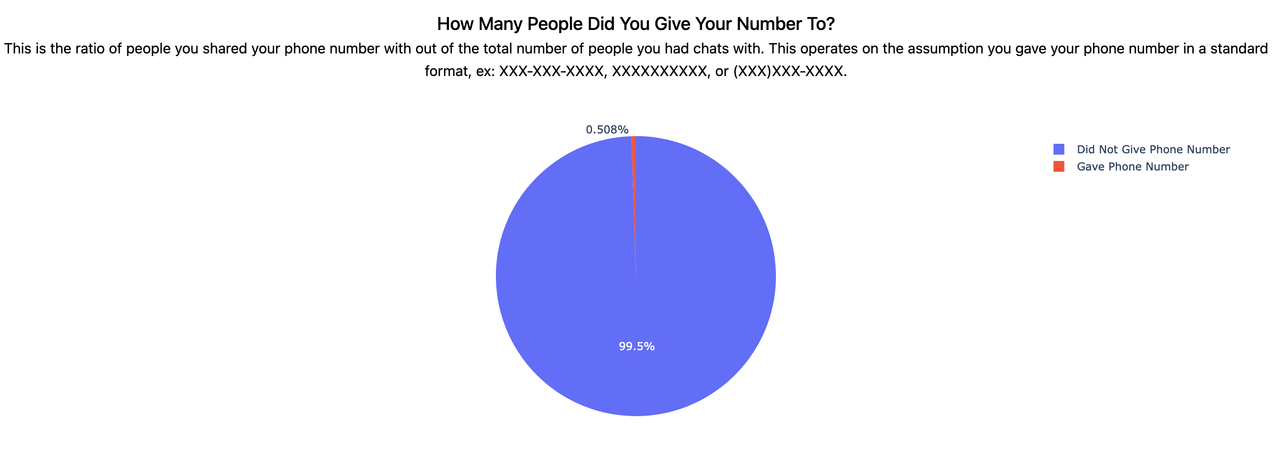
After that, there is a pie chart called How Many People Did You Give Your Number To?, which shows exactly that. Of the all the interactions a user had that lead to chats, this graph shows the ratio of how many chats lead to the user giving out their phone number. This operates under the assumption that the user shared their phone number in one of the common formats listed below.
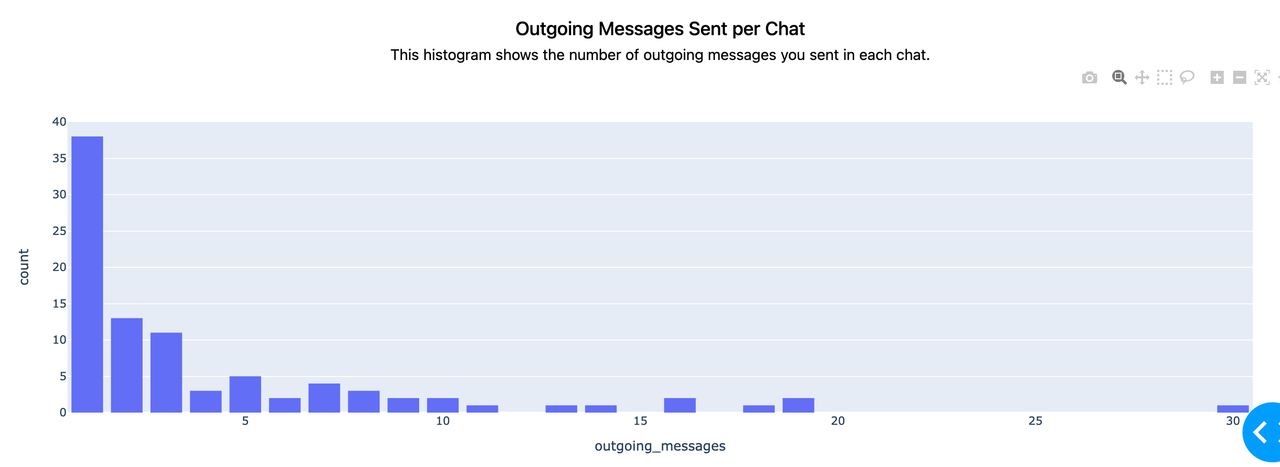
The last section of the Match Analytics shows Outgoing Message per Chat. This bar graph is a distribution of how many messages were sent by the user in each interaction where messages were exchanged. This is useful for seeing the average length of conversations the user had with others.
This tab is currently under construction and will be available in a future release.
Hinge changes and updates the schema of the data export from time to time, and that may or may not break the current analysis code and make things obsolete. So far, I haven't experienced any schema changes that have broken my code, but I assume that over time, changes will occur and things will no longer work. I haven't found a way to stay up to date with their schema changes at this time.
Since there is no documentation provided by Hinge, here are some assumptions I am making about the data:
- Blocks, or "un-matches" (
where block_type = 'remove') could go either direction, meaning that block could represent someone removing the match with the user, or it could represent the user removing the block with someone else- I assume this also includes people the user came across while swiping that they wanted to remove from the deck
- Matches without a like in the same event mean that someone liked the user first, and the user matched with them (i.e. there was no outgoing like sent first)
There are several possible scenarios happening in the export data in what Hinge refers to as "matches". These are not all "matches", because some events are simply outgoing likes that were not reciprocated. This is why I refer to them as interactions, where an interaction represents the encounters (likes, matches, chats, blocks) that occurred between the user and another person.
Here are the different scenarios of interactions that occur in the data:
| Like | Match | Chats | Block | Meaning |
|---|---|---|---|---|
| X | The user sent an outgoing, the person did not like them back | |||
| X | X | X | The user sent an outgoing like, the other person liked them back, at least one message was exchanged | |
| X | X | The user received an incoming like, the user liked the other person back and at least one message was exchanged | ||
| X | The match was removed or "unmatched", can't tell who unmatched who. For some reason, a lot of these exist without any other information and there is no way to tell which interaction it was originally linked to | |||
| X | X | The user received an incoming like, the user liked the other person back, no messages were exchanged, and the match was removed |
I have a long list of enhancements and fixes that I want to do to the application to make it better. To see what's on deck, check out the Projects tab in the repo.

