GithubHelp home page GithubHelp logo

webdevops / azure-resourcemanager-exporter Goto Github PK

View Code? Open in Web Editor NEW
29.0 8.0 15.0 777 KB

Prometheus exporter for Azure ResourceManager informations (infos, quotas, limits, usages, public IPs, portscanner)

License: MIT License

Dockerfile 0.88% Go 96.79% Makefile 2.33%
azure azure-resource-manager prometheus-exporter prometheus-metrics azure-metrics golang portscanner

azure-resourcemanager-exporter's Introduction

Azure ResourceManager Exporter

license DockerHub Quay.io Artifact Hub

Prometheus exporter for Azure information.

Features

  • Uses of official Azure SDK for go

  • Supports all Azure environments (Azure public cloud, Azure governmant cloud, Azure china cloud, ...) via Azure SDK configuration

  • Docker image is based on Google's distroless static image to reduce attack surface (no shell, no other binaries inside image)

  • Available via Docker Hub and Quay (see badges on top)

  • Can run non-root and with readonly root filesystem, doesn't need any capabilities (you can safely use drop: ["All"])

  • Publishes Azure API rate limit metrics (when exporter sends Azure API requests)

useful with additional exporters:

  • azure-resourcegraph-exporter for exporting Azure resource information from Azure ResourceGraph API with custom Kusto queries (get the tags from resources and ResourceGroups with this exporter)
  • azure-metrics-exporter for exporting Azure Monitor metrics
  • azure-keyvault-exporter for exporting Azure KeyVault information (eg expiry date for secrets, certificates and keys)
  • azure-loganalytics-exporter for exporting Azure LogAnalytics workspace information with custom Kusto queries (eg ingestion rate or application error count)

Configuration

Usage:
  azure-resourcemanager-exporter [OPTIONS]

Application Options:
      --log.debug             debug mode [$LOG_DEBUG]
      --log.devel             development mode [$LOG_DEVEL]
      --log.json              Switch log output to json format [$LOG_JSON]
      --config=               Path to config file [$CONFIG]
      --azure.tenant=         Azure tenant id [$AZURE_TENANT_ID]
      --azure.environment=    Azure environment name (default: AZUREPUBLICCLOUD) [$AZURE_ENVIRONMENT]
      --cache.path=           Cache path (to folder, file://path... or azblob://storageaccount.blob.core.windows.net/containername or
                              k8scm://{namespace}/{configmap}}) [$CACHE_PATH]
      --server.bind=          Server address (default: :8080) [$SERVER_BIND]
      --server.timeout.read=  Server read timeout (default: 5s) [$SERVER_TIMEOUT_READ]
      --server.timeout.write= Server write timeout (default: 10s) [$SERVER_TIMEOUT_WRITE]

Help Options:
  -h, --help                  Show this help message

for Azure API authentication (using ENV vars) see https://docs.microsoft.com/en-us/azure/developer/go/azure-sdk-authentication

Config file

see example.yaml

Deprecations/old resource metrics

Please use azure-resourcegraph-exporter for exporting resources. This exporter is using Azure ResourceGraph queries and not wasting Azure API calls for fetching metrics.

azure-resourcegraph-exporter provides a way how metrics can be build by using Kusto queries.

Azure permissions

This exporter needs Reader permissions on subscription level.

Metrics

Metric Collector Description
azurerm_stats Exporter General exporter stats
azurerm_costs_budget_info Costs Azure CostManagement bugdet information
azurerm_costs_budget_current Costs Current value of CostManagemnet budget usage
azurerm_costs_budget_limit Costs Limit of CostManagemnet budget
azurerm_costs_budget_usage Costs Percentage of usage of CostManagemnet budget
azurerm_costs_{queryName} Costs Costs query result (see example.yaml)
azurerm_subscription_info General Azure Subscription details (ID, name, ...)
azurerm_resource_health Health Azure Resource health information
azurerm_iam_roleassignment_info IAM Azure IAM RoleAssignment information
azurerm_iam_roledefinition_info IAM Azure IAM RoleDefinition information
azurerm_iam_principal_info IAM Azure IAM Principal information
azurerm_quota_info Quota Azure RM quota details (readable name, scope, ...)
azurerm_quota_current Quota Azure RM quota current (current value)
azurerm_quota_limit Quota Azure RM quota limit (maximum limited value)
azurerm_quota_usage Quota Azure RM quota usage in percent
azurerm_resourcegroup_info Resource Azure ResourceGroup details (subscriptionID, name, various tags ...)
azurerm_resource_info Resource Azure Resource information
azurerm_defender_secure_score_percentage Defender Azure Defender secure score percerntage per Subscription
azurerm_defender_secure_score_max Defender The maximum number of points you can gain by completing all recommendations within a control
azurerm_defender_secure_score_current Defender The current Azure Defender secure score
azurerm_defender_compliance_score Defender Azure Defender compliance score (based on applied Policies)
azurerm_defender_compliance_resources Defender Azure Defender count of compliance resource in assessment
azurerm_defender_advisor_recommendation Defender Azure Defender recommendations (eg. security findings)
azurerm_graph_app_info Graph AzureAD graph application information
azurerm_graph_app_tag Graph AzureAD graph application tag
azurerm_graph_app_credential Graph AzureAD graph application credentials (create,expiry) information
azurerm_graph_serviceprincipal_info Graph AzureAD graph servicePrincipal information
azurerm_graph_serviceprincipal_tag Graph AzureAD graph servicePrincipal tag
azurerm_graph_serviceprincipal_credential Graph AzureAD graph servicePrincipal credentials (create,expiry) information
azurerm_publicip_info Portscan Azure PublicIP information
azurerm_publicip_portscan_status Portscan Status of scanned ports (finished scan, elapsed time, updated timestamp)
azurerm_publicip_portscan_port Portscan List of opened ports per IP

ResourceTags handling

see armclient tagmanager documentation

AzureTracing metrics

see armclient tracing documentation

Caching

see prometheus collector cache documentation

azure-resourcemanager-exporter's People

Contributors

amirschw avatar bunkrur avatar dohnto avatar erroltuparker avatar jkroepke avatar mblaschke avatar paulpowershell avatar

Stargazers

 avatar  avatar  avatar  avatar  avatar  avatar  avatar  avatar  avatar  avatar  avatar  avatar  avatar  avatar  avatar  avatar  avatar  avatar  avatar  avatar  avatar  avatar  avatar  avatar  avatar  avatar  avatar  avatar  avatar

Watchers

 avatar  avatar  avatar  avatar  avatar  avatar  avatar  avatar

azure-resourcemanager-exporter's Issues

Cost Export limited to 1000 entries

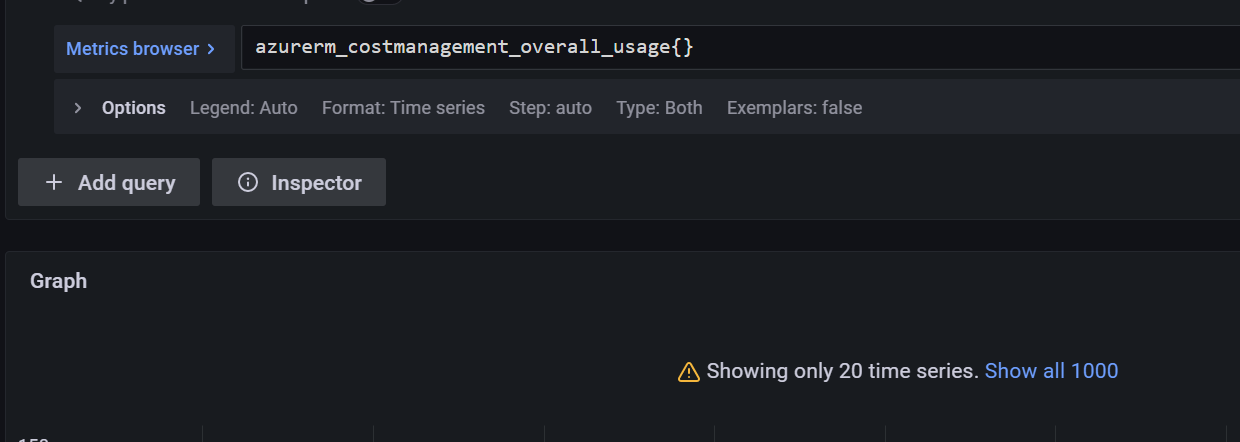
Cost management API of Azure usually limits result to 1000 records were response and in the end nextLink element is provided which is a reference to next set of result.

Azure Cost Management API

Currently cost export in version 22.9.1 returning only first 1000 records and not more than that.

image

A change would be required to look into nextLink and fetch next set of results until nextLink is empty

How to install it?

Hi,

thnx for this project.Is there any description how to install it?I just run go get -u github.com/webdevops/azure-resourcemanager-exporte and the exporter was downloaded and installed but i did not found any binary data for running it.

Support for private/air gapped cloud environments

It would be great if the exporter could support private/airgapped clouds.

To do that, we can introduce a new AZURE_RESOURCE_MANAGER_ENDPOINT flag (and AZURE_GRAPH_ENDPOINT, if graph is also used). Looking at the codebase, it seems that the change is not that straightforward given the dependency on the armclient package.

Improve cost metrics (was: Container crashing due to data collection error)

Hello everyone,

We're using your Github project "webdevops/azure-resourcemanger-exporte" to collect costs data from Azure Cost Management.
In the past, we already used the old version of this project, where the "Go" is not compiled like a Docker container. Currently, with the "Go" as a container, we're receiving the follow error, especific in the cost data collect: "RESPONSE 429: 429 Too Many Requests\nERROR CODE: 429".
We already increase the duration time that this data are collect to 5 minutes, but the problem persist. The container stoped to drop, but the "panic" in the collect still occurr, and when happen, create a gap in our dashboards.
We'd like that you help us with this issue.
Can we count on your help?

Trying to use latest version.

Hi Markus.

I'm trying to use the latest version (23.4.0-beta0), but I'm receiving an error about the "--config" parameter.
I haven't used this parameter until now. What is its content?
I tried setting it to "/go", but it didn't work.

Thanks in advance.

go-logs

Clear cache if invalid

Hi,

change cost query dimensions would result into a permanent crash

"collector":"Costs","file":"/go/pkg/mod/github.com/webdevops/[email protected]/prometheus/collector/collector.go:334","func":"collector.(*Collector).collectionStart","level":"info","msg":"starting metrics collection"}
{"collector":"Costs","file":"/go/pkg/mod/github.com/webdevops/[email protected]/prometheus/collector/cache.go:111","func":"collector.(*Collector).collectionRestoreCache","level":"info","msg":"trying to restore state from cache: /cache/costs.json"}
{"collector":"Costs","file":"/go/pkg/mod/github.com/webdevops/[email protected]/prometheus/collector/cache.go:135","func":"collector.(*Collector).collectionRestoreCache","level":"info","msg":"restored state from cache: \"/cache/costs.json\" (expiring 2023-03-20 21:10:18.733337605 +0000 UTC)"}
panic: inconsistent label cardinality: expected 5 label values but got 6 in prometheus.Labels{"ResourceGroup":"", "ServiceFamily":"Security", "SubscriptionName":"Unassigned(8749684e-50da-4acb-a8dd-203f3d23e4bf)", "currency":"eur", "subscriptionID":"8749684e-50da-4acb-a8dd-203f3d23e4bf", "timeframe":"MonthToDate"}

goroutine 85 [running]:
github.com/prometheus/client_golang/prometheus.(*GaugeVec).With(...)
	/go/pkg/mod/github.com/prometheus/[email protected]/prometheus/gauge.go:230
github.com/webdevops/go-common/prometheus.(*MetricList).GaugeSet(0xc000023ec0?, 0xc0004d63c0?)
	/go/pkg/mod/github.com/webdevops/[email protected]/prometheus/metrics_list.go:144 +0x9d
github.com/webdevops/go-common/prometheus/collector.(*Collector).collectRun(0xc000123ba0, 0x0)
	/go/pkg/mod/github.com/webdevops/[email protected]/prometheus/collector/collector.go:261 +0x43c
github.com/webdevops/go-common/prometheus/collector.(*Collector).run(0xc000123ba0)
	/go/pkg/mod/github.com/webdevops/[email protected]/prometheus/collector/collector.go:175 +0xfa
github.com/webdevops/go-common/prometheus/collector.(*Collector).Start.func1()
	/go/pkg/mod/github.com/webdevops/[email protected]/prometheus/collector/collector.go:151 +0x50
created by github.com/webdevops/go-common/prometheus/collector.(*Collector).Start
	/go/pkg/mod/github.com/webdevops/[email protected]/prometheus/collector/collector.go:143 +0x1a5

Instead a panic, i recommend a warning and clear the cache. A panic is a bit overkill for a invalid cache.

Version: 23.3.0-beta1

Better error handling - frequent restarts

I observe a crash on every 504 - might be better way to handle that ?

{"azureSubscription":"xxxx","collector":"Health","file":"metrics_azurerm_health.go:52","func":"Collect","level":"panic","msg":"resourcehealth.AvailabilityStatusesClient#ListBySubscriptionID: Failure responding to request: StatusCode=504 -- Original Error: autorest/azure: Service returned an error. Status=504 Code=\"GatewayTimeout\" Message=\"The gateway did not receive a response from 'Microsoft.ResourceHealth' within the specified time period.\""}
panic: (*logrus.Entry) 0xc002121e30

goroutine 7763 [running]:
github.com/sirupsen/logrus.(*Entry).log(0xc0006b79e8, 0x0, {0xc00023a280, 0x13f})
	/go/src/github.com/webdevops/azure-resourcemanager-exporter/vendor/github.com/sirupsen/logrus/entry.go:259 +0x24f
github.com/sirupsen/logrus.(*Entry).Log(0xc00054eb60, 0x0, {0xc0006b79e8, 0xc00025c150, 0xa2da38})
	/go/src/github.com/webdevops/azure-resourcemanager-exporter/vendor/github.com/sirupsen/logrus/entry.go:293 +0x4f
github.com/sirupsen/logrus.(*Entry).Panic(...)
	/go/src/github.com/webdevops/azure-resourcemanager-exporter/vendor/github.com/sirupsen/logrus/entry.go:331
main.(*MetricsCollectorAzureRmHealth).Collect(0xc000318a80, {0xac5be8, 0xc0000aa000}, 0xc000388620, 0x725865, {{0xc000070120}, 0xc000342b40, 0xc000342b60, 0xc000342b80, 0xc000342b70, ...})
	/go/src/github.com/webdevops/azure-resourcemanager-exporter/metrics_azurerm_health.go:52 +0x20d
main.(*CollectorGeneral).Collect.func1({0xac5be8, 0xc0000aa000}, 0xc0000707e0, {{0xc000070120}, 0xc000342b40, 0xc000342b60, 0xc000342b80, 0xc000342b70, {0xc0000aa6c9, 0x7}, ...})
	/go/src/github.com/webdevops/azure-resourcemanager-exporter/collector_general.go:53 +0x213
created by main.(*CollectorGeneral).Collect
	/go/src/github.com/webdevops/azure-resourcemanager-exporter/collector_general.go:48 +0x33b

Support single tenant azure configurations

#16 is great and works perfectly, but if the environment is single tenant then DefaultAzureCredential will fail to authenticate with a given client secret and id:

{"level":"fatal","caller":"azure-resourcemanager-exporter/main.go:147","msg":"DefaultAzureCredential: failed to aquire a token.\nAttempted credentials:\n\tClientSecretCredential: the authority doesn't support tenants"}

Latest azure-resource-manager image is vulnerable (TAG 24.3.0)- GHSA-8r3f-844c-mc37

Hey Everyone,

currently tag 24.3.0 is vulnerable
due to this package google.golang.org/protobuf v1.32.0

protobuf v1.32.0 :
This release contains commit protocolbuffers/protobuf-go@bfcd647, which fixes a denial of service vulnerability by preventing a stack overflow through a default maximum recursion limit. See golang/protobuf#1583 and golang/protobuf#1584 for details.

For more info, see here -

BR,
Adir Atias.

Feature : Expose reservation consumption metrics

Hi

Could it be also expose reservation consumption as metric ?

https://learn.microsoft.com/en-us/rest/api/consumption/reservations-summaries/list?view=rest-consumption-2023-05-01&tabs=HTTP

{
  "value": [
    {
      "id": "/providers/Microsoft.Billing/billingAccounts/12345/providers/Microsoft.Consumption/reservationSummaries/reservationSummaries_Id1",
      "name": "reservationSummaries_Id1",
      "type": "Microsoft.Consumption/reservationSummaries",
      "tags": null,
      "properties": {
        "reservationOrderId": "00000000-0000-0000-0000-000000000000",
        "reservationId": "00000000-0000-0000-0000-000000000000",
        "skuName": "Standard_B1s",
        "reservedHours": 720,
        "usageDate": "2018-09-01T00:00:00-07:00",
        "usedHours": 0,
        "minUtilizationPercentage": 0,
        "avgUtilizationPercentage": 0,
        "maxUtilizationPercentage": 0
      }
    }
  ]
}

Cannot use Managed Identity

@mblaschke After switching from deprecated AzureAD API to MSGraph API in version 22.9.0, it's no longer possible to use Managed Identity for Graph metrics. The root cause lies in the go-common module, which only supports Az CLI or Environment credentials.

It would be great if DefaultAzureCredential was used instead, which combines three credential types in one (EnvironmentCredential, ManagedIdentityCredential, AzureCLICredential).

Added startupProbe endpoint to minimize metrics gaps

Hi,

i would like to ask if its possible to and an endpoint which observes if all defined metric collectors are run once.

Such an endpoint could be used for an startupProbe. Together with RollingUpgrade, Prometheus would reference to the existing running pod until the metrics from the new pods are available. This would minimize metrics gaps on Promethes and Grafana.

Since costs queries are enabled, the initial run could takes a while. The endpoint should take care of the cache, e.g. the costs cached an available, the endpoint should not wait for an initial cost query run.

Export creation time of role assignement in IAM metrics

It would be nice to have a metric like
azurerm_iam_roleassignment_info
but containing the creation time of the role assignement.

(possible use case: alerting on temporary assignement of admin privileges for longer than a specific time frame)

Dimension cost - Too many connetions

In the latest version there is a problem with cost collection. It is returning the message "409 - Too many connections".

Using the same configuration in version 23.6.1 and there is no problem.

Public container crashes looking for --config file

It seems like the latest docker container crashes looking for the --config variable as there is no config file in the container. Is this an oversight ? I created a container based on the public image and added my own config.yaml and it worked then.
Is the container build going to be not updated going forward ? Looking more into it, it seems like I can just pass a blank config file and then configure the rest of the app using environment variables, which is preferably anyway since we run this exporter in a Kubernetes cluster.

azurerm_quota_limit and azurerm_quota_current return wrong results with scope="machinelearningservices" and quota=~"standard.*|Standard.*"

Hi,

The metric azurerm_quota_limit returns strange results, -1, with the parameters specified in the title. These limits are obviously different on Azure (0 or positives). The permission of the service principal used by the exporter is Reader on Azure management group containing all the subscriptions. An image with example comparison follows:

image

Thank you in advance for all the help,
Best regards.

Filippo Ferrando

Grafana billing dashboard

Greetings!
I want to thank you guys, for the awesome project. It is exactly what I was looking for

If someone, by chance, has an example or ready-made Grafana billing dashboard, could you please share it?
Thank you so much

Fix costs parameters in cli help

In 14bde41, cost.dimensions is replaced by cost.query, but the cli help still reports --cost.dimension

      --costs.dimension=                  Dimensions for detailed cost metrics (eg
                                          'ResourceGroup','ResourceGroupName','ResourceLocation','ConsumedService','ResourceType','ResourceId','MeterId','BillingMonth','MeterCategory','MeterSubcategory','Meter','AccountName','DepartmentName','-

                                          SubscriptionId','SubscriptionName','ServiceName','ServiceTier','EnrollmentAccountName','BillingAccountId','ResourceGuid','BillingPeriod','InvoiceNumber','ChargeType','PublisherType','ReservationId','Re-

                                          servationName','Frequency','PartNumber','CostAllocationRuleName','MarkupRuleName','PricingModel')  (space delimiter) (default: ResourceType, ResourceLocation) [$COSTS_DIMENSION]

how run it on a pod ?

Thx for this nice product. Works well on command line, but how run it on a pod ? My pod is blind, seeing 0 subscriptions. I ve try many ways as user managed identities, serviceaccount, ... but still 0.
Can you provide some ways of how to deal with a pod running the docker image on a AKS ?
thx!

costs: Return cache result instead panic

Hi, sometimes,

azure-resourcegraph-exporter just panic, because of a HTTP 429 error:

{"level":"panic","caller":"azure-resourcemanager-exporter/metrics_azurerm_costs.go:407","msg":"unexpected status code: 429","query":"resource_id_monthly","timeframe":"Custom","subscriptionID":"81ae40e4-a73e-49ed-ae42-ad441988dd01","stacktrace":"main.(*MetricsCollectorAzureRmCosts).collectCostManagementMetrics\n\t/go/src/github.com/webdevops/azure-resourcemanager-exporter/metrics_azurerm_costs.go:407\nmain.(*MetricsCollectorAzureRmCosts).collectRunCostQuery.func1\n\t/go/src/github.com/webdevops/azure-resourcemanager-exporter/metrics_azurerm_costs.go:231\ngithub.com/webdevops/go-common/azuresdk/armclient.(*SubscriptionsIterator).ForEach\n\t/go/pkg/mod/github.com/webdevops/[email protected]/azuresdk/armclient/iterator.subscriptions.go:65\nmain.(*MetricsCollectorAzureRmCosts).collectRunCostQuery\n\t/go/src/github.com/webdevops/azure-resourcemanager-exporter/metrics_azurerm_costs.go:229\nmain.(*MetricsCollectorAzureRmCosts).Collect\n\t/go/src/github.com/webdevops/azure-resourcemanager-exporter/metrics_azurerm_costs.go:189\ngithub.com/webdevops/go-common/prometheus/collector.(*Collector).collectRun.func1\n\t/go/pkg/mod/github.com/webdevops/[email protected]/prometheus/collector/collector.go:380"}
panic: unexpected status code: 429

goroutine 8595 [running]:
go.uber.org/zap/zapcore.CheckWriteAction.OnWrite(0x0?, 0x0?, {0x0?, 0x0?, 0xc00056e160?})
	/go/pkg/mod/go.uber.org/[email protected]/zapcore/entry.go:198 +0x65
go.uber.org/zap/zapcore.(*CheckedEntry).Write(0xc00172c340, {0x0, 0x0, 0x0})
	/go/pkg/mod/go.uber.org/[email protected]/zapcore/entry.go:264 +0x3ec
go.uber.org/zap.(*SugaredLogger).log(0xc0001200a0, 0x4, {0x0?, 0x23?}, {0xc0018a9820?, 0xc00012a028?, 0xc0001200a0?}, {0x0, 0x0, 0x0})
	/go/pkg/mod/go.uber.org/[email protected]/sugar.go:295 +0xee
go.uber.org/zap.(*SugaredLogger).Panic(...)
	/go/pkg/mod/go.uber.org/[email protected]/sugar.go:153
main.(*MetricsCollectorAzureRmCosts).collectCostManagementMetrics(0xc0003997c0, 0x19?, 0xc0003806a0, {0xc0003a3c00, 0x33}, {0x2357915, 0xa}, 0xc0018a9ed8, {0xc00005ecaa, 0x6}, ...)
	/go/src/github.com/webdevops/azure-resourcemanager-exporter/metrics_azurerm_costs.go:407 +0xc99
main.(*MetricsCollectorAzureRmCosts).collectRunCostQuery.func1(0xc000476660, 0xc00306bb18?)
	/go/src/github.com/webdevops/azure-resourcemanager-exporter/metrics_azurerm_costs.go:231 +0x1db
github.com/webdevops/go-common/azuresdk/armclient.(*SubscriptionsIterator).ForEach(0xc000120050?, 0xc00306bcf0?, 0xc0018a9d00)
	/go/pkg/mod/github.com/webdevops/[email protected]/azuresdk/armclient/iterator.subscriptions.go:65 +0x1e2
main.(*MetricsCollectorAzureRmCosts).collectRunCostQuery(0xc0003997c0, 0xc0018a9ed8, 0xc000077e08?)
	/go/src/github.com/webdevops/azure-resourcemanager-exporter/metrics_azurerm_costs.go:229 +0x2ed
main.(*MetricsCollectorAzureRmCosts).Collect(0xc0003997c0, 0x26343e0?)
	/go/src/github.com/webdevops/azure-resourcemanager-exporter/metrics_azurerm_costs.go:189 +0xab
github.com/webdevops/go-common/prometheus/collector.(*Collector).collectRun.func1()
	/go/pkg/mod/github.com/webdevops/[email protected]/prometheus/collector/collector.go:380 +0x98
created by github.com/webdevops/go-common/prometheus/collector.(*Collector).collectRun
	/go/pkg/mod/github.com/webdevops/[email protected]/prometheus/collector/collector.go:351 +0x13b

instead return a panic, I would like to see the possibility to return a cached response instead a crash.

azure-resourcemanager-expo crash when resource tag contain "-" in the name

The resources in my subscription get a tag "env-creation" . For instance

env-creation : 2023-04-04T09:49:39Z

When I configure the component, I use the following env variables (space delimiter)

  AZURE_RESOURCEGROUP_TAG: "creator env-creation"
  AZURE_RESOURCE_TAG: "creator env-creation"

This is crashing the pod with the following error

parse error: Invalid numeric literal at line 5, column 6

This happens in all available tags of the azure-resourcemanager-expo component.

Full log messages

starting azure-resourcemanager-exporter v23.0.0-beta2 (14bde41; go1.19.5; by webdevops.io)

{
    "Logger": {
        "Debug": false,
        "Trace": false,
        "Json": true
    },
    "Azure": {
        "Tenant": "xxxxxxxx",
        "Environment": "AZUREPUBLICCLOUD",
        "Subscription": null,
        "Location": [
            "westeurope",
            "northeurope"
        ],
        "ResourceGroupTags": [
            "creator",
            "env-creation"
        ],
        "ResourceTags": [
            "creator",
            "env-creation"
        ]
    },
    "Scrape": {
        "Time": 300000000000,
        "TimeExporter": 10000000000,
        "TimeGeneral": 300000000000,
        "TimeResource": 300000000000,
        "TimeQuota": 0,
        "TimeSecurity": 0,
        "TimeResourceHealth": 0,
        "TimeIam": 0,
        "TimeGraph": 0,
        "TimeCosts": 0,
        "TimePortscan": 300000000000
    },
    "ResourceHealth": {
        "SummaryMaxLength": 0
    },
    "Graph": {
        "ApplicationFilter": ""
    },
    "Costs": {
        "Timeframe": [
            "MonthToDate",
            "YearToDate"
        ],
        "Queries": null,
        "RequestDelay": 300000000000
    },
    "Portscan": {
        "Enabled": false,
        "Time": 10800000000000,
        "Parallel": 2,
        "Threads": 1000,
        "Timeout": 5,
        "PortRange": [
            "1-65535"
        ]
    },
    "Cache": {
        "Path": ""
    },
    "Server": {
        "Bind": ":8080",
        "ReadTimeout": 5000000000,
        "WriteTimeout": 10000000000
    }
}


init Azure connection
starting metrics collection
parse error: Invalid numeric literal at line 5, column 6

gopanic on start

Currently I'm getting an go panic on start:

{"collector":"Quota","file":"/go/src/github.com/webdevops/azure-resourcemanager-exporter/metrics_azurerm_quota.go:175","func":"main.(*MetricsCollectorAzureRmQuota).collectAzureNetworkUsage","level":"panic","msg":"network.UsagesClient#List: Failure sending request: StatusCode=409 -- Original Error: autorest/azure: Service returned an error. Status=\u003cnil\u003e Code=\"SubscriptionHasNoUsages\" Message=\"Subscription f1dcccbf-63fc-4d8b-bd87-5a0bc5225c01 has no usages in NRP.\" Details=[]","subscriptionID":"f1dcccbf-63fc-4d8b-bd87-5a0bc5225c01","subscriptionName":"Azure subscription 1"}

Same for resource health, if quota scrape is disabled:

{"collector":"Health","file":"/go/src/github.com/webdevops/azure-resourcemanager-exporter/metrics_azurerm_health.go:60","func":"main.(*MetricsCollectorAzureRmHealth).collectSubscription","level":"panic","msg":"resourcehealth.AvailabilityStatusesClient#ListBySubscriptionID: Failure sending request: StatusCode=409 -- Original Error: autorest/azure: Service returned an error. Status=\u003cnil\u003e \u003cnil\u003e","subscriptionID":"f1dcccbf-63fc-4d8b-bd87-5a0bc5225c01","subscriptionName":"Azure subscription 1"}

Is there a switch to exclude subscriptions? I also defined a list of subscriptions via AZURE_SUBSCRIPTION_ID, but seems no effect.

Cost metrics always reporting SubscriptionName with `Unassigned(xxxxxxxx-xxxx-xxxx-xxxx-xxxxxxxxxxxx)`

Hi,

I have a cost query like COSTS_QUERY_SubscriptionName: "SubscriptionName". Somehow. the metrics always contains SubscriptionName=Unassigned(xxxxxxxx-xxxx-xxxx-xxxx-xxxxxxxxxxxx) as label.

However, the container logs contains the correct subscription Name

{"collector":"Costs","file":"/go/src/github.com/webdevops/azure-resourcemanager-exporter/metrics_azurerm_costs.go:240","func":"main.(*MetricsCollectorAzureRmCosts).collectSubscription","level":"info","msg":"fetching cost report for query subscriptionname","subscriptionID":"xxxxxxxx-xxxx-xxxx-xxxx-xxxxxxxxxxxx","subscriptionName":"sub-shared-prd-euw-01"}

panic: inconsistent label cardinality:

I am testing image with tag "23.4.0-beta0"

For the following query

    costs:
        scrapeTime: 12h

        queries:
          - name: by_resourcetype
            help: Costs by ResourceGroupName and ResourceType
            dimensions: [ResourceGroupName,ResourceType]
            valueField: Cost
            timeFrames: [MonthToDate]

I am getting panic error:

panic: inconsistent label cardinality: expected 8 label values but got 6 in prometheus.Labels{"currency":"usd", "resourceGroup":"", "resourceType":"", "scope":"/subscriptions/xxxxxxxx", "subscriptionID":"xxxxxxxx", "timeframe":"MonthToDate"}

goroutine 107 [running]:
github.com/prometheus/client_golang/prometheus.(*GaugeVec).With(...)
        /go/pkg/mod/github.com/prometheus/[email protected]/prometheus/gauge.go:230
github.com/webdevops/go-common/prometheus.(*MetricList).GaugeSet(0xc000292e50?, 0x0?)
        /go/pkg/mod/github.com/webdevops/[email protected]/prometheus/metrics_list.go:144 +0x9d
github.com/webdevops/go-common/prometheus/collector.(*Collector).collectRun(0xc00015eb60, 0x1)
        /go/pkg/mod/github.com/webdevops/[email protected]/prometheus/collector/collector.go:304 +0x345
github.com/webdevops/go-common/prometheus/collector.(*Collector).run(0xc00015eb60)
        /go/pkg/mod/github.com/webdevops/[email protected]/prometheus/collector/collector.go:223 +0x158
github.com/webdevops/go-common/prometheus/collector.(*Collector).Start.func1()
        /go/pkg/mod/github.com/webdevops/[email protected]/prometheus/collector/collector.go:174 +0x50
created by github.com/webdevops/go-common/prometheus/collector.(*Collector).Start
        /go/pkg/mod/github.com/webdevops/[email protected]/prometheus/collector/collector.go:166 +0x1a5

After that my pod goes into CrashLoopBackOff status.
Any recommendation for this issue?

Cost per resource

Hi guys,

Is it possible to know the cost or consumption per resource (Ex: cost of virtual machina name X)?

Best Regards,
Jorge Souza

How to scrape multiple location

Is there a way to scrape multiple locations? I see that by default it scrapes northeurope and westeurope but couldn't figure out what to pass to the azure-location flag to scrape more than one single location. Tried to use ",", ";" and a few other delimiters without success.

Do not panic on AzureRM Errors

Hi,

from time to time we are receiving error from Azure for cost management related errors.

Some of them are persistent and after five retries, the exporter will be panic and exited.

I would like to ask, if the behavior can be changed from panic level to error level. I do not need any benefit of letting the exporter terminate.

Example panic trace after 5 retries:

goroutine 1265 [running]:
go.uber.org/zap/zapcore.CheckWriteAction.OnWrite(0x0?, 0xc0001eac00?, {0x0?, 0x0?, 0xc00046e5c0?})
	/go/pkg/mod/go.uber.org/[email protected]/zapcore/entry.go:198 +0x65
go.uber.org/zap/zapcore.(*CheckedEntry).Write(0xc0000fcd00, {0x0, 0x0, 0x0})
	/go/pkg/mod/go.uber.org/[email protected]/zapcore/entry.go:264 +0x3ec
go.uber.org/zap.(*SugaredLogger).log(0xc0000b8258, 0x4, {0x0?, 0xc0000d1300?}, {0xc000265350?, 0xc0001d7600?, 0xc000375370?}, {0x0, 0x0, 0x0})
	/go/pkg/mod/go.uber.org/[email protected]/sugar.go:295 +0xee
go.uber.org/zap.(*SugaredLogger).Panic(...)
	/go/pkg/mod/go.uber.org/[email protected]/sugar.go:153
main.(*MetricsCollectorAzureRmCosts).sendCostQuery(0x23?, {0x17649b0, 0xc000048048}, 0xc0000b8258, {0xc0000d1300, 0x33}, {0xc0001d7600, 0xc000375370, 0xc000375230, 0x0}, ...)
	/go/src/github.com/webdevops/azure-resourcemanager-exporter/metrics_azurerm_costs.go:495 +0x451
main.(*MetricsCollectorAzureRmCosts).collectCostManagementMetrics(0xc0001d6480, 0x11?, 0xc000118c40, {0xc0000d1300, 0x33}, {0x15d1413, 0xa}, 0xc000265ef0, {0xc00033b090, 0xb}, ...)
	/go/src/github.com/webdevops/azure-resourcemanager-exporter/metrics_azurerm_costs.go:370 +0x868
main.(*MetricsCollectorAzureRmCosts).collectRunCostQuery.func1(0xc0002bd9e0, 0xc00042fb48?)
	/go/src/github.com/webdevops/azure-resourcemanager-exporter/metrics_azurerm_costs.go:225 +0x1db
github.com/webdevops/go-common/azuresdk/armclient.(*SubscriptionsIterator).ForEach(0xc0000b8220?, 0xc00042fd20?, 0xc000265d30)
	/go/pkg/mod/github.com/webdevops/[email protected]/azuresdk/armclient/iterator.subscriptions.go:65 +0x1e2
main.(*MetricsCollectorAzureRmCosts).collectRunCostQuery(0xc0001d6480, 0xc000265ef0, 0xc0001c5e10?)
	/go/src/github.com/webdevops/azure-resourcemanager-exporter/metrics_azurerm_costs.go:223 +0x2ed
main.(*MetricsCollectorAzureRmCosts).Collect(0xc0001d6480, 0x1753340?)
	/go/src/github.com/webdevops/azure-resourcemanager-exporter/metrics_azurerm_costs.go:183 +0xe5
github.com/webdevops/go-common/prometheus/collector.(*Collector).collectRun.func1()
	/go/pkg/mod/github.com/webdevops/[email protected]/prometheus/collector/collector.go:380 +0x98
created by github.com/webdevops/go-common/prometheus/collector.(*Collector).collectRun
	/go/pkg/mod/github.com/webdevops/[email protected]/prometheus/collector/collector.go:351 +0x13b

Next stable release?

Hi,

we have several beta which contains a lot of fixes around the cost metrics. I would like to ask when the next stable release is planned?

How do I make the costs queries in this new version?

How should we set the configuration parameter (--config)?
When I try to use this parameter I get the following error:

2023-07-25T18:25:32.633868750Z {"level":"info","caller":"azure-resourcemanager-exporter/main.go:111","msg":"reading config from "/home/centos/config.yaml""}
2023-07-25T18:25:32.634201955Z {"level":"fatal","caller":"azure-resourcemanager-exporter/main.go:115","msg":"open /home/centos/config.yaml: no such file or directory","stacktrace":"main.initConfig\n\t/go/src/github.com/webdevops/azure-resourcemanager-exporter/main.go:115\nmain.main\n\t/go/src/github.com/webdevops/azure-resourcemanager-exporter/main.go:69\nruntime.main\n\t/usr/local/go/src/runtime/proc.go:250"}

23.3.0-beta4: unable to parse Azure resourceID

On each cost query, I receive a tag warning:

{"level":"info","caller":"azure-resourcemanager-exporter/metrics_azurerm_costs.go:262","msg":"fetching cost report for query \"resourcegroup\" and timeframe \"MonthToDate\"","collector":"Costs","subscriptionID":"791f8b17-0000-0000-0000-ed618a091646","subscriptionName":"shared-prod-001"}
{"level":"warn","caller":"armclient/client.tags.go:286","msg":"unable to fetch resource tags for resource \"/subscriptions/791f8b17-0000-0000-0000-ed618a091646/resourceGroups/\": unable to parse Azure resourceID \"/subscriptions/791f8b17-0000-0000-0000-ed618a091646/resourcegroups/\"","component":"armClientTagManager"}

Query:

COSTS_QUERY_ResourceGroup: "ResourceGroup"

Provide Helm chart

Thanks for this project! It would be cool to provide a Helm chart so users know how to install it properly on Kubernetes. Should it be a daemonset? A deployment?

Thanks!

Add scrape time metrics

Hi,

after the requirements of configure high intervals for cost metrics (>12h), a additional metric which contains the last scrape would be useful. The use case here is to display something like "Last updated at" panel at grafana. If cache enabled, the time should be not modified across restarts.

Exporter unable to start

Getting the following error on exporter start

{"file":"main.go:71","func":"main","level":"info","msg":"starting http server on :8080"}
{"collector":"GraphApps","file":"collector_base.go:45","func":"collectionStart","level":"info","msg":"starting metrics collection"}
{"collector":"RateLimitRead","duration":2.100730107,"file":"collector_base.go:54","func":"collectionFinish","level":"info","msg":"finished metrics collection (duration: 2.100730107s)"}
{"collector":"ContainerInstance","duration":2.229651688,"file":"collector_base.go:54","func":"collectionFinish","level":"info","msg":"finished metrics collection (duration: 2.229651688s)"}
{"collector":"GraphApps","file":"metrics_graph_apps.go:71","func":"Collect","level":"panic","msg":"graphrbac.ApplicationsClient#List: Failure responding to request: StatusCode=400 -- Original Error: autorest/azure: Service returned an error. Status=400 Code=\"Unknown\" Message=\"Unknown service error\" Details=[{\"odata.error\":{\"code\":\"Request_InvalidRequestUrl\",\"message\":{\"lang\":\"en\",\"value\":\"Request url was invalid. The request should be like /tenantdomainname/Entity or /$metadata. Tenant domain name can be any of the verified, unverified domain names or context id.\"}}}]"}
panic: (*logrus.Entry) 0xc0014f9ab0

Authentication is done using MSI, granted both Reader and Tag Contributor access.
Not setting any ENV beside that and using defaults

Is there a way we configure a custom metric?

In azure rest API you have the option to extract creation and change time of an azure resource

az rest \
    --method GET \
    --url "https://management.azure.com/subscriptions/{subscription-id}/resources" \
    --url-parameters api-version=2020-06-01 \$expand=createdTime \$select=name,createdTime

Is there a way to configure azure-resourcemanager-exporter to create a new metric that will have as value the create time of the resource?

Say you can configure the new metric to have the same labels as azurerm_resource_info metric and as value the creation date of the resource. In order to not return the date for all resources, you could also specify in the config the resources that you are interested (for example the name of the azure providers:disks, virtualmachines, managedclusters etc).

The goal is to be able to sort resources according to creation date in prometheus. When we have the creation date as label of the metric, you can't really filter with an expression like, give me all VMs that are older that one month old.

Cannot find subscription in AzureUSGovernmentCloud

When trying to deploy the exporter to AzureUSGovernmentCloud, it's failing with status 404 - "The subscription 'REDACTED' could not be found".

{"file":"main.go:62","func":"main","level":"info","msg":"starting azure-resourcemanager-exporter v21.10.1 (a5ae429; go1.17.2; by webdevops.io)"}
{"file":"main.go:63","func":"main","level":"info","msg":"{\"Logger\":{\"Debug\":true,\"Verbose\":true,\"LogJson\":true},\"Azure\":{\"Tenant\":\"***REDACTED***\",\"Environment\":\"AzureUSGovernmentCloud\",\"Subscription\":[\"***REDACTED***\"],\"Location\":[\"usgovtexas\"],\"ResourceGroupTags\":[\"owner\"],\"ResourceTags\":[\"owner\"]},\"Scrape\":{\"Time\":300000000000,\"TimeRateLimitRead\":0,\"TimeRateLimitWrite\":0,\"TimeExporter\":60000000000,\"TimeGeneral\":60000000000,\"TimeResource\":0,\"TimeQuota\":60000000000,\"TimeSecurity\":0,\"TimeResourceHealth\":0,\"TimeIam\":0,\"TimeGraph\":0,\"TimeCosts\":0},\"Graph\":{\"ApplicationFilter\":\"\"},\"Costs\":{\"Timeframe\":[\"MonthToDate\",\"YearToDate\"],\"Dimension\":[\"ResourceType\",\"ResourceLocation\"]},\"Portscan\":{\"Enabled\":false,\"Time\":10800000000000,\"Parallel\":2,\"Threads\":1000,\"Timeout\":5,\"PortRange\":[\"1-65535\"]},\"Metrics\":{\"ResourceIdLowercase\":false},\"Cache\":{\"Path\":\"\"},\"ServerBind\":\":8080\"}"}
{"file":"main.go:65","func":"main","level":"info","msg":"init Azure connection"}
{"file":"main.go:240","func":"initAzureConnection","level":"panic","msg":"subscriptions.Client#Get: Failure responding to request: StatusCode=404 -- Original Error: autorest/azure: Service returned an error. Status=404 Code=\"SubscriptionNotFound\" Message=\"The subscription '***REDACTED***' could not be found.\""}
panic: (*logrus.Entry) 0xc0000d20e0

goroutine 1 [running]:
github.com/sirupsen/logrus.(*Entry).log(0xc00072b998, 0x0, {0xc00051c360, 0x102})
        /go/pkg/mod/github.com/sirupsen/[email protected]/entry.go:259 +0x26f
github.com/sirupsen/logrus.(*Entry).Log(0xc0000d2070, 0x0, {0xc00072b998, 0x0, 0xc00018a120})
        /go/pkg/mod/github.com/sirupsen/[email protected]/entry.go:293 +0x4f
github.com/sirupsen/logrus.(*Logger).Log(0xc0002bc000, 0x0, {0xc00072b998, 0x1, 0x1})
        /go/pkg/mod/github.com/sirupsen/[email protected]/logger.go:198 +0x65
github.com/sirupsen/logrus.(*Logger).Panic(...)
        /go/pkg/mod/github.com/sirupsen/[email protected]/logger.go:247
github.com/sirupsen/logrus.Panic(...)
        /go/pkg/mod/github.com/sirupsen/[email protected]/exported.go:129
main.initAzureConnection()
        /go/src/github.com/webdevops/azure-resourcemanager-exporter/main.go:240 +0x535
main.main()
        /go/src/github.com/webdevops/azure-resourcemanager-exporter/main.go:66 +0x1b0

After having verified the subscription and tenant are correct, I am quite confident it's failing because of this piece of code:

subscriptionsClient := subscriptions.NewClient()

Since BaseURI is not passed as argument, the Azure SDK uses the default one that matches Azure Public Cloud:

https://github.com/Azure/azure-sdk-for-go/blob/651a2232ee3a50a46adb298fbbfbd0efe7670db7/services/resources/mgmt/2021-01-01/subscriptions/subscriptions.go#L24-L27

High CPU load when general.scrapeTime is set to 0 in version 23.6.0

After updating from 22.11.0 to 23.6.0 we are experiencing 100% CPU load on a single core.
It seems that setting collectors.general.scrapeTime = 0 doesn't work anymore as the following messages are spammed after starting the container:

2023-06-15 08:21:48.979 | {"level":"info","caller":"collector/collector.go:339","msg":"finished metrics collection, next run in 0s","collector":"general","duration":0.000018939,"nextRun":"2023-06-15T06:21:48.979Z"}
2023-06-15 08:21:48.979 | {"level":"info","caller":"collector/collector.go:339","msg":"finished metrics collection, next run in 0s","collector":"general","duration":0.000018653,"nextRun":"2023-06-15T06:21:48.979Z"}
2023-06-15 08:21:48.979 | {"level":"info","caller":"collector/collector.go:339","msg":"finished metrics collection, next run in 0s","collector":"general","duration":0.000021911,"nextRun":"2023-06-15T06:21:48.979Z"}
2023-06-15 08:21:48.979 | {"level":"info","caller":"collector/collector.go:339","msg":"finished metrics collection, next run in 0s","collector":"general","duration":0.000019355,"nextRun":"2023-06-15T06:21:48.979Z"}
2023-06-15 08:21:48.979 | {"level":"info","caller":"collector/collector.go:339","msg":"finished metrics collection, next run in 0s","collector":"general","duration":0.000018812,"nextRun":"2023-06-15T06:21:48.979Z"}

This is how our config in 23.6.0 looks like:

config.yaml:

azure:
  subscriptions: ["SUBSCRIPTION ID"]
  locations: ["germanywestcentral"]
collectors:
  # set general.scrapeTime to 0 to deactivate all scrapers by default.
  general:
    scrapeTime: "0"
  quota:
    scrapeTime: "5m"

Commandline args:

--config "/etc/config/config.yaml"
--azure.tenant "TENANT ID"

In version 22.11.0 it looked like this and was working just fine:

--scrape.time "0"
--scrape.time.quota "5m"
--azure.subscription "SUBSCRIPTION ID"
--azure.location "germanywestcentral"
--azure.tenant "TENANT ID"

Recommend Projects

  • React photo React

    A declarative, efficient, and flexible JavaScript library for building user interfaces.

  • Vue.js photo Vue.js

    ๐Ÿ–– Vue.js is a progressive, incrementally-adoptable JavaScript framework for building UI on the web.

  • Typescript photo Typescript

    TypeScript is a superset of JavaScript that compiles to clean JavaScript output.

  • TensorFlow photo TensorFlow

    An Open Source Machine Learning Framework for Everyone

  • Django photo Django

    The Web framework for perfectionists with deadlines.

  • D3 photo D3

    Bring data to life with SVG, Canvas and HTML. ๐Ÿ“Š๐Ÿ“ˆ๐ŸŽ‰

Recommend Topics

  • javascript

    JavaScript (JS) is a lightweight interpreted programming language with first-class functions.

  • web

    Some thing interesting about web. New door for the world.

  • server

    A server is a program made to process requests and deliver data to clients.

  • Machine learning

    Machine learning is a way of modeling and interpreting data that allows a piece of software to respond intelligently.

  • Game

    Some thing interesting about game, make everyone happy.

Recommend Org

  • Facebook photo Facebook

    We are working to build community through open source technology. NB: members must have two-factor auth.

  • Microsoft photo Microsoft

    Open source projects and samples from Microsoft.

  • Google photo Google

    Google โค๏ธ Open Source for everyone.

  • D3 photo D3

    Data-Driven Documents codes.