GithubHelp home page GithubHelp logo

banesullivan / localtileserver Goto Github PK

View Code? Open in Web Editor NEW
284.0 12.0 26.0 113.96 MB

๐ŸŒ dynamic tile server for visualizing rasters in Jupyter with ipyleaflet or folium

Home Page: https://localtileserver.banesullivan.com

License: MIT License

Python 72.99% HTML 15.67% JavaScript 4.52% CSS 2.56% Makefile 0.83% Dockerfile 1.05% Jupyter Notebook 2.33% Procfile 0.03%
ipyleaflet raster geospatial visualization jupyter ipywidgets cesiumjs gis python folium

localtileserver's Introduction

tile-diagram

๐ŸŒ Local Tile Server for Geospatial Rasters

codecov PyPI conda

Need to visualize a rather large (gigabytes+) raster? This is for you.

A Python package for serving tiles from large raster files in the Slippy Maps standard (i.e., /zoom/x/y.png) for visualization in Jupyter with ipyleaflet or folium.

Launch a demo on MyBinder MyBinder

Documentation: https://localtileserver.banesullivan.com/

Built on rio-tiler

๐ŸŒŸ Highlights

  • Launch a tile server for large geospatial images
  • View local or remote* raster files with ipyleaflet or folium in Jupyter
  • View rasters with CesiumJS with the built-in web application

*remote raster files should be pre-tiled Cloud Optimized GeoTiffs

๐Ÿš€ Usage

Usage details and examples can be found in the documentation: https://localtileserver.banesullivan.com/

The following is a minimal example to visualize a local raster file with ipyleaflet:

from localtileserver import get_leaflet_tile_layer, TileClient
from ipyleaflet import Map

# First, create a tile server from local raster file
client = TileClient('path/to/geo.tif')

# Create ipyleaflet tile layer from that server
t = get_leaflet_tile_layer(client)

m = Map(center=client.center(), zoom=client.default_zoom)
m.add(t)
m

ipyleaflet

โ„น๏ธ Overview

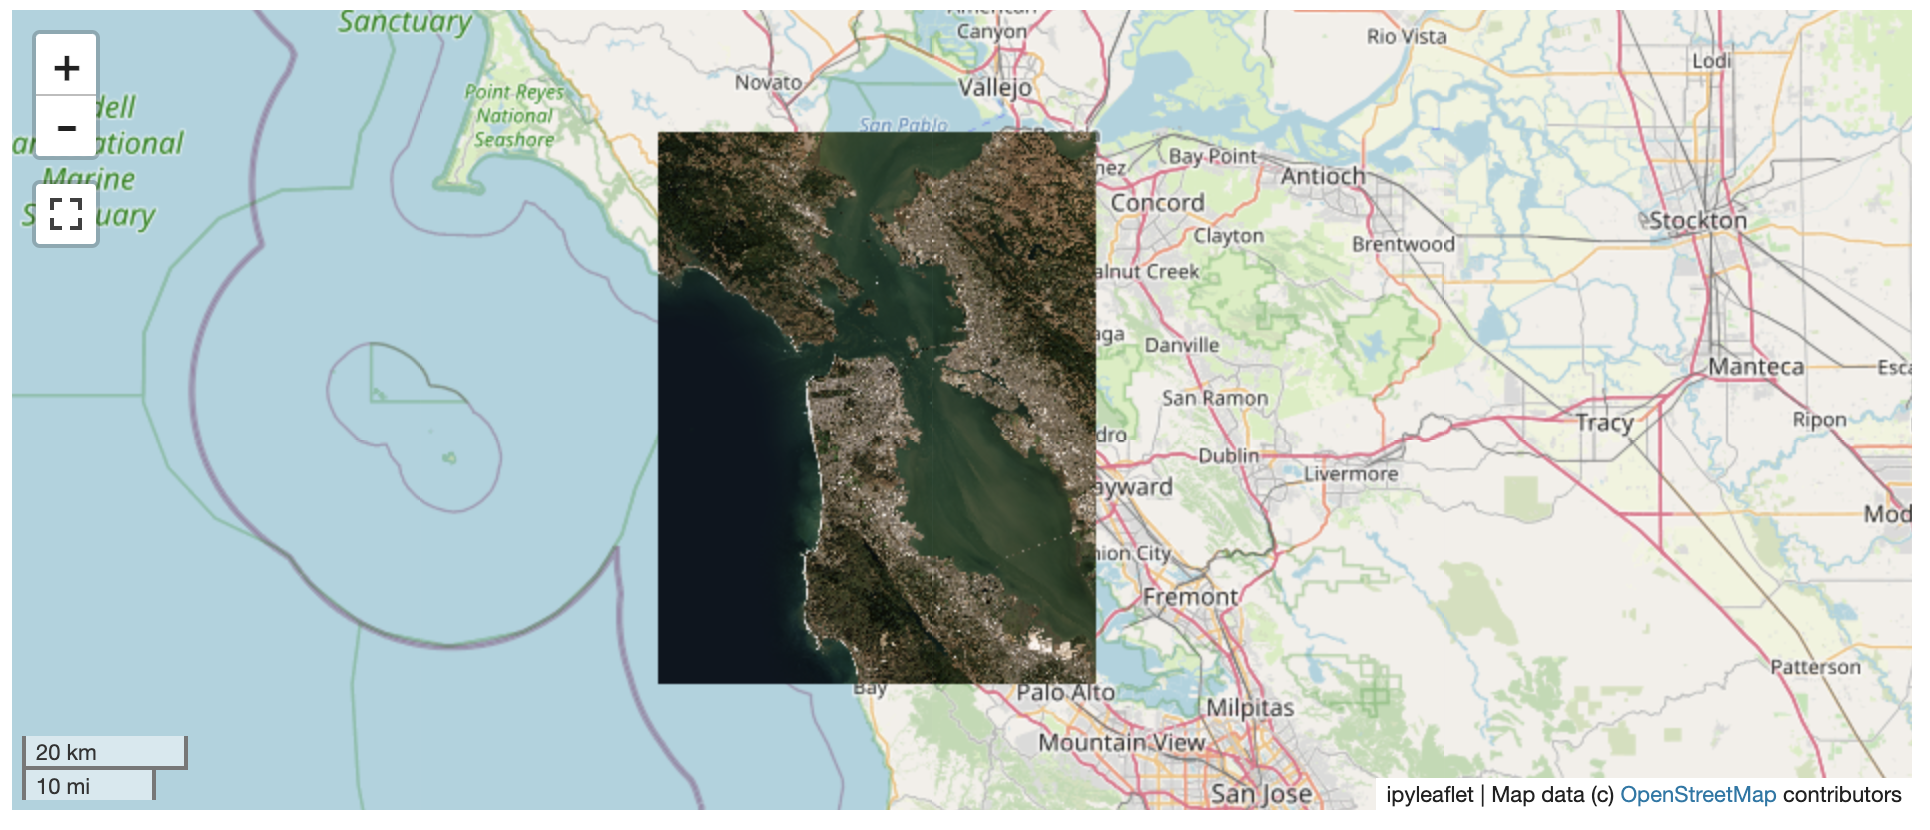
The TileClient class can be used to to launch a tile server in a background thread which will serve raster imagery to a viewer (usually ipyleaflet or folium in Jupyter notebooks).

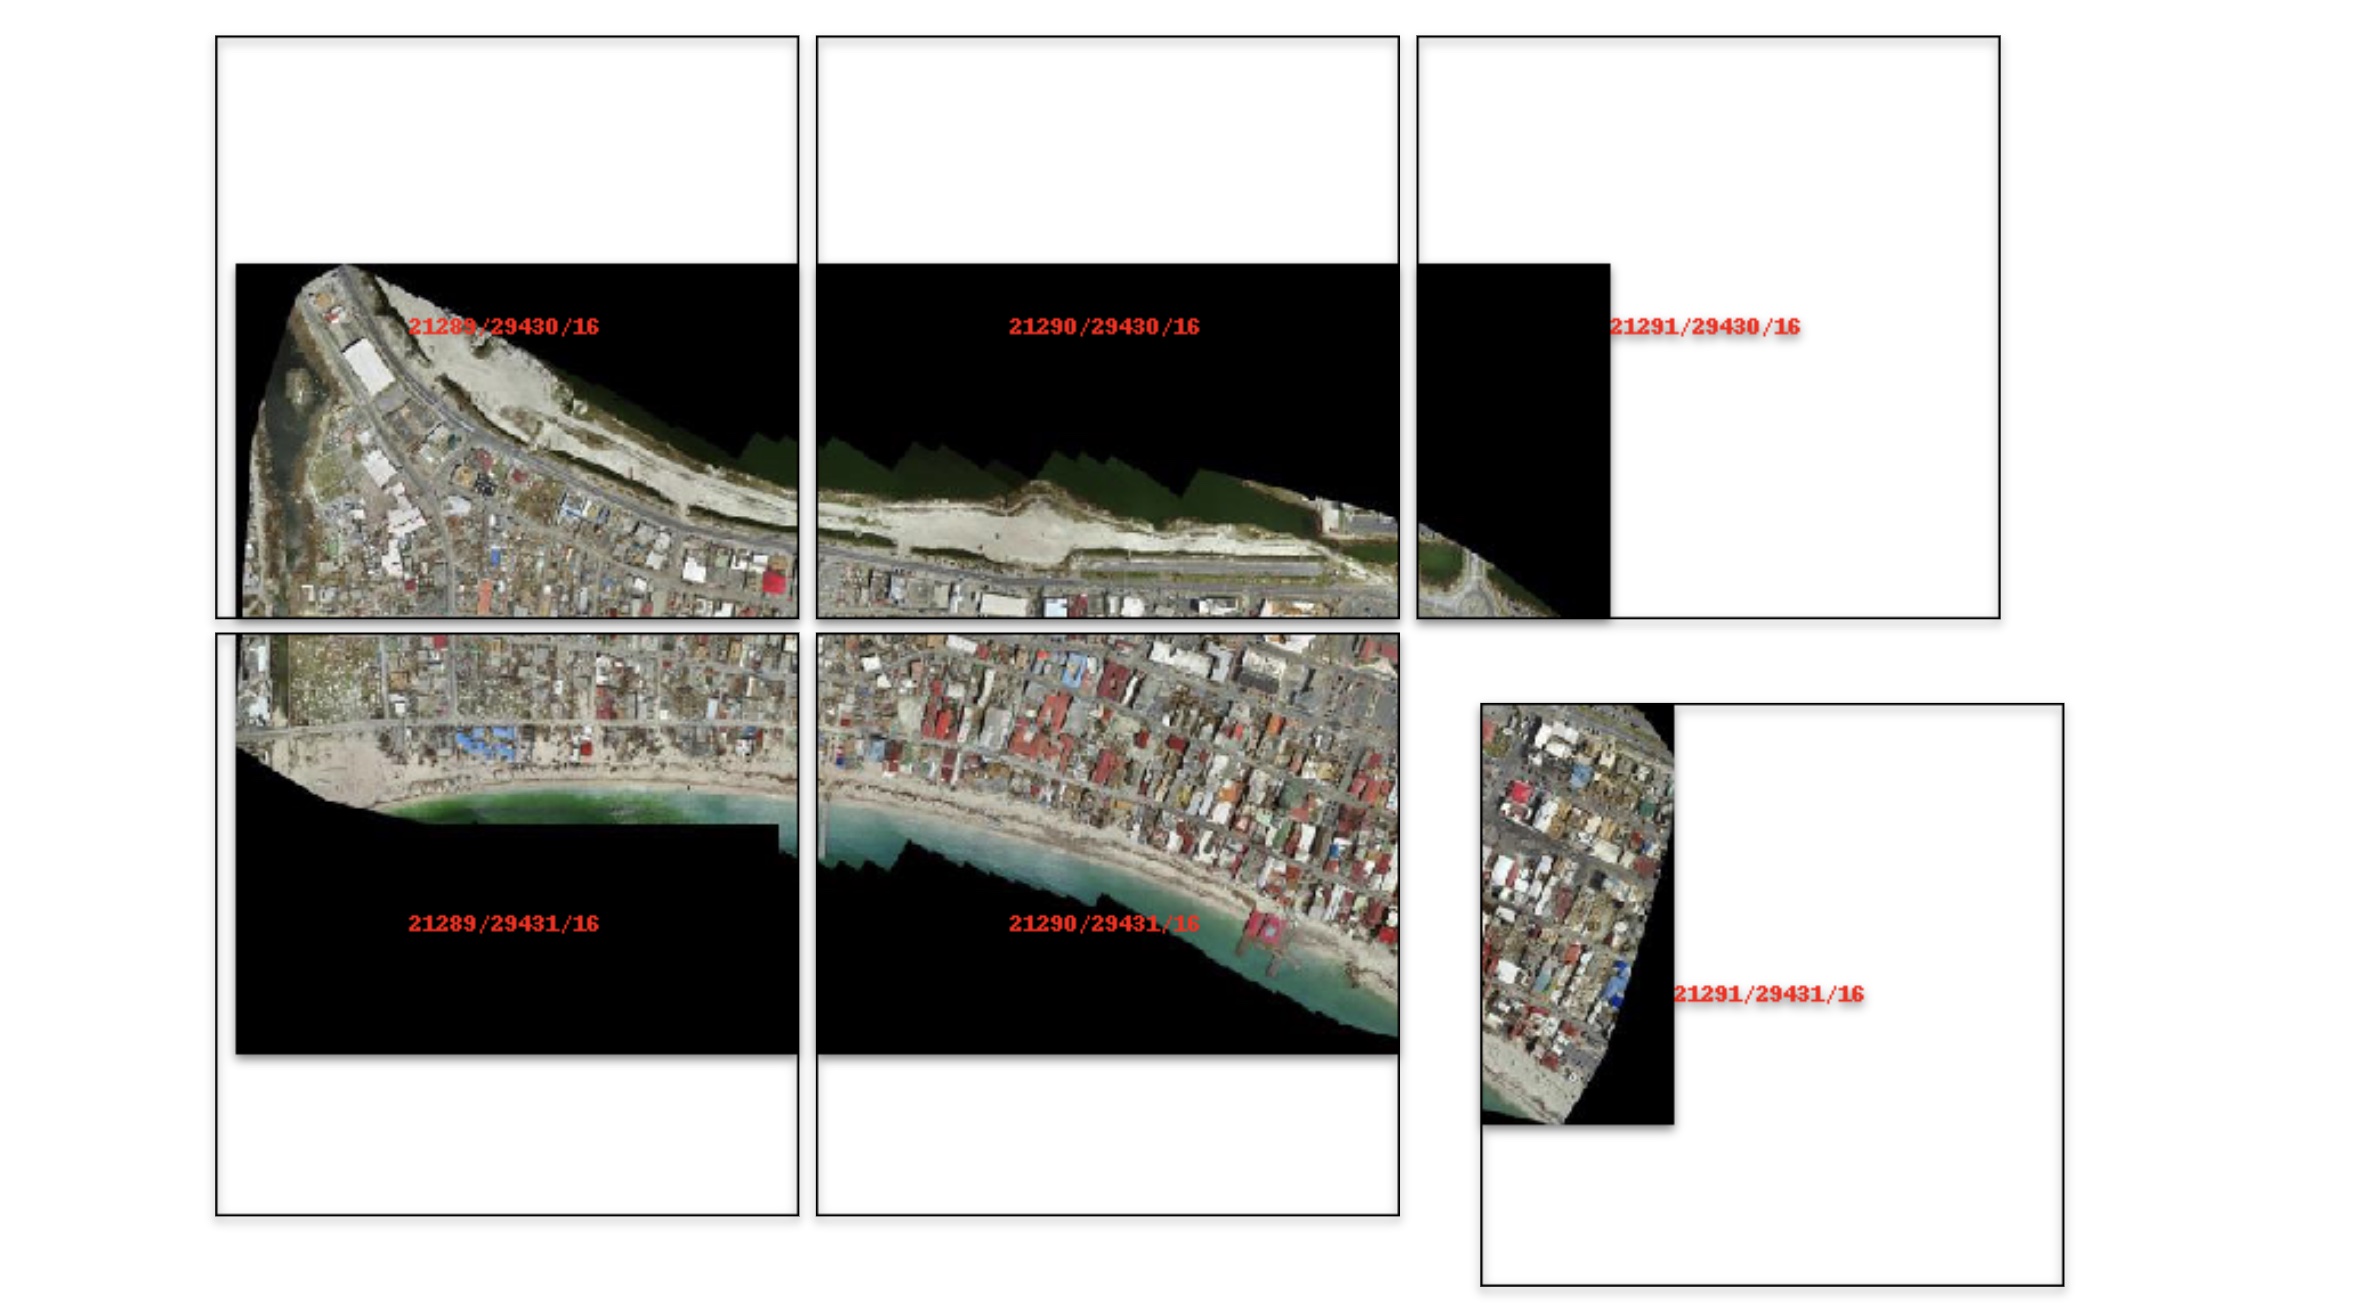
This tile server can efficiently deliver varying resolutions of your raster imagery to your viewer; it helps to have pre-tiled, Cloud Optimized GeoTIFFs (COGs).

There is an included, standalone web viewer leveraging CesiumJS.

โฌ‡๏ธ Installation

Get started with localtileserver to view rasters in Jupyter or deploy as your own Flask application.

๐Ÿ Installing with conda

Conda makes managing localtileserver's dependencies across platforms quite easy and this is the recommended method to install:

conda install -c conda-forge localtileserver

๐ŸŽก Installing with pip

If you prefer pip, then you can install from PyPI: https://pypi.org/project/localtileserver/

pip install localtileserver

๐Ÿ’ญ Feedback

Please share your thoughts and questions on the Discussions board. If you would like to report any bugs or make feature requests, please open an issue.

If filing a bug report, please share a scooby Report:

import localtileserver
print(localtileserver.Report())

localtileserver's People

Contributors

12rambau avatar banesullivan avatar dependabot[bot] avatar paolchol avatar richardscottoz avatar tjlogue4 avatar

Stargazers

 avatar  avatar  avatar  avatar  avatar  avatar  avatar  avatar  avatar  avatar  avatar  avatar  avatar  avatar  avatar  avatar  avatar  avatar  avatar  avatar  avatar  avatar  avatar  avatar  avatar  avatar  avatar  avatar  avatar  avatar  avatar  avatar  avatar  avatar  avatar  avatar  avatar  avatar  avatar  avatar  avatar  avatar  avatar  avatar  avatar  avatar  avatar  avatar  avatar  avatar  avatar  avatar  avatar  avatar  avatar  avatar  avatar  avatar  avatar  avatar  avatar  avatar  avatar  avatar  avatar  avatar  avatar  avatar  avatar  avatar  avatar  avatar  avatar  avatar  avatar  avatar  avatar  avatar  avatar  avatar  avatar  avatar  avatar  avatar  avatar  avatar  avatar  avatar  avatar  avatar  avatar  avatar  avatar  avatar  avatar  avatar  avatar  avatar  avatar  avatar

Watchers

 avatar  avatar  avatar  avatar  avatar  avatar  avatar  avatar  avatar  avatar  avatar  avatar

localtileserver's Issues

Add package to conda-forge

Thank you for developing this nice package. I just tested it on my computer, and it works like a charm! I plan to incorporate the package into geemap and leafmap. Would you consider making the package available on conda-forge? Thanks.

Bokeh tile server

I'd like to use localtileserver in conjunction with bokeh, though I'm not having luck. Ideally, I'd like to spin up a bokeh server, though I haven't had luck within jupyter either. I suspect this is related to 66, just not sure exactly how to point bokeh to the tiles served up by this repo.

Testing

Add some basic tests to make sure we can launch multiple tile servers under the same process and that there is no overlapping in caching.

Additionally, make sure to have a Windows runner

AttributeError: 'Map' object has no attribute 'add_child'

I am trying to run the minimal example and getting this error. Maybe I am missing something big.
Screen Shot 2022-03-30 at 8 14 15 AM

Report:

Date: Tue Mar 29 23:20:12 2022 UTC

                 OS : Linux
             CPU(s) : 8
            Machine : x86_64
       Architecture : 64bit
                RAM : 31.4 GiB
        Environment : Jupyter

  Python 3.8.10 (default, Nov 26 2021, 20:14:08)  [GCC 9.3.0]

    localtileserver : 0.4.4
              flask : 2.1.0
      flask_caching : 1.10.1
        flask_restx : 0.5.1
           requests : 2.27.1
           werkzeug : 2.0.3
              click : 8.0.4
             scooby : 0.5.12
        large_image : 1.12.0
large_image_source_gdal : 1.12.0
         cachetools : 5.0.0
                PIL : 9.0.1
             psutil : 5.9.0
              numpy : 1.22.3
         palettable : 3.3.0
             pyproj : 3.3.0
         osgeo.gdal : 3.0.4
         ipyleaflet : 0.15.0
          traitlets : 5.1.1
            shapely : 1.8.1.post1
             folium : 0.12.1.post1
         matplotlib : 3.5.1

could BoundTileLayer be declared outside of the function ?

In one of my application, I'm scrolling in the layers displayed on my map and performed different operations depeding on where there from. The only way I can make the differents between something comming from localtileserver and another TileLayer is the type. In

class BoundTileLayer(TileLayer):
you are using the BoundTileLayer for your layer. it's quite hoard to reach for a simple isinstance test. would it be possible to set it as a standalone class in localtileserver.widget ?

Improve support for online COG

Based on the example datasets, it seems an XML file is needed to render COG hosted online. Any guidelines on how you created the XML file? It would be awesome if a tile client can be created the same way for both local and online COG files.

Ideally, something like this:

url = 'https://opendata.digitalglobe.com/events/california-fire-2020/pre-event/2018-02-16/pine-gulch-fire20/1030010076004E00.tif' 
tile_client = TileClient(url)

I used to rely on titiler to render online COGs. I am considering switching to localtileserver to support both local and online COGs.

https://leafmap.org/notebooks/03_cog_stac/

import leafmap
m = leafmap.Map()
url = 'https://opendata.digitalglobe.com/events/california-fire-2020/pre-event/2018-02-16/pine-gulch-fire20/1030010076004E00.tif'
m.add_cog_layer(url)
m

support streamlit

Since streamlit is unwilling to support jupyter-server-proxy, would it make sense to add a function in localtileserver that can modify the two files in streamlit as you did in this streamlit PR? If not, I can add a function to in leafmap to support this. I would love to able to use localtileserver with streamlit.

Very slow on Windows

I noticed that localtileserver is very slow on Windows. It took ~13 seconds to generate tiles for this very small GeoTIFF (14 MB). It used to be very fast on Linux. I am not sure what causes the issue.

Animation

from localtileserver import get_leaflet_tile_layer, TileClient
from ipyleaflet import Map

# First, create a tile server from local raster file
client = TileClient('srtm90.tif')

# Create ipyleaflet tile layer from that server
t = get_leaflet_tile_layer(client)

m = Map(center=client.center(), zoom=client.default_zoom)
m.add_layer(t)
m

env

--------------------------------------------------------------------------------
  Date: Wed Aug 03 16:17:46 2022 Eastern Daylight Time

                     OS : Windows
                 CPU(s) : 16
                Machine : AMD64
           Architecture : 64bit
                    RAM : 31.7 GiB
            Environment : Jupyter

  Python 3.10.4 | packaged by conda-forge | (main, Mar 30 2022, 08:38:02) [MSC
  v.1916 64 bit (AMD64)]

        localtileserver : 0.5.11
                  flask : 2.1.3
          flask_caching : 1.10.1
             flask_cors : 3.0.10
            flask_restx : 0.5.1
               requests : 2.28.1
               werkzeug : 2.1.2
                  click : 8.1.3
          server_thread : 0.2.0
                 scooby : 0.5.12
            large_image : 1.15.1
large_image_source_gdal : 1.15.1
             cachetools : 4.2.4
                    PIL : 9.2.0
                 psutil : 5.9.1
                  numpy : 1.23.1
             palettable : 3.3.0
                 pyproj : 3.3.1
             osgeo.gdal : 3.4.2
             ipyleaflet : 0.17.0
             jupyterlab : 3.4.4
              traitlets : 5.3.0
                shapely : 1.8.2
                 folium : 0.12.1.post1
             matplotlib : 3.5.2
--------------------------------------------------------------------------------

Projection and nodata issues with geotiff

Hi @banesullivan,

Apologies for hijacking someone else's issue. I thought it was related.

I am having the No available tilesource issue. To give you the background, I am trying to load a Satellite image on a map using Jupyter Notebook. I am using the following piece of code:

from localtileserver import get_leaflet_tile_layer, TileClient
tile_client = TileClient(image_path)
get_leaflet_tile_layer(tile_client)

Full stack trace:

[2022-01-18 16:41:14,725] ERROR in app: Exception on /api/metadata [GET]
Traceback (most recent call last):
File "C:\ProgramData\Anaconda3\envs\geo_env\lib\site-packages\flask\app.py", line 1516, in full_dispatch_request
rv = self.dispatch_request()
File "C:\ProgramData\Anaconda3\envs\geo_env\lib\site-packages\flask\app.py", line 1502, in dispatch_request
return self.ensure_sync(self.view_functions[rule.endpoint])(**req.view_args)
File "C:\ProgramData\Anaconda3\envs\geo_env\lib\site-packages\flask_restx\api.py", line 403, in wrapper
resp = resource(*args, **kwargs)
File "C:\ProgramData\Anaconda3\envs\geo_env\lib\site-packages\flask\views.py", line 84, in view
return current_app.ensure_sync(self.dispatch_request)(*args, **kwargs)
File "C:\ProgramData\Anaconda3\envs\geo_env\lib\site-packages\flask_restx\resource.py", line 49, in dispatch_request
resp = meth(*args, **kwargs)
File "C:\ProgramData\Anaconda3\envs\geo_env\lib\site-packages\flask_caching_init_.py", line 475, in decorated_function
rv = f(*args, **kwargs)
File "C:\ProgramData\Anaconda3\envs\geo_env\lib\site-packages\localtileserver\tileserver\rest.py", line 147, in get
tile_source = self.get_tile_source()
File "C:\ProgramData\Anaconda3\envs\geo_env\lib\site-packages\localtileserver\tileserver\rest.py", line 141, in get_tile_source
return utilities.get_tile_source(filename, projection, style=sty)
File "C:\ProgramData\Anaconda3\envs\geo_env\lib\site-packages\localtileserver\tileserver\utilities.py", line 74, in get_tile_source
return large_image.open(str(path), projection=projection, style=style, encoding="PNG")
File "C:\ProgramData\Anaconda3\envs\geo_env\lib\site-packages\large_image\tilesource_init_.py", line 143, in open
return getTileSource(*args, **kwargs)
File "C:\ProgramData\Anaconda3\envs\geo_env\lib\site-packages\large_image\tilesource_init_.py", line 131, in getTileSource
return getTileSourceFromDict(AvailableTileSources, *args, **kwargs)
File "C:\ProgramData\Anaconda3\envs\geo_env\lib\site-packages\large_image\tilesource_init_.py", line 119, in getTileSourceFromDict
raise TileSourceError('No available tilesource for %s' % pathOrUri)
large_image.exceptions.TileSourceError: No available tilesource for P:\Boliden\Data\014050240020_01\output\20MAR30103630-M2AS-014050240020_01_P001_calibrated_QUAC_byte.tif


HTTPError Traceback (most recent call last)
C:\Users\PRITIM~1\AppData\Local\Temp/ipykernel_11608/4220505374.py in
----> 1 geo_jsons = display_map(center, image_overlay=rgb_byte, text = "Draw Water/Vagitation ROIs")

P:\Boliden\notebooks\utils\display_map.py in display_map(center, zoom, image_overlay, text)
44 tile_client = TileClient(image_overlay)
45 # Create ipyleaflet tile layer from that server
---> 46 t = get_leaflet_tile_layer(tile_client)
47
48 # Add custom text widget on the map

C:\ProgramData\Anaconda3\envs\geo_env\lib\site-packages\localtileserver\widgets.py in get_leaflet_tile_layer(source, port, debug, projection, band, palette, vmin, vmax, nodata, attribution, **kwargs)
77 bounds = Union((Tuple(),), default_value=None, allow_none=True).tag(sync=True, o=True)
78
---> 79 source, created = get_or_create_tile_client(source, port=port, debug=debug)
80 url = source.get_tile_url(
81 projection=projection,

C:\ProgramData\Anaconda3\envs\geo_env\lib\site-packages\localtileserver\client.py in get_or_create_tile_client(source, port, debug, threaded, processes)
348 source.shutdown()
349 del source
--> 350 raise e
351 return source, _internally_created

C:\ProgramData\Anaconda3\envs\geo_env\lib\site-packages\localtileserver\client.py in get_or_create_tile_client(source, port, debug, threaded, processes)
342 try:
343 r = requests.get(source.create_url("api/metadata"))
--> 344 r.raise_for_status()
345 except requests.HTTPError as e:
346 # Make sure to destroy the server and its thread if internally created.

C:\ProgramData\Anaconda3\envs\geo_env\lib\site-packages\requests\models.py in raise_for_status(self)
958
959 if http_error_msg:
--> 960 raise HTTPError(http_error_msg, response=self)
961
962 def close(self):

HTTPError: 500 Server Error: INTERNAL SERVER ERROR for url: http://localhost:58429/api/metadata?&filename=P%3A%5CBoliden%5CData%5C014050240020_01%5Coutput%5C20MAR30103630-M2AS-014050240020_01_P001_calibrated_QUAC_byte.tif

localtileserver.report():

Date: Tue Jan 18 16:39:09 2022 GMT Standard Time

                 OS : Windows
             CPU(s) : 32
            Machine : AMD64
       Architecture : 64bit
                RAM : 63.9 GiB
        Environment : Jupyter
        File system : unknown

       Python 3.10.1 | packaged by conda-forge | (main, Dec 22 2021, 01:33:54) [MSC
       v.1929 64 bit (AMD64)]

    localtileserver : 0.4.0
              flask : 2.0.2
      flask_caching : 1.10.1
        flask_restx : 0.5.1
           requests : 2.27.1
           werkzeug : 2.0.1
              click : 8.0.3
             scooby : 0.5.11
        large_image : 1.9.0
        large_image_source_gdal : 1.9.0
         cachetools : 5.0.0
                PIL : 8.4.0
             psutil : 5.9.0
              numpy : 1.22.0
         palettable : 3.3.0
             pyproj : 3.3.0
         osgeo.gdal : 3.4.1
         ipyleaflet : 0.15.0
          traitlets : 5.1.1
            shapely : 1.8.0
             folium : 0.12.1.post1
         matplotlib : 3.5.1

Thanks.

Extend to fix ImageOverlay, too?

Thank you! This repo looks very promising, indeed, and gives me hope to work around jupyter-widgets/ipyleaflet#234! Is there any chance to extend this to load ImageOverlays also from local files and/or memory, like mentioned in that issue's title? That would allow to refresh the image inside an ImageOverlay which should work with this approach, too.

get_leaflet_tile_layer error (v0.3.13)

Both v0.3.13 and the GitHub source throws the same error when using the example. v0.3.12 works fine.

from localtileserver import get_leaflet_tile_layer, TileClient
from ipyleaflet import Map

# First, create a tile server from local raster file
tile_client = TileClient('~/Downloads/dem.tif')

# Create ipyleaflet tile layer from that server
t = get_leaflet_tile_layer(tile_client)

# Create ipyleaflet map, add tile layer, and display
m = Map(center=tile_client.center())
m.add_layer(t)
m

v0.3.13
image

v0.3.12
image

Add support for Google Colab

Now localtileserver is working with JupyterHub. It would be nice to also make it compatible with Colab. The following two lines have no effect on Colab as it is not a JupyterHub.

import os
os.environ['LOCALTILESERVER_CLIENT_PREFIX'] = f"{os.environ['JUPYTERHUB_SERVICE_PREFIX'].lstrip('/')}/proxy/{{port}}"

caching is broken

TypeError: can only concatenate str (not "bytes") to str
  File "__init__.py", line 380, in decorated_function
    rv = self.cache.get(cache_key)
  File "cachelib/memcached.py", line 79, in get
    key = self._normalize_key(key)
  File "cachelib/memcached.py", line 69, in _normalize_key
    key = self.key_prefix + key

i think this an issue with flask-caching

add support for custom matplotlib colormap

When displaying single band imagery specifically categorical maps, sometimes you need a very specific color classification with value-color pairs. In the current implementation, only a list of hex colors or a colormap name can be used. would you like to add support for customized matplotlib colormap?

What if `TileClient` was a wrapping of a `rasterio` dataset?

What if the parent class for TileClient (well BaseTileClient really) was rasterio.io.DatasetReaderBase?

This would make it possible to use rasterio and localtileserver interchangeable (kind of like PyVista's wrapping of VTK ๐Ÿ˜‰ ).

Just a thought... I may play around with this and see what it could look like / how it could work.

Support band selection for multi-spectral imagery

The band parameter of get_leaflet_tile_layer() is an integer type. I would suggest adding support for band selection when there are more than 3 bands, e.g., band=[4, 3, 2]

Sample dataset: landsat.tif (7 bands)

from localtileserver import get_leaflet_tile_layer, TileClient
from ipyleaflet import Map

url = "/home/qiusheng/Downloads/landsat.tif"
# First, create a tile server from local raster file
tile_client = TileClient(url)

# Create ipyleaflet tile layer from that server
t = get_leaflet_tile_layer(tile_client)

# Create ipyleaflet map, add tile layer, and display
m = Map(center=tile_client.center())
m.add_layer(t)
m

image

In QGIS
image

palette -> cmap

I'm thinking of changing the term palette to cmap in the Python interface to be consistent with PyVista, matplotlib, etc.

send_file() got an unexpected keyword argument 'download_name'

I am testing it with a local GeoTIFF (download here) and got the following error. The tile does not show up on the map.

from localtileserver import get_leaflet_tile_layer, TileClient
from ipyleaflet import Map

url = "/home/qiusheng/Downloads/landsat.tif"
# First, create a tile server from local raster file
tile_client = TileClient(url)

# Create ipyleaflet tile layer from that server
t = get_leaflet_tile_layer(tile_client)

# Create ipyleaflet map, add tile layer, and display
m = Map(center=tile_client.center())
m.add_layer(t)
m

image

Look into `PytestUnraisableExceptionWarning` during tests

  /opt/hostedtoolcache/Python/3.9.9/x64/lib/python3.9/site-packages/_pytest/unraisableexception.py:78: PytestUnraisableExceptionWarning: Exception ignored in: <function TileServerThread.__del__ at 0x7fb88d4b2550>
  
  Traceback (most recent call last):
    File "/home/runner/work/localtileserver/localtileserver/localtileserver/server.py", line 122, in __del__
      self.shutdown()
    File "/home/runner/work/localtileserver/localtileserver/localtileserver/server.py", line 118, in shutdown
      if self.is_alive():
    File "/opt/hostedtoolcache/Python/3.9.9/x64/lib/python3.9/threading.py", line 1134, in is_alive
      assert self._initialized, "Thread.__init__() not called"
  AssertionError: Thread.__init__() not called
  
    warnings.warn(pytest.PytestUnraisableExceptionWarning(msg))

To do:

  • What test is causing this issue?
  • What code in that test is problematic?
  • Is this serious?
  • Can this be resolved?

Local cache can grow large quickly

There should be some sort of automated cleanup of the cache directory.

Also note that when extracting ROIs, the server will save that to a file in the temp directory, then serve that file over HTTP to the client to be saved again in the same temp directory. There should be a way to pass that filename to the Python client (though this wouldn't work if accessing from a remote machine... but I don't really intend for people to use this in that manner)

vmin and vmax

How are vmin and vmax determined when plotting a single band with vmin=None and vmax=None? Are they derived from TileClient.metadata()["bands"] when users do not specify the values?

From the documentation, it seems vmin and vmax only support single-band imagery. How about multi-band imagery?

image

When plotting multi-band imagery using titiler, I use the percentile_2 and percentile_98 as the default vmin and vmax.
https://github.com/giswqs/leafmap/blob/8bd65d9b42c0629d60b55f194d7e50ec04d9162a/leafmap/common.py#L979-L983

https://leafmap.org/notebooks/37_planetary_computer/
image

Add a utility to the Report that will help decipher if a user is in a "remote" environment

Users are regularly running into issues setting up/using localtileserver in remote environments -- whether by running Jupyter on a remote server or within an isolated network on their own device (e.g., within Docker).

I'm thinking that there might be a way to provide a surface-level test as to whether the user is in one of these scenarios. It would be nice to provide a utility method that would try to do this deciphering and then include that as additional metadata for this package's scooby report. That way, when a user has an issue, they can include a scooby report that would include something like:

remote status : likely JupyterHub

with maybe a few possible scenarios:

  • likely JupyterHub
  • Isolated network
  • Unknown
  • Running locally

--no-depends option for RemoteTileClient

Is there a way in which we can safely use RemoteTileClient without installing/importing some of the heavier dependencies like large_image, flask, etc?

I'd rather not ship a separate package for this, so perhaps there is a way to have something like:

from localtileserver.remote import RemoteTileClient

That can be used without installing all the dependencies

Extract roi issue

I was testing the extract_roi() function using the sample bahamas_rgb.tif. It seems the extracted image does not match the bounding box. Is this a bug?

client.extract_roi(-77.9425, -77.4701, 23.8959, 24.2019)

image

image

localtileserver with streamlit

I created an interactive streamlit web app for visualizing local and remote COG based on localtileserver and leafmap. The web app works fine when running locally. However, when deployed to Streamlit Cloud, the tile layer won't show up. I turned on the debug mode and found that the app in streamlit cloud is missing GET /tiles/. See the screenshots and video demo below. Any advice? Thanks.

Web App: https://share.streamlit.io/giswqs/streamlit-geospatial/app.py?page=Visualize+Raster+Data
Source code: https://github.com/giswqs/streamlit-geospatial/blob/master/apps/raster.py

The app running on Streamlit Cloud (missing GET /tiles/ ) - layer not shown up
image

The app running locally (with GET /tiles/ ) - layer shown up correctly
image

local_tile.mp4

Documentation

The README is getting too long for my taste and many things are not included at this point. I think it's time to make dedicated documentation for this project. Here is a rough outline:

  1. Overview
  2. Installation
  3. User Guide
    i. Basic Usage (Jupyter notebooks with ipyleaflet/folium) - Demo all features of TileClient (e.g. ROI extraction)
    ii. Command line usage with web application
    iii. Using the pre-built Docker image with web application
    iv. Using the Flask Blueprint in custom web applications
  4. API Documentation (standard API docs and explain how it all works under the hood)

add `api/` prefix to API URLs

The next minor version (v0.4.x) will rename many of the URLs for the API. e.g. /tiles/{z}/{x}/{y}.png -> /api/tiles/{z}/{x}/{y}.png

Consider changing name to `localtileserver`

I'm considering changing the name to localtileserver all around. I.e., the repository, pip package, and import name would all be localtileserver. I think this name captures the intent of this package better than flask-tileserver.

I'm going to mull this over for a bit.

Thoughts @giswqs since I think you might be the only downstream user thus far?

Blocks #6

Make mobile friendly

The current web UI is not web friendly at all:

  • nav menu is hidden
  • opacity slider block cesium UI controls

Accessing localtileserver from remote Jupyter environment

The localtileserver works nicely locally. However, I have not been able to make it work in a cloud environment. I have tested it multiple cloud env without success, such as https://binder.pangeo.io, https://mybinder.org, https://streamlit.io/cloud and Google Colab. Below is the environment.yml I used to create the env. It would be nice to have a working env that users can launch a notebook to test localtileserver with a simple click.

name: tileserver
channels:
  - conda-forge
dependencies:
  - gdal=3.2.2
  - pip
  - pip:
      - geopandas
      - leafmap
      - localtileserver

What is minimum GDAL version?

I need to investigate what the minimum required version of GDAL is. There can be issues when serving datasets in certain projections under v3.3.x I think

For now, I'm going to recommend using v3.4 as that is what I am using

again a poor soul not managing to serve the tiles on remote server

I know that it's a known issue, I'm not here to says it doesn't work, but more to say I think I don't understand the wiring.

What I tried

As simple as it seems my objective wa to check if I can display the example image on a map:

from localtileserver import get_leaflet_tile_layer, examples
from ipyleaflet import Map, LayersControl

client = examples.get_landsat(client_host="sepal.io", debug=True)

style = {
  'bands': [
    {'band': 5, 'palette': '#f00'},
    {'band': 3, 'palette': '#0f0'},
    {'band': 2, 'palette': '#00f'},
  ]
}

l = get_leaflet_tile_layer(client, style=style, name="toto")

m = Map(center=client.center(), zoom=client.default_zoom)
m.add_layer(l)
m.add_control(LayersControl())
m

As many before me I have the tile of the basemap but I don't see the "toto" layer.

status

https://sepal.io/api/tiles/10/191/384.png?&filename=/home/prambaud/.local/lib/python3.8/site-packages/localtileserver/tileserver/data/landsat.tif&style=%7B%22bands%22%3A%20%5B%7B%22band%22%3A%205%2C%20%22palette%22%3A%20%22%23f00%22%7D%2C%20%7B%22band%22%3A%203%2C%20%22palette%22%3A%20%22%230f0%22%7D%2C%20%7B%22band%22%3A%202%2C%20%22palette%22%3A%20%22%2300f%22%7D%5D%7D&projection=EPSG:3857

image

I don't want to write down many information that would be useless so I prefer to ask
Do you have any idea why the tiles are not rendering ?
Is there extra information that could be of any use ?
Is there test from my side that I can performed ? (I tried to activate the debug mode but it didn't gave me lots of information)

technical report

--------------------------------------------------------------------------------
  Date: Tue Jun 07 13:07:22 2022 UTC

                     OS : Linux
                 CPU(s) : 2
                Machine : x86_64
           Architecture : 64bit
                    RAM : 1.9 GiB
            Environment : Jupyter

  Python 3.8.10 (default, Mar 15 2022, 12:22:08)  [GCC 9.4.0]

        localtileserver : 0.5.8
                  flask : 2.1.2
          flask_caching : 1.11.1
             flask_cors : 3.0.10
            flask_restx : 0.5.1
               requests : 2.27.1
               werkzeug : 2.1.1
                  click : 8.1.3
          server_thread : 0.1.0
                 scooby : 0.5.12
            large_image : 1.14.5
large_image_source_gdal : 1.14.5
             cachetools : 4.2.4
                    PIL : 9.1.0
                 psutil : 5.5.1
                  numpy : 1.22.3
             palettable : 3.3.0
                 pyproj : 3.3.1
             osgeo.gdal : 3.4.0
               gunicorn : 20.1.0
             ipyleaflet : 0.14.0
              traitlets : 5.1.1
                shapely : 1.8.1.post1
                 folium : 0.12.1.post1
             matplotlib : 3.5.2
--------------------------------------------------------------------------------

Switch to FastAPI

Flask has been giving me too many headaches lately, and I've been wanting to learn/use FastAPI.

I'm going to rewrite the internals of localtileserver to strip out flask and use fastapi. The average user will see not change in the Python API, but any projects using the flask blueprint (I think I'm the only person doing that) will no longer be supported.

When this lands, it will completely change the dependencies (hopefully making them lighter).

nodata issue

It seems the nodata parameter has no effect. No matter what nodata value is provided (e.g., -1), the tile will always treat 0 as nodata, resulting in some empty areas in the image.

from localtileserver import get_leaflet_tile_layer, TileClient
from ipyleaflet import Map

# First, create a tile server from local raster file
tile_client = TileClient('https://github.com/giswqs/data/raw/main/raster/landsat7.tif')

# Create ipyleaflet tile layer from that server
t = get_leaflet_tile_layer(tile_client, band=[1,2,3], nodata=-1)

# Create ipyleaflet map, add tile layer, and display
m = Map(center=tile_client.center())
m.add_layer(t)
m

image

image

Packaging with pyinstaller

Hello, I am using the localetileserver, and it is working but when I try to convert my py to exe the program shows me this error.

large_image.exceptions.TileSourceError: No available tilesource for C:\Users\iiMox\AppData\Local\Temp_MEI50602\NE1_LR_LC_SR_W_DR.tif

Recommend Projects

  • React photo React

    A declarative, efficient, and flexible JavaScript library for building user interfaces.

  • Vue.js photo Vue.js

    ๐Ÿ–– Vue.js is a progressive, incrementally-adoptable JavaScript framework for building UI on the web.

  • Typescript photo Typescript

    TypeScript is a superset of JavaScript that compiles to clean JavaScript output.

  • TensorFlow photo TensorFlow

    An Open Source Machine Learning Framework for Everyone

  • Django photo Django

    The Web framework for perfectionists with deadlines.

  • D3 photo D3

    Bring data to life with SVG, Canvas and HTML. ๐Ÿ“Š๐Ÿ“ˆ๐ŸŽ‰

Recommend Topics

  • javascript

    JavaScript (JS) is a lightweight interpreted programming language with first-class functions.

  • web

    Some thing interesting about web. New door for the world.

  • server

    A server is a program made to process requests and deliver data to clients.

  • Machine learning

    Machine learning is a way of modeling and interpreting data that allows a piece of software to respond intelligently.

  • Game

    Some thing interesting about game, make everyone happy.

Recommend Org

  • Facebook photo Facebook

    We are working to build community through open source technology. NB: members must have two-factor auth.

  • Microsoft photo Microsoft

    Open source projects and samples from Microsoft.

  • Google photo Google

    Google โค๏ธ Open Source for everyone.

  • D3 photo D3

    Data-Driven Documents codes.