d3 / d3-contour Goto Github PK
View Code? Open in Web Editor NEWCompute contour polygons using marching squares.
Home Page: https://d3js.org/d3-contour
License: ISC License
Compute contour polygons using marching squares.
Home Page: https://d3js.org/d3-contour
License: ISC License
Hello,
I would like that cellSize(0.5) would work well in d3.contourDensity().
Because I'm not satisfied cellSize(1) when confirming the following angulated example:
const contourDensity = d3.contourDensity()
		    .x(d => d.x)
		    .y(d => d.y)
		    .size([width, height])
		    .cellSize(1)
		    .bandwidth(1)
		    .thresholds(10);
When smoothing flag is true, contours removes the line segments and only leaves closed polygons. Is it possible to define he smoothing algorithm?
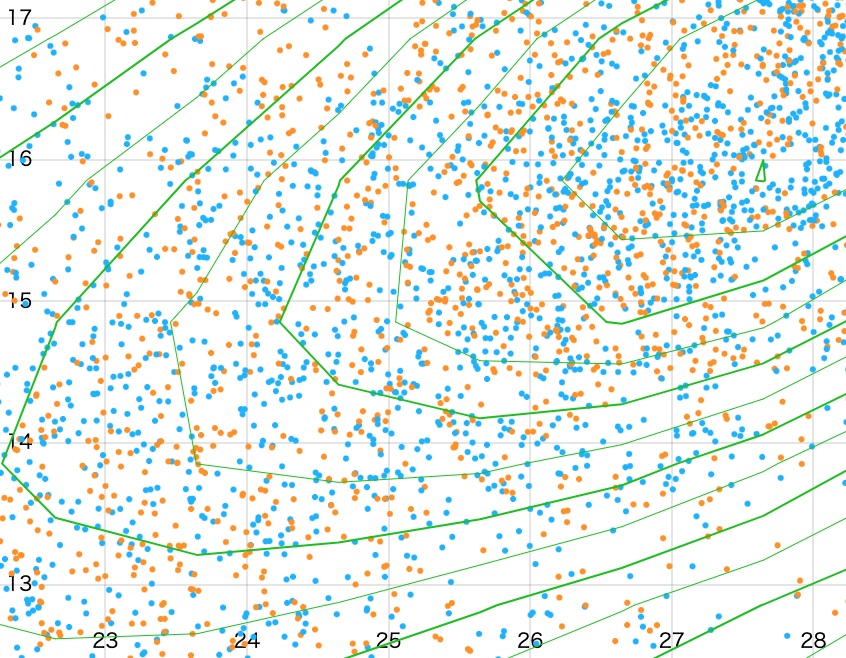
I want to draw arrows using elevation value in contours like below screenshot.

Please help me on it if anyone can do it.
Thanks so much.
It’d be nice to have a CLI, say taking GeoJSON points as input and producing GeoJSON polygons as output.
Hi,
I am trying to use your library (with THREE.js).
I tried to run the example javascript code inside an HTML file with the line:
<script src="https://d3js.org/d3-contour.v1.min.js"></script>At the line:
var contours = d3.contours()
.size([n, m])
.thresholds(d3.range(2, 21).map(p => Math.pow(2, p)))
(values);
I got the error message: "TypeError: d3.range is not a function".
I guess I need to link another library?
Like here:

A quick guess on how you could do it: create a coarse grid, bin the points into the grid, blur the grid, and then compute the contours. The grid size and the blur radius should presumably be configurable.
It would be great to add an option for entering weighted points in the density function. I think it would just be a matter of having a weight function that passes in the weights for each data point and adjusting line 35 accordingly:
values0[xi + yi * n] = values0[xi + yi * n] + weight(d, i, data);
default could be 1.
In the documentation and in the blocks examples the size property of the contour generator created by d3.contours() is set such as [n, m] where n*m is equal to length of the input array used with the contour object.
In the test file the input array counts 110 values but the size used is [10, 10].
Is it voluntary ? Or I am missing something ?
Even if it won't change anything to the result, maybe it should be fixed (for clarity) either by removing the last line of the input array or either by using [10, 11] as input value for size ?
Is there any way to change kernel function of densityContour?
I would like to use Epanechnikov kernel, not the Gaussian kernel as documentation says. Any way to achieve this?
thanks.
I would like to be able to generate a specific number of contours without using nice thresholds. this would be useful to avoid problems like having no contour lines if the number of thresholds is set too low. See vega/vega-geo#4
How can I draw contour on a leaflet map when my data is like a 2d array of values:
Values[Lat][Long] = 3;
Can anybody help me here?
I generate geojson data using d3.contour, the data contains features of MultiPolygon. When I render it with fill layer, the small zoom it will merge, when I scale zoom, it will normal. Here is the example.
I found GeoJSON data has some continue and same coordinates, but I am not sure if it raised the error.
Like this:
var x = d3.scaleLinear().domain([-2, 2]).range([0, width]);
var y = d3.scaleLinear().domain([-3, 1]).range([height, 0]);
var values = new Array(width * height);
for (var j = 0.5, k = 0; j < height; ++j) {
  for (var i = 0.5; i < width; ++i, ++k) {
    values[k] = value(x.invert(i), y.invert(j));
  }
}
Or maybe simpler, externalizing the scales:
var values = new Array(width * height);
for (var j = 0.5, k = 0; j < height; ++j) {
  for (var i = 0.5; i < width; ++i, ++k) {
    values[k] = value(i, j);
  }
}
The tricky part is to remember to evaluate the function at the midpoints of the pixels rather than their top-left corner.
I have tried triagulation then generate a grid then used berycentric interpolation on the containing triangle plane. Would you like to include it in your examples?
http://bl.ocks.org/jackielii/d3523c9116e5d3b45ec3d8aa76fb1f57
Regards,

I think we need to special-case the segments that are added on the canvas edges, rather than treating it as if the virtual pixels surrounding the canvas were always excluded from the contour.
There are some rounded corner artifacts on the edge of the grid:

It’s much more visible with a coarser grid:

I think it’s because we assume that outside the grid, the value is effectively -Infinity (or NaN). It would be nicer if we simply repeated the edge value infinitely (like WebGL CLAMP_TO_EDGE) so that we got square corners.
/cc @Fil
I'm using this library to discretely compute polygons of swept areas for trucks and semi-trailers in the frontend of a web application.
It works really great, but computing the contour polygons of large images (> 1Megapixels) takes lots of time. For my specific case, at around with around 3MP I need ~10seconds and with 7MP I have to wait around 30seconds to compute the contour of a single-threshold area.
Profiling the code showed that the Array.concat at
Line 134 in 0606516
concat is constantly copying a large array just to prepend/append a small number of points.
Replacing this with a simple g.ring.push(...f.ring) improves the performance by 2 to 3 times. Using that push and a more fancy tree-building and flattening when the result is returned in the callback does even more to reduce the strain on the GC and speeds up my 7MP computation almost tenfold.
Though I'm not 100% sure if that change is correct or if the concat was required there for some edge case. Anyway, here is the change, are you interested in a PR?:
Hi guys,
We are updating our dependency on d3-contour from 3.0.1 to 4.0.2.
But, it looks like it's not backward compatible starting from 3.0.2.
The breaking change was introduced in PR#57 and published as a patch version (3.0.2)
In our application, we provide thresholds as a callback function which returns an array:
contourDensity().thresholds((densityValues) => someArrayOfThresholds)
Could you suggest, how to make it compatible with the latest version (4.0.2) of d3-contour?
Maybe we need to use some built-in function like thresholdFreedmanDiaconis, thresholdScott, thresholdSturges to make the density chart drawn correctly again?
As described in vega/vega#1149 , when d3-contour gets an empty data, it generates a very large dataset of unexpected values. See also @jheer 's comment. Thanks!
Sorry to bother you. I want using this in my project, but I did all my work with the V3 version. How can I using it ?
We currently emit one point per pixel in the grid, which leads to many extra coordinates along straight edges. For example this:
{
  "type": "MultiPolygon",
  "value": 0.5,
  "coordinates": [
    [
      [[6, 7.5], [6, 6.5], [6, 5.5], [6, 4.5], [6, 3.5], [5.5, 3], [4.5, 3],
       [3.5, 3], [3, 3.5], [3, 4.5], [3, 5.5], [3, 6.5], [3, 7.5], [3.5, 8],
       [4.5, 8], [5.5, 8], [6, 7.5]]
    ]
  ]
}
Could be reduce to this:
{
  "type": "MultiPolygon",
  "value": 0.5,
  "coordinates": [
    [
      [[6, 7.5], [6, 3.5], [5.5, 3], [3.5, 3], [3, 3.5], [3, 7.5], [3.5, 8], [5.5, 8], [6, 7.5]]
    ]
  ]
}I have grids with null values. Countour does not like null or undefined in the array of values. Any solutions? I can set the nulls to gridMin-1 and then set the threshold but i still Get steps down from the Larger than min values to gridMin.
When using dojo(AMD) in my project to require d3-contour.js as the local file, the browser has error like this:

Is it the problem of using AMD requiring d3-contour? Looking forward to your reply...
See https://github.com/d3/d3-contour/blob/master/src/density.js#L112
The code redundantly checks _0 for non-negativity, rather than checking both _0 and _1.
Hi, the build system for several systems, like Kibana and Wikimedia nodejs, packages the entire node_modules/ into a single file. I was inspecting my node_modules, and I noticed that d3-countour is 5.8MB, even though the code is only a few KB. I seriously doubt that the images, such as a 1.6MB animated volcano.gif, should be included, re-downloaded for every npm install, and published. Would it be possible to move it to a demo website instead? Thanks!!!
It would be wonderful to have a version of d3-contour that works with d3-array v2 to avoid multiple version issues in downstream projects. It looks like the package.json file would need to be updated to support multiple major versions. Thanks!
d3.contourDensity internally rounds the bandwidth:
Line 153 in 06f2cf1
It would be nice to avoid rounding here so that arbitrary bandwidths could be used. Maybe this is possible if we switch to using array-blur, @Fil?
Thanks for creating this great library! It saves me a lot of time!
I have applied it to create contours for precipitation data which is regional not global, and projected the contours onto orthogonal projection, but I found that the polygon insideness of some levels is reverse. In following figure, the left panel is wrong. Any idea why d3 draws this path with its insideness reverse? When not projected, there is no such problem.

...
var contours = d3Contour.contours().size([record.width, record.height])
                                   .smooth(false)
                                   .thresholds(record.colormap.domain)(record.rawData)
                                   // Change planar coordinates to spherical coordinates.
                                   .map(convertCoordinates)

svg.selectAll('path')
   .data(contours)
   .enter().append('path')
   .exit().remove()
svg.selectAll('path')
   .data(contours)
   .attr('d', path)
   .attr('transform', view.transform)
   .attr('fill', (d, i) => record.colormap.range[i])
   .attr('fill-rule', 'evenodd')
        .attr('value', d => d.value)

function convertCoordinates (d) {
  var e = Object.assign({}, d)
  e.coordinates = d.coordinates.map(polygon => {
    return polygon.map(ring => {
      return ring.map(point => {
        return [
          point[0] * record.grid.dlon + record.grid.startLon,
          point[1] * record.grid.dlat + record.grid.startLat
        ]
      })
    })
  })
  return e
}A convenience function for computing a single contour. Like this, but without clobbering contours.thresholds:
contours.contour = function(values, threshold) {
  return contours.thresholds([threshold])(values)[0];
};an isoband is the region between two thresholds; we offer them as an iterator in d3-tricontour, and they can be useful (e.g. riatelab/bertin#111; https://observablehq.com/@fil/tricontour-isobands; https://observablehq.com/@fil/spherical-isobands).
Algorithm: iterate over the contours in pairs, consider the upper's rings as holes to be distributed in the lower's rings.
I'm using d3-contour to draw beautiful chart recently. Most of the time it's fine.
But in this case: https://observablehq.com/@choukou/untitled
In hundreds of polygons, one is special

It's counterclockwise. That cause the whole screen green.
Would you give me some help?
I have an XY grid, with each cell address mapped to a specific GPS coordinate. After generating contours I see I get polygons with coordinates based on cell positions.
I guess for earth data where pixels are regular and bound by some projection system, I would be able to re-project back to map coordinates, but I can't easily do this with my irregular grid - I think I would need to interpolate every coordinate of the resulting polygon based on closest known real coordinates.
Would it be possible to update the API to allow for specifying coordinates along with a values array that the library then uses to calculate the resulting polygons? (I'm not sure if this makes sense as I don't know how the marching squares algorithm works)
If so, I would be happy to try contribute to this, although I would probably need some guidance!
I'm running into a peculiar problem when using contourDensity() to draw a rather basic density estimation around a set of points. It appears my contour lines are being "clipped"?


I closely followed this example, and my code does not differ by much. Here's my relevant code:
g.insert("g", "g")
    .attr("fill", "none")
    .attr("stroke", 'black')
    .attr("stroke-linejoin", "round")
    .selectAll("path")
    .data(contour.contourDensity()
        .x(function (d) { return d.fdx; })
        .y(function (d) { return d.fdy; })
        .bandwidth(80)
        .thresholds(3)
        (selectedNodesData))
    .enter().append("path")
    .attr("d", d3.geoPath())
    .attr("fill", function (d) { return '#eeeeee' })
Changing the .bandwidth() parameter makes the contours larger (extending beyond the above clip), but the new contours still clip at other positions.
Any suggestions welcomed, thank you!
Hey !
Its more a question than an issue : I am using this excellent librairy to produce contour line over elevation data PNG tiles. However, I'd like to produce my contour lines tile-based, so i work one tile at a time. The librairy produces polygones that i transform to multiLineString afterwards. But the problem remains that the line run along the border of the tiles (wich is to be expected). I am having a hard time finding a way to reduce the output to lines going from border to border, but not framing the tile. Any idea about how to get about it ? Cheers !
Currently we round data points to the nearest grid point before blurring. It would probably be better to apply linear interpolation to a 2×2 grid to the nearest grid points to the data point instead, something like this:
data.forEach(function(d, i, data) {
  var xi = (x(d, i, data) + o) * Math.pow(2, -k),
      yi = (y(d, i, data) + o) * Math.pow(2, -k);
  if (xi >= 0 && xi < n - 1 && yi >= 0 && yi < m - 1) {
    var x0 = Math.floor(xi),
        y0 = Math.floor(yi),
        xt = xi - x0,
        yt = yi - y0;
    values0[x0 + y0 * n] += (1 - xt) * (1 - yt);
    values0[x0 + 1 + y0 * n] += xt * (1 - yt);
    values0[x0 + 1 + (y0 + 1) * n] += xt * yt;
    values0[x0 + (y0 + 1) * n] += (1 - xt) * yt;
  }
});The option to show labels on the index contours would be very useful. Arcgis example
Starting from GeoTIFF Contours II (https://bl.ocks.org/mbostock/83c0be21dba7602ee14982b020b12f51), I have tested direct reading from netCDF files (the standard of all Climate Models from IPCC and all Earth System Modeling community). See https://github.com/PBrockmann/D3_netcdfjs and try netcdfjs_05.html
It sounds very promissing. So a great great thank for this d3.contour module !
In my dreams, I would also like to get a raster pixels rendering as in http://geoexamples.com/d3-raster-tools-docs/code_samples/raster-pixels-page.html but that is another story. Is there an official d3 to do that BTW ?
The problem with d3.countour in a geo context is that some contours at antemeridian line are shifted either up or down.
See:

The map get from netcdfjs_05.html is zoomable so the problem can clearly be seen.
I haven't been able to find where this shift comes from ?
Any help welcomed on this topic that could help a huge community.
E.g., if the domain is
[-149.76192742819748, 321.19300631539585]and 14 ticks are desired, then the estimated tick step is 50
tickStep(-149.76192742819748, 321.19300631539585, 14)and hence the resulting “niced” domain is
[-150, 250]which when passed to ticks as
ticks(-150, 250, 14)produces
[-140, -120, -100, -80, -60, -40, -20, 0, 20, 40, 60, 80, 100, 120, 140, 160, 180, 200, 220, 240]and notice that –140 is greater than the original minimum. Related d3/d3-scale#209
We should be using d3.nice instead. d3/d3-array#174
ticks(...nice(-149.76192742819748, 321.19300631539585, 14), 14)which produces
[-150, -100, -50, 0, 50, 100, 150, 200, 250, 300, 350]although we should drop any threshold greater than or equal to the maximum.
As discussed over at the Observable forum, it might be nice for the bandwidth to accept a 2-entry list or an object with x and y attributes or the like, especially since internally the implementation is already blurring separately in x and y directions.
I made a similar (worse) library some months ago: https://github.com/rveciana/raster-marching-squares
I don't find how to give d3-contour the geographical positions for the pixels, so it's possible to project the output isolines.
In GDAL they call it GeoTransform, which is simply the coordinates of the first pixel and the delta for each position in the x and y directions.
If a geotransform could be set, the output coordinates would be in lon/lat and a projected geo-path could be used.
An example using my old library and reading the data from a GeoTiff: http://bl.ocks.org/rveciana/bef48021e38a77a520109d2088bff9eb
what's the difference between this and conrec.js?
Thanks
the input list data which is long as 10000 only contains numbers as follow:
[
  -32768, 0, 1,
      13, 6, 7,
       8, 9
]
and the theshold is [0,1,2,3,4,5,6,7,8,9,10,11,12,13,14]
while the output polygons contains value 10/11/12.
the length of the output polygons which value is 10/11/12 is the same as the length of polygons which value is 9.
Is it a bug? how get the output without 10/11/12?
I got an issue that there are holes while drawing contours.
When i change size, it sometimes appears and sometimes disappears.

Please advise if anyone can help me out.
Thank you.
A declarative, efficient, and flexible JavaScript library for building user interfaces.
🖖 Vue.js is a progressive, incrementally-adoptable JavaScript framework for building UI on the web.
TypeScript is a superset of JavaScript that compiles to clean JavaScript output.
An Open Source Machine Learning Framework for Everyone
The Web framework for perfectionists with deadlines.
A PHP framework for web artisans
Bring data to life with SVG, Canvas and HTML. 📊📈🎉
JavaScript (JS) is a lightweight interpreted programming language with first-class functions.
Some thing interesting about web. New door for the world.
A server is a program made to process requests and deliver data to clients.
Machine learning is a way of modeling and interpreting data that allows a piece of software to respond intelligently.
Some thing interesting about visualization, use data art
Some thing interesting about game, make everyone happy.
We are working to build community through open source technology. NB: members must have two-factor auth.
Open source projects and samples from Microsoft.
Google ❤️ Open Source for everyone.
Alibaba Open Source for everyone
Data-Driven Documents codes.
China tencent open source team.