hadley / adv-r Goto Github PK
View Code? Open in Web Editor NEWAdvanced R: a book
Home Page: http://adv-r.hadley.nz
License: Other
Advanced R: a book
Home Page: http://adv-r.hadley.nz
License: Other


When viewing in Chrome, the section between the HTML exercises and LaTeX goal is indented (wrongly), and the first exercise in HTML asks to escape <!--.
When processing the Rmd in Rstudio, the indent is correct, and the exercise asks to escape the correct </.
This arises probably from a conflict between R Markdown and GitHub Flavored Markdown?
In the Optimizing Code chapter pause() is used in the examples of the Measuring Performance opening section but then it is defined in the much later section Parallelise.
In http://adv-r.had.co.nz/Documenting-functions.html , the author says "As well [[package level documentation|documenting-packages]] resources, every package should also have its own documentation page." in the section "Documenting packages".
But I cannot figure out where to add the package-wide document comments. Can you please figure which file we should add the package-wide comments?
i.e. find some common base functions and explain line-by-line how they work.
Missing example on page:
http://adv-r.had.co.nz/Functional-programming.html
After the text:
"We could write a closure to abstract this away:"
In Computing-on-the-language.rmd the section of Calling from another function has errors in the R output by giving the impression of using subset() where really an earlier version of subset2() is used.
Specifically in the debugging part:
> debugonce(subset)
> subscramble(mtcars, cyl == 4)
debugging in: subset(x, condition)
debug: {
    condition_call <- substitute(condition)
    r <- eval(condition_call, x)
    x[r, ]
}
this clearly actually uses a version of subset2() introduced at line 195. Trying it with standard subset() gives me
R> debugonce(subset)
R> subscramble(mtcars, cyl == 4)
debugging in: subset(x, condition)
debug: UseMethod("subset")
Browse[2]> n
Error in eval(expr, envir, enclos) : object 'cyl' not found
Of course this can be fixed with simply replacing subset() with subset2() throughout this first part of the section but then the problem then becomes that two further subset2()s were introduced (using parent.frame() and list2env()) between the definition of the example's subset2() and the example itself.
As per discussion today at masterR workshop
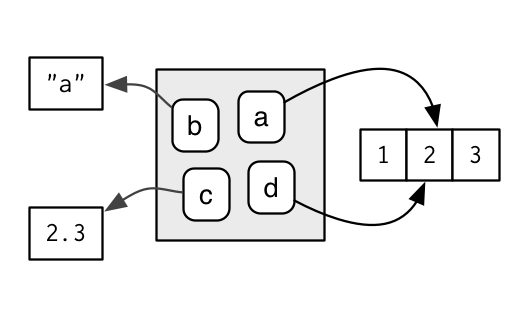
Under "Environment Basics", it says "multiple names can point to the same object." followed by a diagram that shows two names pointing to the same object.
The diagram shows a and d both pointing to the same object. But this suggests that they are both actually using the same object in memory. This can be disproved with either pryr::address(e$a) == pryr::address(e$d) (returning FALSE) or by doing e$a[1] <- 100; e$d; and seeing that the vector hasn't changed in d.
Maybe I'm just misinterpreting the diagram.
There have been several times when I was trying to remember something that I learned from the book, and I could only remember a keyword. What I do is I go to the book homepage and open all the chapters in different tabs and then "Find on page" until I find what I was looking for.
It would be nice IMO to maybe add search to the site. Google makes it very easy to add a Google Search to your site.
In the Vocabulary section, under Working with R/# Help, consider adding a reference to function help.start (starts R online documentation on your default browser).
In the "Package Basics" page several links appear between [[ | ]] rather than as links.
E.g. [[documenting packages]] [[namespaces]] [[unit tests|testing]].
I'm not sure if this is an inherit problem in bootstrap JS or if it's specific to this book-site.
When I render the site on a wide monitor (currently 1920px), the left-hand panel that serves for navigation + announcements is initially ok. But after scrolling down (on any page), that column gets fixed to the top of the browser, and its width changes. It happens on all screen resolutions, but I never noticed it because only on wide screens it would change enough to actually go on top of the content. It's not too terrible, but it does make it a bit less readable so I just wanted to bring it to your attention.
I took a screenshot of how it looks at the top of the page vs scrolling down a bit:

The cause
The navigation column is set to have width 25%. When we're at the top of the page, that means 25% of its parent container. But when scrolling down, the navigation gets detached from its parent with position: fixed, which means that now the 25% is referring to 25% of the viewport, which is much larger.
To confirm that this is indeed what's happening, here's a snippet from the JS console, starting when the page is at the top

At the start of this section in Computing-on-the-language.rmd line 579 we have
x <- 10; y <- 10
f(10); f(x); f(y)
I admit I may be the only person getting confused but I was not sure as to whether to try running this especially with the previous mention a few lines above of pryr, which triggered a memory that that package has a function f(). Thought I should try it but got this
R> f(10)
Error: is.language(body) is not TRUE
and then I was like "well that's not the same result as f(x)!"
Could just be referred to as fun(10) or func(10) etc. although I now understand the point being made.
Exercise 1 in chapter "Functional programming", section "Lists of functions" says "Implement a summary function that works like base::summary()". But base::summary() is a generic. Do you mean that it should work like the default method? And what should it do about NAs, for which another column with their count is created if they exist?
Chapter "Subsetting"
Subsection "Matching and merging by hand"
I don't understand why
id <- match(grades, info$grade)
is needed as id comes out to be same as grades.
Also based on the example the following code
rownames(info) <- info$grade
info[as.character(grades), ]
can be simplified to just
info[grades, ]
can you give an example where it is clear why you are using the above commands.
# Create a big object
mem_change(x <- 1:1e6)
#> 4 MB
# Also point to 1:1e6 from y
mem_change(y <- x)
#> -4 MB
# Remove x, no memory freed because y is still pointing to it
mem_change(rm(x))
#> 1.42 kB
# Now nothing points to it and the memory can be freed
mem_change(rm(y))
#> -4 MB
I can see in the source sweave for this page that these outputs are just being auto-generated, but 1.42kB should go along with mem_change(y<-x).
From IM:
Just tried to pry a trick or two from your adv-r webpage ... and noticed a BUG in the css / js / twitter bootstrap
On a wide screen (at work) scrolling down makes the 'learn in person' well run over the empty column and in the 'welcome' text
browser is chrome 30.0.1599....
[...]
Resolution is 1920x1200
That said my ultrabook is also 1600x900 and it is also fscked up
the well widens into the empty sep. column
Greetings from the LA Advanced R Reading Group!
The example dealing with .Primitive functions, in which the address doesn't change when you modify a value in a vector, doesn't seem to be true. In our session the address changes:
> x <- 1:10
> address(x)
[1] "0x104becdb8"
> x[2] <- 7L
> address(x)
[1] "0x101f87a20"
With session info:
sessionInfo()
R version 3.1.1 (2014-07-10)
Platform: x86_64-apple-darwin13.1.0 (64-bit)
locale:
[1] en_US.UTF-8/en_US.UTF-8/en_US.UTF-8/C/en_US.UTF-8/en_US.UTF-8
attached base packages:
[1] stats graphics grDevices utils datasets
[6] methods base
other attached packages:
[1] pryr_0.1
loaded via a namespace (and not attached):
[1] codetools_0.2-8 Rcpp_0.11.3 stringr_0.6.2
[4] tools_3.1.1
e.g. object.size("banana")
I think the following may be incorrect - either that or don't understand it fully (Environments - binding names to values).
name <<- value is equivalent to assign("name", value, inherits = TRUE)
However functions f3() and f4() imply they are not equivalent:
#1 bound to x in global environment
f1 <- function() x <<- 1
f1()
x
#2 bound to x in global environment
f2 <- function() assign("x", 2, inherits = TRUE)
f2()
x
#4 bound to x in global environment
f3 <- function() {x <- 3; x <<- 4}
f3()
x
#5 bound to x in execution environment
# value bound to name of x in global environment remains unchanged
f4 <- function() {x <- 5; assign("x", 6, inherits = TRUE)}
f4()
x
Hello, guys!
First of all thank you for this book. As to my question, I often read in transport on Android phone. Is there a pdf version of the book?
The code output at http://adv-r.had.co.nz/Functional-programming.html#anonymous-functions doesn't seem quite right.
See for example third "paragraph" of http://adv-r.had.co.nz/Data-structures.html
In:
http://adv-r.had.co.nz/Functional-programming.html
There is a paragraph which is IMO unclear. I quote:
"You can call anonymous functions directly, but the code is a little tricky to read because you must use parentheses in two different ways: to call a function, and to make it clear that we want to call the anonymous function function(x) 3, not inside our anonymous function call a function called 3 (which isn't a valid function name!): "
I guess you could skip the part "..., not inside our anonymous function call a function called 3 (which isn't a valid function name!)" and it would better? The example bellow IMO demonstrates the situation well even without additional text.
The README mentions _plugins/index.R but it's absent from your repo. A linked issue: can find no indication of how toc.rds is created - is this what index.R does and where is this missing file? Not here! https://github.com/hadley/adv-r/tree/master/_plugins
In this section, the code to calculate "Euclidean distance between a value and a vector of values" is provided as follows:
pdistR <- function(x, ys) {
  sqrt((x - ys) ^ 2)
}
While the code is not incorrect, it is quite inefficient. The square-root and square operations almost effectively cancel out. The euclidean distance between two values x and y in one-dimensional space is simply abs(x - y) and is more efficiently calculated as such. One should probably optimize expressions algebraically before trying to optimize this code with Rcpp.
Given that Euclidean distance is more often used and discussed in spaces with higher than one dimension, a more useful function would probably take a vector input and a matrix input and return a vector output. Perhaps a different example for a vector-input and vector-output function should be used, such as mean-centering a vector:
centerR <- function(ys) {
  ys - mean(ys)
}
The tables under the "The plyr package" heading in Functionals.Rmd do not have labels in the sense of whether the row (or columns) represent the input (or output).
The text would be clearer if, for example, the top left cell of the table would contain the text:
"Output
Input"
Or something even clearer, as this could be misinterpreted I guess ...
Do not have time to do a proper testing/bug report, but just as a note (you are maybe already aware of this). The memory.Rmd page has some examples which I cannot seem to get working (might just be something on my machine, but should be at least quickly checked before publication):
Again, it might be that I have obsolete version of packages, but don't have time right now to play around.
memory.Rmd contains a reference to the lineprof package, but no installation instructions (for installing from github).
Instructions would be welcome, for completeness.
When reading through the performance chapter, many times after running a microbenchmark() there is a piece of text describing the result. The numbers in the text are usually very different from what the code shows, which caused me some confusion initially.
For example, after this piece of code
x <- runif(100)
microbenchmark(
  sqrt(x),
  x ^ 0.5
)
#> Unit: nanoseconds
#>     expr    min     lq  mean median     uq    max neval
#>  sqrt(x)  1,570  1,830  2554  2,050  2,310 31,400   100
#>    x^0.5 15,200 15,500 16769 15,600 16,000 71,200   100
It says that each computation takes about 800 ns, but I could not figure out where you got that number from (I'm assuming in a previous compilation of the book, the median was 800?).
This happens several more times later. I think trying to use inline R while still keeping the numbers readable is overkill, but it might be a good idea to just add a short note somewhere saying that the numbers in the text do not necessarily match the numbers in the output, so that readers will not go crazy trying to figure out where you're getting the numbers from.
Hi,
I have been working through your very good advanced R book, but think there may be a bug in the rollmean function in the functionals chapter.
I may be wrong, but i'm fairly sure that a centred moving average would be:
rollmean <- function(x, n){
    out <- rep(NA, length(x))
    offset <- trunc(n/2)
    for (i in (offset + 1):(length(x) - n + offset + 1)) {
        out[i] <- mean(x[(i - offset):(i + offset)])
    }
    out
}
The edits are changing upper edge of the range to length(x) - n + offset + 1, and changing the processing range to (i - offset):(i + offset) in the mean step.
Happy to be corrected.
NB: I assign the copyright of this contribution to Hadley Wickham.
mj
In exercise:
"Create a function that creates functions that compute the ith central moment of a numeric vector. You can test it by running the following code:"
One of the lines to be used for testing reads:
"stopifnot(all.equal(m1(x), mean(x)))"
It compares the calculated 1st central moment to the mean of the data and "stops" if they are not equal. But they aren't supposed to be equal, since the 1st central moment is zero and not equal to the first ("non-central") moment, which is the mean. (See the interpretations on the referenced Wikipedia page : http://en.wikipedia.org/wiki/Central_moment )
A mistake in the test case or a misunderstanding on my part?
On page:
http://adv-r.had.co.nz/Exceptions-Debugging.html
The following link:
http://adv-r.had.co.nz/beyond-exception-handling.html
Leads to a page with error:
404 Not Found
Use col-xs-12 for both sidebar and turn of sidebar hover
#abc) everywherepandoc --print-default-data-file sample.lua)To make it easier to produce a copy of the book.
This is not a serious issue, more of a question.
In http://adv-r.had.co.nz/memory.html you list 40B as the size of various empty things, and give 4 + 2*8 + 8 + 4 + 4 + ?? as the way to arrive at that figure.
In my R 3.1.1 on 32-bit Ubuntu,
> object_size(list())
24 B
> object.size(list())
24 bytes
and in pqR 2.15.0 (same system)
> object.size(list())
32 bytes
> object.size(raw())
32 bytes
So what's up with the differences? Just the pointers and stuff you mentioned already run well over 24B.
When first learning subsetting, a common mistake is to use x[which(y)] instead of x[y]. Here the which() achieves nothing: it switches from logical to integer subsetting, but the result will be exactly the same.
I'm not sure I agree; if length(which(y)) << length(y) there can be obvious performance benefits:
x <- runif(1e8)
x[1] <- NA;

system.time(x[is.na(x)])
system.time(x[which(is.na(x))])
The code (http://adv-r.had.co.nz/Functions.html lazy evaluation)
> add <- function(x) {
+   function(y) x + y
+ }
is used to illustrate the issues with lazy evaluation. However, running the code, doesn't reproduce the output in the book
R> adders <- lapply(1:10, add)
R> adders[[1]](10)
[1] 11
R> adders[[10]](10)
[1] 20R> sessionInfo()
R version 3.2.0 (2015-04-16)
Platform: x86_64-pc-linux-gnu (64-bit)
Running under: Ubuntu 14.04.2 LTS
locale:
[1] LC_CTYPE=en_GB.UTF-8 LC_NUMERIC=C LC_TIME=en_GB.UTF-8 LC_COLLATE=en_GB.UTF-8
[5] LC_MONETARY=en_GB.UTF-8 LC_MESSAGES=en_GB.UTF-8 LC_PAPER=en_GB.UTF-8 LC_NAME=C
[9] LC_ADDRESS=C LC_TELEPHONE=C LC_MEASUREMENT=en_GB.UTF-8 LC_IDENTIFICATION=C
attached base packages:
[1] stats graphics grDevices utils datasets methods base
other attached packages:
[1] colorout_1.1-0
loaded via a namespace (and not attached):
[1] tools_3.2.0 fortunes_1.5-2Needs a little jquery to scrape h2 and h3 and create a TOC in the sidebar.
toc = $("#toc");
add_entry = function() {
  $(this).tagName
};
$(".container").find("h2, h3").each(add_entry);
e.g. https://github.com/shamess/jQuery-Table-of-Contents-Plugin/blob/master/jquery.tableofcontents.js, https://github.com/jgallen23/toc/blob/master/lib/toc.js
See attached screenshot. You cannot fully read the content.
Firefox Android 4.2 (also happens on the desktop firefox)

The two versions of rollapply in Functionals.rmd are not comparable. The version with the for loop returns a rolling average with an offset (correctly "missing" the first few values), while the vapply version starts with no "NA" values. Bellow is a variant that should work.
rollapply <- function(x, n, f, ...) {
  offset <- trunc(n / 2)
  locs <- (offset + 1):(length(x) - n + offset - 1)
  tmp1 <- rep(NA, length=offset)
  tmp2 <- vapply(locs, function(i) f(x[(i - offset):(i + offset - 1)], ...),
         numeric(1))
  c(tmp1, tmp2)
}I'm on a Nexus 4 and the Exceptions and the Functionals pages cant be read because they appear too wide and it is impossible to scroll. The rest of the pages I 've checked look fine
Most of the text on http://adv-r.had.co.nz/Testing.html appears as flat text without line breaks.
A declarative, efficient, and flexible JavaScript library for building user interfaces.
🖖 Vue.js is a progressive, incrementally-adoptable JavaScript framework for building UI on the web.
TypeScript is a superset of JavaScript that compiles to clean JavaScript output.
An Open Source Machine Learning Framework for Everyone
The Web framework for perfectionists with deadlines.
A PHP framework for web artisans
Bring data to life with SVG, Canvas and HTML. 📊📈🎉
JavaScript (JS) is a lightweight interpreted programming language with first-class functions.
Some thing interesting about web. New door for the world.
A server is a program made to process requests and deliver data to clients.
Machine learning is a way of modeling and interpreting data that allows a piece of software to respond intelligently.
Some thing interesting about visualization, use data art
Some thing interesting about game, make everyone happy.
We are working to build community through open source technology. NB: members must have two-factor auth.
Open source projects and samples from Microsoft.
Google ❤️ Open Source for everyone.
Alibaba Open Source for everyone
Data-Driven Documents codes.
China tencent open source team.