highfestiva / finplot Goto Github PK
View Code? Open in Web Editor NEWPerformant and effortless finance plotting for Python
License: MIT License
Performant and effortless finance plotting for Python
License: MIT License


Hi!
First of all, great job with this module! it really saves me lot of time.
Now, when I plot a moving average, it doesnt plot. After a while trying, I literally took your example number two where a ma of 25 candles is plotted, and still doesnt plot anything.
Maybe its a configuration or something.
Thaks in advance!
Great things!
hi,
is it possible to show the order book with the plot?
What is best approach to run finplot in a headless environment (docker, for instance)? Since it will be a HTTP server, how could i dump the entire plot to a BytesIO object to serve it later in a request? Thanks.
Hi again and thanks for the last help.
Now i have problem with remove_line in embed finplot.
First I tried add and delete line as following:
up = fplt.add_line((df["START"].iloc[i],df['up'].iloc[i] ), (df["STOPpos"].iloc[i], df3['up'].iloc[i]), color='#ffffff', interactive=False, ax = ax)
fplt.remove_line(up)
but it doesn't work.
Next I tried this:
plots.append(fplt.add_line((df["START"].iloc[i],df['up'].iloc[i] ), (df["STOPpos"].iloc[i], df3['up'].iloc[i]), color='#ffffff', interactive=False, ax = ax))
and delete:
fplt.remove_line(plots[2])
but the lines don't remove.
My code is similar (more advanced) like this:
...
plots = []
def update(txt):
    df = download(txt)
    df2 = test(df)
    if len(df) < 20: # symbol does not exist
        return
    price = df['Open Close High Low'.split()]
    volume = df['Open Close Volume'.split()]
    if not plots:
        plots.append(fplt.candlestick_ochl(price))
        plots.append(fplt.volume_ocv(volume, ax=ax.overlay()))
        for i in range(0,df2.shape[0]):
          if df2['STOP'].iloc[i] != 0:
            plots.append(fplt.add_line((df2["START"].iloc[i],df2['up'].iloc[i] ), (df2["STOP"].iloc[i], df2['up'].iloc[i]), color='#000000', interactive=False, ax = ax))
    else:
        plots[0].update_data(price)
        plots[1].update_data(volume)
        length = len(plots)
        for i in range(2,length-1):
          fplt.remove_line(plots[i])
          #del plots[i]
        if line.isChecked():
          for i in range(0,df2.shape[0]):
            if df2['STOP'].iloc[i] != 0:
              plots.append(fplt.add_line((df2["START"].iloc[i],df2['up'].iloc[i] ), (df2["STOP"].iloc[i], df2['up'].iloc[i]), color='#000000', interactive=False, ax = ax))
...
What am I doing wrong?
Thanks for help!
Line 1081 in a084ac6
I initialize win.proxy_click as [] and append proxy to it, so now I can install more callback. Not sure if this is the correct way to use.
win.proxy_click.append(pg.SignalProxy(win.scene().sigMouseClicked, slot=partial(_time_clicked, ax, inspector)))
Thank you.
Hi, I have modified the code from example-embed.py as the following:
#!/usr/bin/env python3

import finplot as fplt
from functools import lru_cache
from PyQt5.QtWidgets import QGraphicsView, QComboBox, QLabel
from PyQt5.QtGui import QApplication, QGridLayout
from threading import Thread
import yfinance as yf


app = QApplication([])
win = QGraphicsView()
win.setWindowTitle('TradingView wannabe #2')
layout = QGridLayout()
win.setLayout(layout)
win.resize(900, 600)

combo1 = QComboBox()
combo1.setEditable(True)
[combo1.addItem(i) for i in 'AMRK FB GFN REVG TSLA TWTR WMT CT=F GC=F ^FTSE ^N225 EURUSD=X ETH-USD'.split()]
layout.addWidget(combo1, 0, 0, 1, 1)
info1 = QLabel()
layout.addWidget(info1, 0, 1, 1, 1)

combo2 = QComboBox()
combo2.setEditable(True)
[combo2.addItem(i) for i in 'AMRK FB GFN REVG TSLA TWTR WMT CT=F GC=F ^FTSE ^N225 EURUSD=X ETH-USD'.split()]
layout.addWidget(combo2, 0, 2, 1, 1)
info2 = QLabel()
layout.addWidget(info2, 0, 3, 1, 1)

ax1, ax2 = fplt.create_plot_widget(win, init_zoom_periods=100, rows=2)
win.axs = [ax1, ax2] # finplot requres this property
layout.addWidget(ax1.ax_widget, 1, 0, 1, 2)
layout.addWidget(ax2.ax_widget, 1, 2, 1, 2)


@lru_cache(maxsize=15)
def download1(symbol):
    return yf.download(symbol, '2020-01-01')

@lru_cache(maxsize=15)
def download2(symbol):
    return yf.download(symbol, '2020-06-01')

@lru_cache(maxsize=100)
def get_name(symbol):
    return yf.Ticker(symbol).info['shortName']

plots1 = []
def update1(txt):
    df = download1(txt)
    if len(df) < 20: # symbol does not exist
        return
    info1.setText('Loading symbol name...')
    price = df['Open Close High Low'.split()]
    ma20 = df.Close.rolling(20).mean()
    ma50 = df.Close.rolling(50).mean()
    volume = df['Open Close Volume'.split()]
    if not plots1:
        plots1.append(fplt.candlestick_ochl(price, ax=ax1))
        plots1.append(fplt.plot(ma20, legend='MA-20', ax=ax1))
        plots1.append(fplt.plot(ma50, legend='MA-50', ax=ax1))
        plots1.append(fplt.volume_ocv(volume, ax=ax1.overlay()))
    else:
        plots1[0].update_data(price)
        plots1[1].update_data(ma20)
        plots1[2].update_data(ma50)
        plots1[3].update_data(volume)
    Thread(target=lambda: info1.setText(get_name(txt))).start() # slow, so use thread

plots2 = []
def update2(txt):
    df = download2(txt)
    if len(df) < 20: # symbol does not exist
        return
    info2.setText('Loading symbol name...')
    price = df['Open Close High Low'.split()]
    ma20 = df.Close.rolling(20).mean()
    ma50 = df.Close.rolling(50).mean()
    volume = df['Open Close Volume'.split()]
    if not plots2:
        plots2.append(fplt.candlestick_ochl(price, ax=ax2))
        plots2.append(fplt.plot(ma20, legend='MA-20', ax=ax2))
        plots2.append(fplt.plot(ma50, legend='MA-50', ax=ax2))
        plots2.append(fplt.volume_ocv(volume, ax=ax2.overlay()))
    else:
        plots2[0].update_data(price)
        plots2[1].update_data(ma20)
        plots2[2].update_data(ma50)
        plots2[3].update_data(volume)
    Thread(target=lambda: info2.setText(get_name(txt))).start() # slow, so use thread


combo1.currentTextChanged.connect(update1)
update1(combo1.currentText())

combo2.currentTextChanged.connect(update2)
update2(combo2.currentText())


fplt.show(qt_exec=False) # prepares plots when they're all setup
win.show()
app.exec_()
The idea is to see if possible to have 2 independent plots embedded in a single QApplication. It works mostly, but I've noticed a few things:
Thanks in advance for your advice!
module Instrument and constants are not available in bitmex websocket. Is it possible if you can update the code in https://github.com/highfestiva/finplot/blob/master/finplot/example-bitmex-ws.py
from bitmex_websocket import Instrument
from bitmex_websocket.constants import InstrumentChannels
Hi.
Is it possible to add an additional axis to an embedded project? Like here:

This is that piece of code:
ax = fplt.create_plot_widget(win, init_zoom_periods=0)
win.axs = [ax] # finplot requres this property
layout.addWidget(ax.ax_widget, 2, 0, 1, 4)
Normal we can add axies like that:
ax,axv,ax2,ax3,ax4 = fplt.create_plot('blabla', rows=5)
Hi again.
Is it possible add legend with actual index values for "example-embed?
Like here:
fplt.set_time_inspector(update_legend_text, ax=ax, when='hover')

but when I try this in embeded project i got this:
fplt.set_time_inspector(update_legend_text, ax=ax, when='hover')
File "C:\Users\Marcin\AppData\Roaming\Python\Python37\site-packages\finplot_init_.py", line 1485, in set_time_inspector
win.proxy_hover = pg.SignalProxy(win.scene().sigMouseMoved, rateLimit=15, slot=partial(_inspect_pos, ax, inspector))AttributeError: 'NoneType' object has no attribute 'sigMouseMoved'
Thanks!
Hello, could you please change the installation requirement for PyQt5, to be rather as below, because in my case it complains about it if its like this 'PyQt5==5.13.0', for some reason its not able to install this specific version. Thanks!
install_requires=['pandas>=0.23.4', 'PyQt5>=5.13.0', 'pyqtgraph>=0.10.0']
Find the attached .py and .csv files zipped together which produced this graph:

I expected the vertical scale to be appropriate to the maximum value in the .csv. If you divide that dataframe by 10 the bug goes away.
fplt.volume_ocv.update_data(df) does not redraw new candles / volume after first drawing.
thank you
Congrats. Great package!
Is it possible to save inline a plot in jupyterlab?
How?
Is there some way to plot more than one data series with a secondary y-axis scale (as with secondary_y with matplotlib) or at least overlay arbitrary data on the same plot (with the same datetime index)? I looked in the code at the Pandas-related PlotDf but doing a dir on the return doesn't show anything relevant AFAIK.
Python 3.8.3
PyQt 5.15
PySide2 5.15
PyCharm 2020.1
If i run you samples (https://github.com/highfestiva/finplot/blob/master/finplot/example-analyze.py) with Debug, i get next error:
Connected to pydev debugger (build 201.6668.115)
Traceback (most recent call last):
File "", line 991, in _find_and_load
File "", line 975, in _find_and_load_unlocked
File "", line 671, in _load_unlocked
File "", line 783, in exec_module
File "", line 219, in call_with_frames_removed
File "C:\Python38\lib\site-packages\finplot_init.py", line 1587, in
qtver = '%d.%d' % (QtCore.QT_VERSION//256//256, QtCore.QT_VERSION//256%256)
AttributeError: module 'PySide2.QtCore' has no attribute 'QT_VERSION'
If i'm run without Debug - all good!
P.S: if i deleted PySide2 from Python - all, good!
....\Python38\lib\site-packages\finplot\__init__.py:2051: DeprecationWarning: an integer is required (got type float).  Implicit conversion to integers using __int__ is deprecated, and may be removed in a future version of Python.
  return pg.mkColor(color).lighter(f*100)

# and

....\Python38\lib\site-packages\pyqtgraph\ThreadsafeTimer.py:26: DeprecationWarning: an integer is required (got type float).  Implicit conversion to integers using __int__ is deprecated, and may be removed in a future version of Python.
  self.timer.start(timeout)

# and

....\Python38\lib\site-packages\pyqtgraph\widgets\GraphicsView.py:374: DeprecationWarning: an integer is required (got type float).  Implicit conversion to integers using __int__ is deprecated, and may be removed in a future version of Python.
  delta = Point(ev.pos() - QtCore.QPoint(*self.lastMousePos))
Looks like lastMousePos is x,y floats, but pyqtgraph / pyqt5 is expecting ints now, and python itself seems to be complaining, spamming the console as you mouse around charts.
with warnings.catch_warnings():
    warnings.simplefilter("ignore")
    # do finplot stuff
isn't really a great workaround but it does work.
Full list of my modules:
Module | InstalledVersion | LatestAvailable
PyQt5 | 5.13.0 | 5.15.1
PyQt5-sip | 12.8.1 | 12.8.1
aiohttp | 3.6.2 | 4.0.0a1
aiohttp-proxy | 0.1.2 | 0.1.2
async-timeout | 3.0.1 | 4.0.0a2
attrs | 19.3.0 | 20.2.0
certifi | 2020.6.20 | 2020.6.20
chardet | 3.0.4 | 3.0.4
ciso8601 | 2.1.3 | 2.1.3
ddt | 1.4.1 | 1.4.1
discord.py | 1.4.1 | 1.4.1
finplot | 1.1.0 | 1.1.0
idna | 2.10 | 2.10
multidict | 4.7.6 | 4.7.6
multitasking | 0.0.9 | 0.0.9
numpy | 1.19.2 | 1.19.2
pandas | 1.1.2 | 1.1.2
pandas-market-calendars | 1.5.0 | 1.6.0
pip | 20.1.1 | 20.2.3
plotly | 4.10.0 | 4.10.0
pygame | 1.9.6 | 2.0.0.dev8
pyqtgraph | 0.11.0 | 0.11.0
python-dateutil | 2.8.1 | 2.8.1
pytz | 2020.1 | 2020.1
requests | 2.24.0 | 2.24.0
retrying | 1.3.3 | 1.3.3
robin-stocks | 1.2.0 | 1.5.1
setuptools | 47.1.0 | 50.3.0
six | 1.15.0 | 1.15.0
ta | 0.5.25 | 0.5.25
urllib3 | 1.25.9 | 1.25.10
websockets | 8.1 | 8.1
yarl | 1.4.2 | 1.5.1
yfinance | 0.1.54 | 0.1.54
Is finplot open source. I am unable to find the source files.
So, I've developed a live updating chart based on the examples provided - but I was wondering if there would be a way to update timer_callback so that it would wait for a specific datetime before calling the update method.
I have zero experience with PyQt, so I'm not sure if I could just integrate the update method with something like what I have now:
target_time = datetime.utcnow()+timedelta(days=1)
target_time = target_time.replace(hour=0,minute=1,second=0,microsecond=0)
print('Currently waiting until UTC time: {0}'.format(target_time))
while datetime.utcnow() < target_time:
    time.sleep(10)

get data and update plots
This code waits for 1 minute after midnight each day and then calls an API to get market prices. My API has limits so I need to have fine control over the number of calls that it makes. I understand that I could just implement something similar to the example, only waiting for the first midnight + 1minute and then setting the timer to every 24 hours... Would that be accurate over time? Or would there be a way to integrate the update method, similar to what you have in your examples, with a while loop like I have here?
Just found your library - it is fantastic compared to what is available elsewhere. Thank you for all of the hard work that you've put into it!
Not sure where to ask questions. I have 2 dataframes with separate indices (intraday OHLC and daily OHLC), how do I get the second pane to plot the daily OHLC aligned correct to the first panes intraday OHLC?
thanks
I would like to add finplot realtime chart on webpage which is developed using Django / Flask. Would like to know if this is possible now or in the future?
After install i got this error:
Error: spyder 4.1.3 has requirement pyqt5<5.13; python_version >= "3", but you'll have pyqt5 5.13.0 which is incompatible.
After it couldn't use spyder, the only solution was uninstall spyder and the library, next install spyder again.
I'm using conda with python 3.6 as it's the last supported by conda ta-lib.
Hey, this library is great and super easy to use. Thanks for writing it!
I'm now trying to draw a line between two coordinates but can't seem to get it working. Any recommendations how I can do this easily? Happy to send a PR if it comes to that.
I've tried a few things but none of them are satisfactory. Ideally, the interface would be similar to add_band(), it could be something like add_line(ax, [x1, y1], [x2, y2], width, color).
Here is what I've tried so far:
Added the code below to the example in the README but this only works if I comment out the calls to fplt.PandasDataSource and candlestick_ochl. If I don't comment these lines, then the code below does not work.
line = fplt.pg.LineSegmentROI([[0,0], [1100, 200]], pen=(255,9,0), movable=False) line.setZValue(60) ax2.addItem(line)
Also tried fplt.addline and fplt.pg.LineROI but they show the same behavior as above.
How do I draw a line between two coordinates? Thanks!
This seems like a good package but I haven't used it yet because when I install it it goes with pyqt 5.9. Anyway around it?
Line 1267 in a084ac6
In the example code, labels are numbers in string type. When I use real chars, the code above will tell me can't compare number with string. So I added below parameter in the first max().
My pandas is 1.0.5. And the data source I passed in is a pd.DataFrame with 3 columns: date, high and 'A'.
if datasrc.df.iloc[:, 1:].max(numeric_only=True).max() > 1e8
Please let me know if my understanding is correct.
Thank you.
Hello. Is the color visualization of the trend on the moving average possible? Thanks for the help!

Hi, I am new to Python and to finplot (just so you know). I found your package because I the alternatives produce mediocre candlestick plots, whereas yours produces super quality plots.
However, I cannot manage to add a moving average to a candlestick plot. I am using Anaconda3 disctibution of Python. I needed to fiddle a bit with the installation to get your package installed, don't know if this screwed up something.
Anyways, if you run the attached example (it uses yfinance to scrape data), you will not see the moving average displayed (at least I do not). If you comment out the plot candlestick line, then you will see the moving average (at least I do).
In all cases, good work and thanks for the package.
yfinance_test.txt
Hello,
Thanks for the great work, I managed the plot my first graph easily by following the example. I just need to save the graph, how can I do that ?
Cheers.
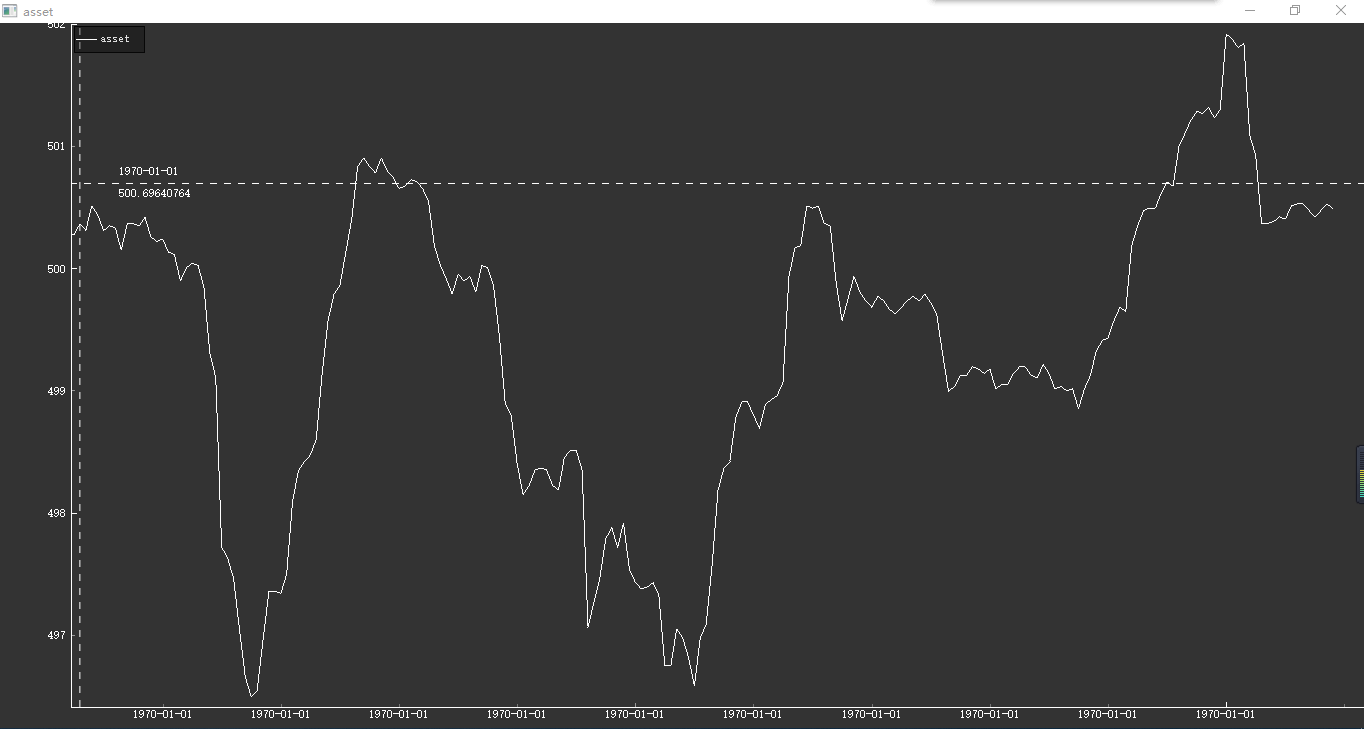
I find finplot is such a powerful tool, i used it to plot realtime candlestick_ochl and indicators based on reat api.
Now i am trying to plot realtime asset, but i don't know how to update timestamp.
Here is my code:
`data = exchange.get_coin_account(underlying="btc-usdt")
equity = float(data['equity'])
timestamp = get_utc_time()
time.append(timestamp)
asset.append(equity)

if not plots:
    global ax
    plots.append(fplt.plot(asset, ax=ax, color='#FFFFFF', legend="asset"))
else:
    plots[0].update_data(asset)`
How can i update timestamp ?
Hi, I'm using your lib. Thank you.
I have added a legend widget into an application. If a data frame is not loaded yet an Error occurs on the hover event
Could you please add a check that ax.vb.datasrc is not None
def _inspect_pos(ax, inspector, poss):
    point = ax.vb.mapSceneToView(poss[-1])
    t = point.x() + 0.5
    try:
        if ax.vb.datasrc:
            t = ax.vb.datasrc.closest_time(t)
    except KeyError: # when clicking beyond right_margin_candles
        if clamp_grid:
            t = ax.vb.datasrc.x.iloc[-1 if t > 0 else 0]
    try:
        inspector(t, point.y())
    except Exception as e:
        print(type(e), e)
hi, i'm writting a program using kivy and finplot, my question is how to run finplot in a second process, liberating the main process to continue its work.???
Line 172 in a084ac6
I get it changed to: return self.df.iat[int(x), 0]
Was thinking to draw some nice charts based on pyqtgraph, then I found yours. It looks quite nice and it's easy to use, which save me a lot of time. Really appreciate your great work.
While coding with it, found few minor issues. If you don't mind, I'll just post here for your consideration.
Thank you.

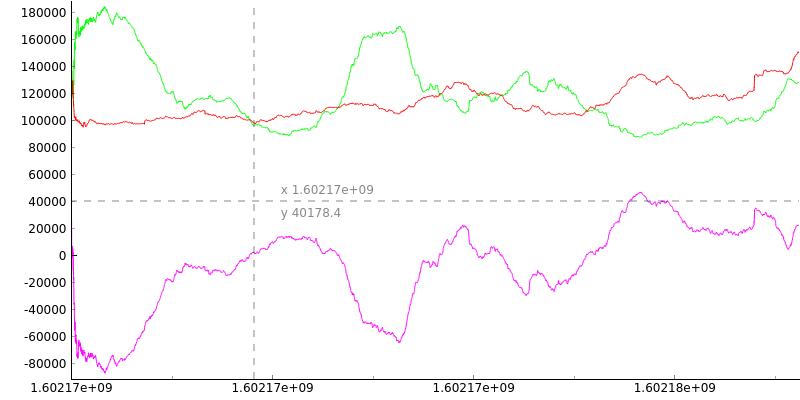
i want timestamp contains hour and minute, instead of date only, my timestamp is like "2020-09-29 15:22:10.784148", why picture didn't show hour and minute ?
Thanks for creating this great work. It is very powerful compare to other plot libs.
When I plot using fplt.plot(df['timestamp', df['MyIndicator']], the x axis display timestamp value instead of display datetime format. Ideally I also want to print H:M:S format instead of YY/MM/DD/ format. How can I do that?
Best regards,
Ken
Hello. Is it currently possible to create a horizontal volume in finplot? If not, then do you have an intention to make it possible in the future. Thank you so much!

Enhancement request related to secondary Y-axis:
Multiple overlayed graphs with varying Y-axes might be handled if a mouse-over hover of a given graph's line brought up the corresponding scale on the left side and its label up in the upper left hand corner.
I have a data series where the 'tick' size is 0.25. This is properly captured by ax.significant_eps, but the value of ax.significant_decimals is 1. The simplest possible test case:
>>> def difftodecimals(smallest_diff):
...     s = '%.0e' % smallest_diff
...     exp = -int(s.partition('e')[2])
...     decimals = max(1, min(10, exp))
...     return decimals
...
>>> difftodecimals(0.25)
1
>>> difftodecimals(0.025)
2
It seems that this function only cares about the first significant value when calculating total significant digits. I did not want to fix as I'm assuming there are other use cases outside of mine where the current function is behaving correctly.
Hello. Thank you very much for your work. You helped a lot. After fix (Volume indicator doesn't update visually). Artifacts began to appear during the candles update. Before the fix, everything was fine. To get rid of artifacts, you have to move the mouse. It looks like the load on the render engine has been added. I hope very much for your help.
Python 3.7.8
PyQt 5.13
pyqtgraph 0.11.0
finplot 0.8.0
PyCharm 2020.1

Hello,
I am trying to make a tkinter GUI that will launch a finplot chart once an item in a list is selected and a button is pressed.
The action works, but only once.
If I close the finplot window and I press the button again the chart is not launched again.
So in effect I cannot select another item from the list and chart it, unless I restart the app.
If you can assist in what I am missing it would be greatly appreciated.
Below is my code
Hi, is it possible to export the plots as png or any other format?
fplt.foreground = '#FFFFFF'
fplt.background = '#333333'
self.__ax, self.__ax2, self.__ax3 = fplt.create_plot(symbol, rows=3)
when i create more than 1 rows, second row always be white background, how can i make it be a dark mode like other rows.
The import module of the pinplot is pyqtgraph, so it is compatible, but I don't know how to upload it.
Please tell me how to upload the pinplot to the pyqt5 window.
Maybe I've been struggling with this for months.
Hi,
is there any way to set xlabel and ylabel for the plot?
I haven't found this feature.
Thanks
How to generate a shaded region (eg: Bollinger Band)? In matplotlib, there is "fill_between" and "alpha" function.
Thank you!
Hello,
Is there a way to draw k line legend for every candle as below picture?
Thanks

def create_plot(title='Finance Plot', rows=1, init_zoom_periods=1e10, maximize=True, yscale='linear'):
global windows, last_ax
pg.setConfigOptions(foreground=foreground, background="#333333")
if background color settings could be a parameter of create_plot function, it will be better. thanks !
First of all thanks for your awesome library. I'm newbie to python, I need to run finplot without blocking main thread.
I have the following class, everything works as expected, but it blocks my main thread, i've lot of logics on main thread. it manages multiple background thread to collect data from multiple data sources.
`
import pandas as pd
import finplot as fplt
ax = fplt.create_plot('TradingView')
class PlotScheme(object):
def __init__(self, strategy):
    self.plots = []
    self.strategy = strategy
    self.candle = self.strategy.candle

def update(self):
    candlesticks = pd.DataFrame(columns=['datetime', 'open', 'close', 'high', 'low'])
    candlesticks['datetime'] = self.candle.datetime
    candlesticks['open'] = self.candle.open
    candlesticks['close'] = self.candle.close
    candlesticks['high'] = self.candle.high
    candlesticks['low'] = self.candle.low

    indicators = pd.DataFrame(columns=['datetime', 'SPH', 'SPL', 'LPH', 'LPL', 'Average', 'Average_long'])
    indicators['datetime'] = self.candle.datetime
    indicators['SPH'] = self.strategy.spm.lines.SPH
    indicators['SPL'] = self.strategy.spm.lines.SPL
    indicators['LPH'] = self.strategy.spm.lines.LPH
    indicators['LPL'] = self.strategy.spm.lines.LPL
    indicators['Average'] = self.strategy.bar_size.lines.av
    indicators['Average_long'] = self.strategy.large_bar_size.lines.av

    LPL_indicator = indicators['datetime LPL'.split()]
    SPL_indicator = indicators['datetime SPL'.split()]
    LPH_indicator = indicators['datetime LPH'.split()]
    SPH_indicator = indicators['datetime SPH'.split()]

    if not self.plots:
        # first time we create the plots
        self.plots.append(fplt.candlestick_ochl(candlesticks, ax=ax))
        self.plots.append(fplt.plot(LPH_indicator, ax=ax, color='#105900', width=2, legend='LPH'))
        self.plots.append(fplt.plot(SPH_indicator, ax=ax, color='#1a8c00', width=1, legend='SPH'))
        self.plots.append(fplt.plot(SPL_indicator, ax=ax, color='#FF5733', width=1, legend='SPL'))
        self.plots.append(fplt.plot(LPL_indicator, ax=ax, color='#900C3F', width=2, legend='LPL'))
    else:
        self.plots[0].update_data(candlesticks)
        self.plots[1].update_data(LPH_indicator)
        self.plots[1].update_data(SPH_indicator)
        self.plots[1].update_data(SPL_indicator)
        self.plots[1].update_data(LPL_indicator)

def plot(self):
    self.update()
    fplt.timer_callback(self.update, 2.0)  # update every N seconds
    fplt.show()
`
please guide me to show the fplt without blocking main thread. i've tried using thread but its not working.
Hi!
Is it possible to make an unfilled circle like this?

Thanks!
Hello,
Is it possible to connect with line between dumb mark in the second example?
the code is as below, just copy this from GitHub,
lo_wicks = df[['open','close']].T.min() - df['low']
df.loc[(lo_wicks>lo_wicks.quantile(0.99)), 'marker'] = df['low']
fplt.plot(df['time'], df['marker'], ax=ax, color='#4a5', style='^', legend='dumb mark')
Thanks
A declarative, efficient, and flexible JavaScript library for building user interfaces.
🖖 Vue.js is a progressive, incrementally-adoptable JavaScript framework for building UI on the web.
TypeScript is a superset of JavaScript that compiles to clean JavaScript output.
An Open Source Machine Learning Framework for Everyone
The Web framework for perfectionists with deadlines.
A PHP framework for web artisans
Bring data to life with SVG, Canvas and HTML. 📊📈🎉
JavaScript (JS) is a lightweight interpreted programming language with first-class functions.
Some thing interesting about web. New door for the world.
A server is a program made to process requests and deliver data to clients.
Machine learning is a way of modeling and interpreting data that allows a piece of software to respond intelligently.
Some thing interesting about visualization, use data art
Some thing interesting about game, make everyone happy.
We are working to build community through open source technology. NB: members must have two-factor auth.
Open source projects and samples from Microsoft.
Google ❤️ Open Source for everyone.
Alibaba Open Source for everyone
Data-Driven Documents codes.
China tencent open source team.