kedro-org / kedro-viz Goto Github PK
View Code? Open in Web Editor NEWVisualise your Kedro data and machine-learning pipelines and track your experiments.
Home Page: https://demo.kedro.org
License: Apache License 2.0
Visualise your Kedro data and machine-learning pipelines and track your experiments.
Home Page: https://demo.kedro.org
License: Apache License 2.0


![dependabot[bot] avatar](https://avatars.githubusercontent.com/in/29110?v=4 "dependabot[bot]")


The kedro viz export command would allow visualizing the pipeline DAG from the command line.
Options:
--pipeline pipeline to export--format [png, svg]--resolution if png format is used--output output pathThis can be used in:
CI pipelines
pre-commit hooks (always up to date project documentation)
And other automation.
Include labels so that we can categorise your feature request
Layers don't show up correctly for transcoded dataset
For example, Metrics in the screenshot below is a transcoded dataset with a layer:
metrics@pandas:
  type: tracking.MetricsDataSet
  filepath: data/09_tracking/metrics.json
  layer: models
Observe that no layer visualisation shows up.

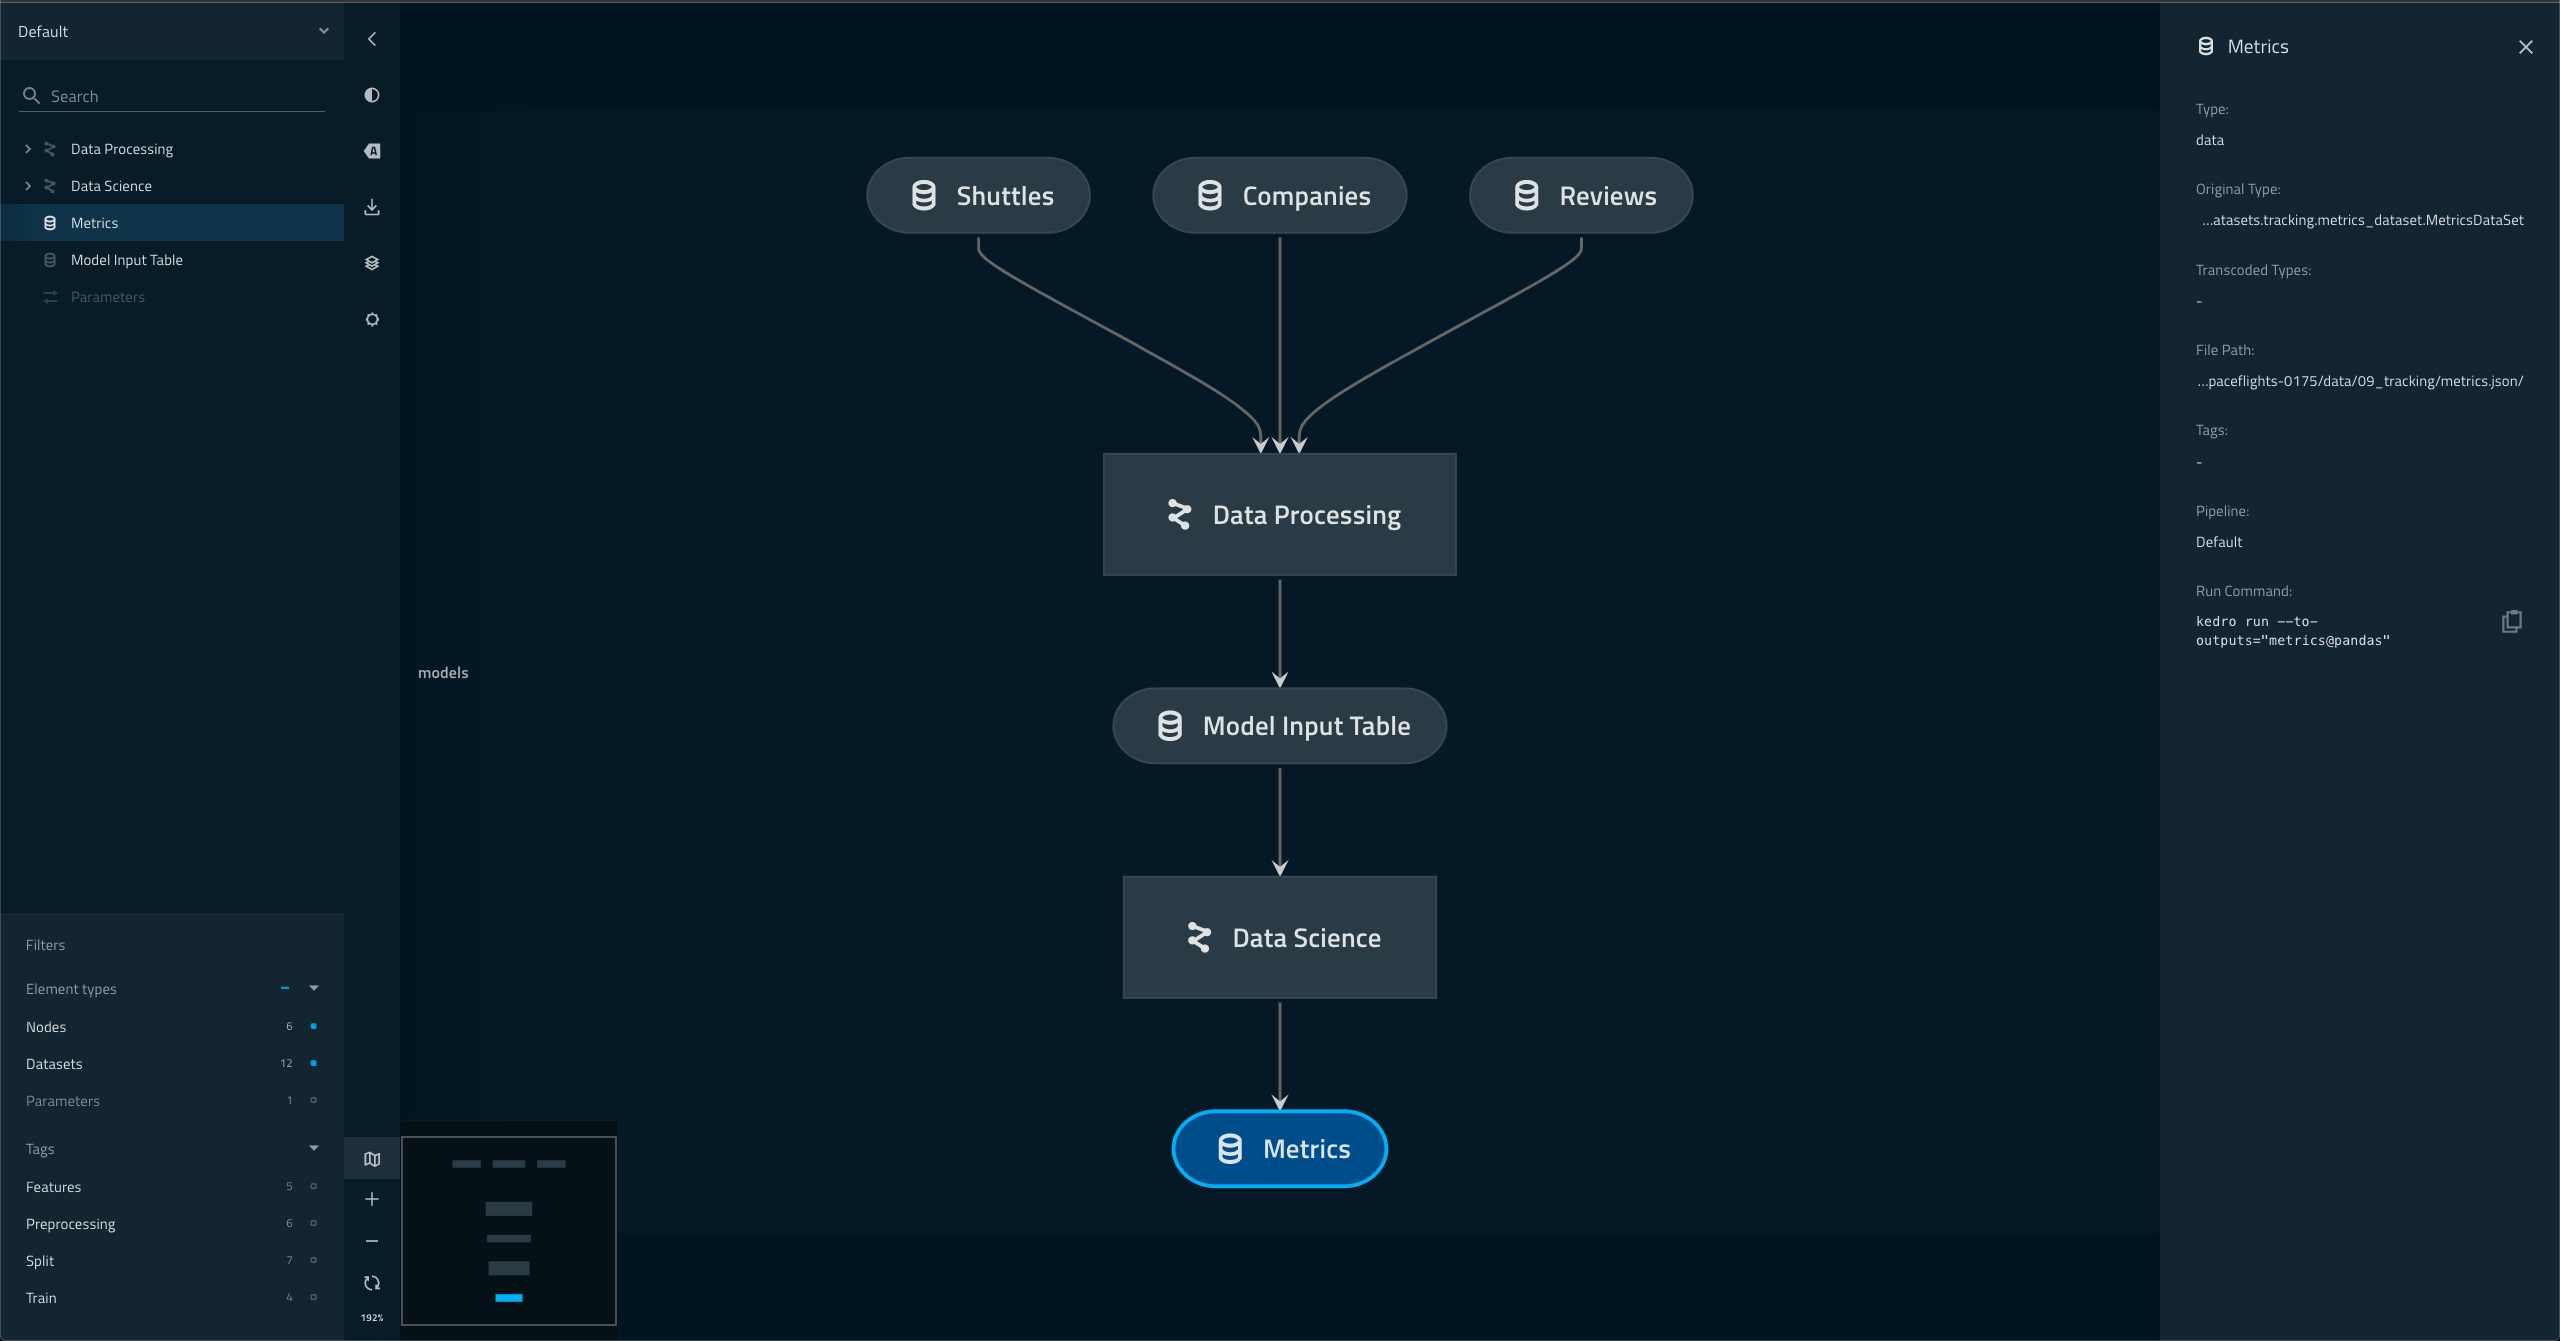
Layers should show up like below
Include as many relevant details as possible about the environment you experienced the bug in:
It's frustrating that all our JS-component code lives in index.js files. I find that hard when searching for a file to open. Most often, the file I want to open isn't the top choice, but much further down the list, like so (I search for "run-list" and want to open the run-list-card JS file):
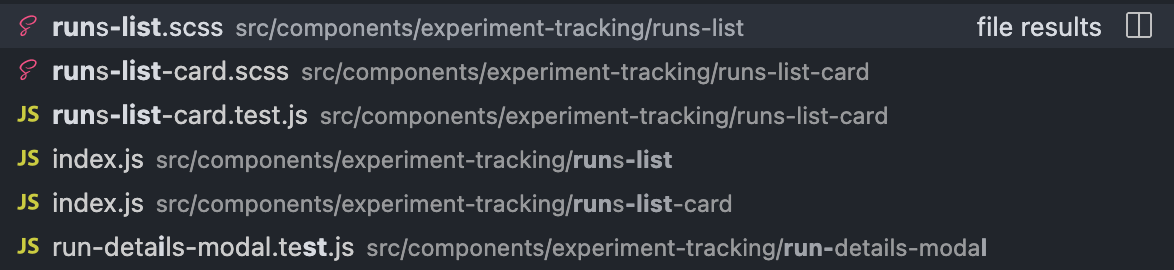
If this is improved it'll save everyone time when searching for and opening files.
All the content in our index files should be moved into a newly-created file, with the filename matching the folder name. Sticking with the run-list-card example from above, our new file would be named run-list-card.js and contain all the necessary code for that component. Finally, all index files should be nothing more than and import and export, like so:
import RunListCard from './run-list-card';

export default RunListCard;
This pattern is well established. We even had it in Kedro UI.
Hello! I am having an error when clicking on a node in kedro viz that has a partial or curry function. Besides the error, the visual interface does not show the inputs or parameters.
AttributeError: 'functools.partial' object has no attribute '__closure__'
This is the error I get when using partial functions.
AttributeError: 'curry' object has no attribute '__closure__'
This is the error I get when using curry functions.
I have tried using update_wrapper and it is still raising the same error :/ .
I am trying to run kedro viz with a project that uses multiple partial functions,.
Run as normal.
The side bar with the parameters and input does not load.
-- If you received an error, place it here.
AttributeError: 'functools.partial' object has no attribute 'closure'
-- Separate them if you have more than one.
AttributeError: 'curry' object has no attribute 'closure'
## Your Environment
Include as many relevant details as possible about the environment you experienced the bug in:

* Web browser system and version:
* Operating system and version:

## Checklist
- [ ] Include labels so that we can categorise your issue
I am creating my kedro pipelines dynamically from a custom JSON file which is part of my configuration per environment. So in a fully configured environment I would have following files:
# ./conf/environment_name
- catalog.yml
- credentials.yml
- logging.yml
- parameters.yml
- pipelines.json # my custom pipelines that are generated dynamically
That means running pipelines for me is only possible using
kedro run --env=environment_name
Running kedro viz would only work for me in the default local environment but would not allow me to visualize pipelines per environment.
Can someone highlight the way on how to run kedro viz for different environments? It's not my number 1 issue at the moment but when the time comes I'd also be happy to submit a PR.
Would it work if I somehow use the React component instead of kedro viz from the command line?
I'd love this change because the kedro workflow I am trying to implement would contain several different experiments in the same repository with just different config files for each experiment. That way I could visualize different pipelines per repository.
Not sure how it works under the hood, but giving the same parameter --env=environment_name parameter to kedro and kedro viz would be cool I guess.
As users start to experiment with the new tracking.JSONDataSet they may name their catalog entries something like params_random_forest and Kedro Viz will currently mistakenly count them as a parameter type node when they are in fact a regular data node.
Should appear as a data node like the 'hyperparams_linear` node below

Node only visible in the expanded parameter view - also impossible that a parameter should be an output to a node
This document aims to provide a very high level overview and discussion of the possible options for the FE architecture to enable the work for experiment tracking milestone 2. ( refer to this document for a previous discussion on this milestone.)
In this milestone, on Kedro-Viz, we will display:
There are 3 main requirements to enable the above:
Requirement 1
The ability to list a historical list of runs data
Requirement 2
Real time updates of run list data
Requirement 3
Fast load times of a potentially vast amount of runs list data
Some background information about our setup:
/api/main, /api/nodes/<id>, /api/pipeline/<id> )Please refer below to a very high level overview of the existing set up of the data flow between the FE and the Kedro-viz server.

With the above requirements and challenges, The goal of this study is to find an easy and effective solution for web socket integration and caching within our app.
My proposal works alongside the following assumptions:
On the Core side:
On the kedro-viz server side:
On having implemented web-sockets, one of the biggest challenges on the FE is the integration and management of the web socket connection, which is often an enormous task of configuration. This is when introducing GraphQL as an API integration layer comes in as a great setup for this transition.
The following diagram summarises and outlines the overall requirements and the related proposed technologies that will be discussed below.

GraphQL
To enable the real time update of the session data (requirement 2), I propose utilising the GraphQL technology as an API integration layer to enable real time communication via GraphQL subscriptions. GraphQL is a query language for APIs that allows the execution of queries using a type system / schema. It support three types of operations: Queries for data fetching, Mutations for data writing, and Subscriptions for active data pushing from the server on updates ( which requires a web-socket connection).
There are 3 main reasons I propose GraphQL as an API integration layer:
To allow fast load times for potential large lists of runs data, I propose setting up a cache infrastructure within the FE app to minimise the amount of data to be fetched on each query. This can be done via setting up a FE client that comes with a built in cache to store queried data for state management within the app.
The following are a list of libraries that provides a FE client with in built caching solution:
Apollo Client (GraphQL only)
Apollo client for React is the most commonly used state management library to manage and organize local and remote data for GraphQL within a FE application. It allows declarative data fetching and writing ( via GraphQL queries, mutations and subscriptions), while providing a normalised cache in storing data locally for optimising network requests.
PROS:
useQuery methods, as long as a web-socket connection is available for endpoint, meaning minimal effort to get our real time connection setupCONS:
URQL + GraphCache (GraphQL only)
URQL is another GraphQL client that adopts a very similar syntax with Apollo for its graphQL operations, yet takes a more customizable approach rather than Apollo's more generic approach, especially towards data caching.
The main difference between URQL and Apollo is that URQL uses the document-based cache by default, with the option of adopting a normalized cache (GraphCache). ( in short, Document caching works well for content heavy single pages, while a normalized cache will handle more dynamic and heavy data intensive apps that is more suited for state management.)
PROS:
CONS:
The main decision between the adoption of Apollo vs URQL comes down to the preference of our cache. While Apollo provides an extremely easy 'plug and play' approach with a highly functional normalised cache, we might come across problems in customising the cache for our unique state management needs down the line when we migrate our app for our state management to fully rely on the cache. While URQL might requires more setup and customisation work, the flexibility and extensibility it allows meant that we could adopt to whichever specific needs we might come across as the experiment tracking features evolve down the line.
React Query (GraphQL and REST)
React Query is an opinionated data fetching library that takes the simplicity towards data fetching adopted by Apollo towards REST endpoints, including providing a default cache to enable easy server state management. Similar to Apollo client for react, It provides a set of React hooks for data fetching, yet it takes in callbacks in the form of promises / async functions hence allowing the flexibility to fetch data from a REST endpoint.
PROS:
CONS:
RTK Query (GraphQL and REST)
RTK Query is a data fetching and caching tool designed specifically for usage alongside Redux. Similar to React Query, it has taken inspiration from Apollo and other GraphQL in their simplicity towards data fetching, at the same time providing caching capability. Most importantly, it also provides the ability to receive streaming updates for persistent queries (i.e integration with web-sockets) within the redux framework, which takes away a lot of the potential challenges in the complex setup work shall we were to use an external library such as socket.io.
PROS:
createAPI service) hooks directly into the Redux store, hence allowing us to continue the adoption of the redux store for state management.CONS:
Having evaluated through the list of possible options, I believe the implementation of GraphQL as an integration layer is the right solution for us given its simplicity in setting up real time data connection with GraphQL subscriptions. Given the vast amount of data fields associated with a runslist response, the ability to format our data fetching and responses via structured queries in tying to the data needs of our component will greatly help with simplifying the management and future maintenance of that feature.
In terms of the FE client, I would recommend for us to start with Apollo given the minimal amount of setup work required, which will help us set the groundwork in seamlessly integrate GraphQL into our FE codebase. While URQL is definitely a great choice, and most likely a more preferable choice down the line given its extensibility and flexibility, Apollo is a better choice for us to obtain quick wins in building the first iteration of the experiment tracking features. We could revisit the client choice once we hit the stage that requires a more customised cache, which by then a migration would not be hard, given the similarties in syntax between the two libraries.
Below is a brief summary of the possible combinations of the above techcnology in relation to the efforts required and values it brings.

Implementation of GraphQL as an API integration layer
GraphQL integration
GraphQL + FE Client ( Apollo / URQL) + web-sockets

GraphQL + FE Client ( Apollo / URQL) + polling
In the event that websockets are not supported, we can still constant updates via polling ( which will be set up under GraphQL queries.) However, polling is highly inefficient given the extensive and unneccessary amount of requests ( while failing to utilize the beauty and ease of GraphQL subscriptions), and should not be considered unless the implementation of websockets is not an option.

RTK Query + REST + Redux
Data fetching will be managed by RTK query, while state management will still be maintained by the redux store.
React Query + REST + ContextAPI
React Query will handle all data fetching, caching and state management of all server side data, while all app state can either be managed via state hooks, or in a more complex case, via the ContextAPI.
Given that the migration towards GraphQL will have huge implications for all part of the app ( from state management down to mechanisms for data fetching), the fresh start of the runslist feature provides the perfect opportunity to build out this newly proposed FE architecture.
Stage 0: Setup of the GraphQL layer with Apollo client
This is the stage where we laid the foundational work in setting up the GraphQL layer ( schemas and resolvers) between the REST API and the FE app.
Kedro-Viz server: Setting up a GraphQL layer to serve the runslist data
Related tasks:
Kedro-viz FE: Set up of GraphQL Client and its integration with the GraphQL endpoint
This can be done simultaneously alongside the BE work in setting up the new GraphQL endpoint for the runslist data
Related tasks:
By the end of this stage, the app will be in a "hybrid" state in terms of data fetching, where the existing endpoints will still follow the REST protocol, while the setup of the GraphQL infrastructure for the new runslist endpoint provides the perfect setup to build the new features with speed. This is made possible given that the new experiment tracking UI will be available as a separate route ( there will be a further spike on the routing stategy ), allowing us to create a clear seperation of concerns within the codebase.
Please refer to below diagram for a very brief overview of the proposed rollout sequence:

Stage 1: Building the Experiment tracking UI ( detailed tasks TBD with the final design)
Stage 2: Gradual migration of existing endpoints and FE codebase to GraphQL; elimination of Redux setup
Once the setup of our GraphQL infrastructure reaches maturity as it is battle tested with the shipping of the experiment tracking features, we can also start to revisit the other remaining REST endpoints, as well as other main components of the FE app, to slowly migrate towards the 'GraphQL' way in stripping away the complexity of the existing redux setup.
The Run Command information in node panels is invalid or outdated for some use-cases :
For datasets, the panel shows kedro run --to-inputs instead of kedro run --to-outputs (or kedro run --from-inputs).
If a node does not have an explicit name, the generated command line will contain a prettified node name that will not work (ex: kedro run --to-nodes Process Items , for a function process_items()). If it is not possible to reference an unnamed node by the command line, maybe a message could be shown in place of the command in the kedro-viz panel?
A suggestion: For node, it would be practical to show both the kedro run --to-nodes <name> and kedro run --node <name> commands (helps in the discovery of kedro run options)
Those issues should occur with any kedro pipeline (with at least one unnamed node for the second issue).
Include as many relevant details as possible about the environment you experienced the bug in:
If you disable pretty-naming functions are still TitleCased:

Function should be in snake_case
Parameter data sets like parameters.yml are used to have global parameters that are used in many places defined in a single place, thereby avoiding redundancy.
This also means that a global parameters node is linked to many nodes in the data pipelines. This may make pipeline diagrams less readable.
Please add the option to hide parameter nodes.
Improve readability of pipeline diagram.
The --pipeline argument throws an error. It seems the latest version of kedro has no attribute '_get_pipeline' under KedroContext.
Reference:
https://github.com/quantumblacklabs/kedro/blob/c5ccb630c4da17c22f699d35777e36877c088379/kedro/framework/cli/utils.py
I am trying to view a specific pipeline
kedro run --pipeline <pipeline_name>kedro viz --pipeline <pipeline_name>A kedro viz server should be launched to view the specific pipeline
Error message:
kedro.framework.cli.utils.KedroCliError: 'KedroContext' object has no attribute '_get_pipeline'
Run with --verbose to see the full exception
Error: 'KedroContext' object has no attribute '_get_pipeline'
As per title, kedro viz command fails when kedro plugin with automatic hook discovery (kedro.hooks entry point) is installed (see traceback below).
During the kedro viz the kedro_viz/server.py in _call_viz is getting the project context (context = get_project_context("context", env=env), line 511). This function in core Kedro is returning a deep copy of the context. Deep copy fails when calling __reduce_ex__ that's being getattr-ed from Pluggy's DistFacade class. DistFacade is overwriting the __getattr__ and __dir__ dunders to include _dist in it's dictionary and I think this is where the problem lies, but I don't know how or where to fix this or even if I'm submitting an issue in the right place. kedro viz is failing due to this issue hence I'm submitting a bug report here, but it might be as well a bug in Kedro Core or Pluggy.
I created a minimal kedro plugin and a minimal kedro project which you can use to investigate.
git clone https://github.com/kaemo/kedro-minimal-plugingit clone https://github.com/kaemo/kedro-minimal-projectcd kedro-minimal-plugin && make setup && make buildcd ../kedro-minimal-project && python -m venv .venv && source .venv/bin/activate && python -m pip install kedro && kedro install && python -m pip install ../kedro-minimal-plugin/dist/kedro_minimal_plugin-0.0.1-py3-none-any.whlkedro vizA web app should start and Kedro Viz app should be open in a web browser.
❯ kedro viz
2020-09-03 13:20:15,688 - root - INFO - Registered hooks from 1 installed plugin(s): kedro-minimal-plugin-0.0.1
Traceback (most recent call last):
  File "/Users/olszewk2/dev/kedro-minimal-project/.venv/lib/python3.8/site-packages/kedro_viz/server.py", line 468, in viz
    _call_viz(host, port, browser, load_file, save_file, pipeline, env)
  File "/Users/olszewk2/dev/kedro-minimal-project/.venv/lib/python3.8/site-packages/kedro_viz/server.py", line 511, in _call_viz
    context = get_project_context("context", env=env)
  File "/Users/olszewk2/dev/kedro-minimal-project/.venv/lib/python3.8/site-packages/kedro/framework/cli/cli.py", line 663, in get_project_context
    return deepcopy(value)
  File "/Users/olszewk2/miniconda3/lib/python3.8/copy.py", line 172, in deepcopy
    y = _reconstruct(x, memo, *rv)
  File "/Users/olszewk2/miniconda3/lib/python3.8/copy.py", line 270, in _reconstruct
    state = deepcopy(state, memo)
  File "/Users/olszewk2/miniconda3/lib/python3.8/copy.py", line 146, in deepcopy
    y = copier(x, memo)
  File "/Users/olszewk2/miniconda3/lib/python3.8/copy.py", line 230, in _deepcopy_dict
    y[deepcopy(key, memo)] = deepcopy(value, memo)
  File "/Users/olszewk2/miniconda3/lib/python3.8/copy.py", line 146, in deepcopy
    y = copier(x, memo)
  File "/Users/olszewk2/miniconda3/lib/python3.8/copy.py", line 205, in _deepcopy_list
    append(deepcopy(a, memo))
  File "/Users/olszewk2/miniconda3/lib/python3.8/copy.py", line 146, in deepcopy
    y = copier(x, memo)
  File "/Users/olszewk2/miniconda3/lib/python3.8/copy.py", line 210, in _deepcopy_tuple
    y = [deepcopy(a, memo) for a in x]
  File "/Users/olszewk2/miniconda3/lib/python3.8/copy.py", line 210, in <listcomp>
    y = [deepcopy(a, memo) for a in x]
  File "/Users/olszewk2/miniconda3/lib/python3.8/copy.py", line 161, in deepcopy
    rv = reductor(4)
TypeError: 'NoneType' object is not callable
Error: 'NoneType' object is not callable
Kedro viz not able to open to public access?
How has this bug affected you? What were you trying to accomplish?

It can be access with host=0.0.0.0
The server stuck at first log message, and not able top open the viz.

Include as many relevant details as possible about the environment you experienced the bug in:
kedro viz --load-file not working properly
How has this bug affected you? What were you trying to accomplish?
I want to save Kedro Viz into a json and load from it, as shown in Kedro documentation.
kedro viz --save-file my_shareable_pipeline.jsonkedro viz --load-file my_shareable_pipeline.jsonWebsite rendering pipeline
Error website with this content:
{"detail":"Not Found"}
Include as many relevant details as possible about the environment you experienced the bug in:
Dependency conflict with PyYAML.
Kedro requires PyYAML>=5.1, <6.0 while various AWS libraries require in the range PyYAML<4.3,>=3.10.
This is the same issue encountered here: kedro-org/kedro#36
Looking to relax the requirements here:
https://github.com/quantumblacklabs/kedro-viz/blob/develop/package/test_requirements.txt
I'm unable to visualize my project, with the error:

pip install kedro sagemaker kedro-vizkedro vizThis should launch the kedro viz.
Fails when checking dependencies, see error above.
Include as many relevant details as possible about the environment you experienced the bug in:
The successful setup and transition towards data-fetching with Graphql and state management with react hooks within the experiment-tracking features resulted in a new set of clean and highly readable code that are highly reusable ( compared to the redux setup that is highly entangled with the redux store.)
With third party consumption of the Kedro-Viz flowchart being one of the most discussed use case for Kedro-Viz, this poses the benefits of refactoring the existing redux setup for the flowchart towards local state management with graphql for data fetching. Yet, the current logic of the graph calculations are tightly entangled within the selectors within the redux setup which poses a series of challenges for the refactoring work that requires careful investigation.
This issue is to investigate and explore the different stages for conducting this work in migrating away from the redux setup.
Redux has been utilized heavily in the state management and data ingestion of the flowchart (see this section in the architecture docs) . All local state of the app, as well as the logic of the calculation of flowchart nodes, modular pipeline tree and input to the layout engine, are all managed and tightly coupled within the selectors in the redux setup.
The redux setup poses the following problems:
This tightly coupled setup of in-app logic within selectors and the redux state makes it impossible to extract the flowchart, node-list sidebar and all related components for reusability as individual components outside the context of Kedro-Viz, as a local store will always need to be included with the component.
The redux setup introduces an excessive amount of code and complexity into the codebase - the set of code to initialisation the set up of the local store, the need to introduce a series of actions, reducers, and selectors, as well as the additional amount of code within the components to consume the local store, all introduces the unnecessary effort to maintain excessive amount of code down the line. ( This is very apparent compared to the amount of set up code with graphql in the new experiment tracking features, which only requires the simple apollo client setup.)
It is never good to have two drastically different data ingestion and state management protocols within the same codebase. For sake of simplicity and maintenance down the line, we will have to migrate away from this one way or another.
Before designing a solution, here are the set of challenges specific to the current state of the app that we need to consider in the design:
Currently the data ingestion from the rest endpoint are all handled by the redux setup, with the huge object containing all nodes and edges returned from the /main endpoint for rendering the flowchart all broken down into subsequent data fields used in the calculation of the flowchart. The new solution must be able to replace Redux's function in the breakdown, sorting and update of the flowchart data in real time as the user switches between pipelines.
It will also need to replace Redux's function in the handling of reading from and updates to the localStorage.
All global app state setup, such as theme and selected nodes, are tied in to the redux store - those states will need to be striped out and re-set up within the app, either as a react hook, or using the Context API.
The consumption of data for components ( such as nodes, edges, themes, etc) are all reliant on the redux store - the new setup will require refactoring of all components to use the new data ingestion and local/global state setup.
One important point is that our current architecture for the flowchart page is very tightly coupled, where the component set up is not very scoped for reusability ( i.e it is being set up with a lot of custom setup specifically for Kedro-Viz) - this refactoring work would pose great opportunity to reconsider and refactor those components better suited for reusability in a different context.
The flowchart itself, and the control sidebar of the flowchart (node-list components) had its logic deeply nested within the selector setup in utilizing this to initiate recalculation on updates of global states from user selection. Stripping it away from the redux setup would mean a total rewrite of the logic in pure JS functions, as well as setting up new hooks within the components to initiate the recalculation on app state updates.
As a result of the above 4 challenges, here are some of the key concepts that will be adopted in the design to solve the issues above
Here are some of the core concepts that will be adopted in the design:
The easiest and least disruptive way is to set up a graphql API layer that sits on top of the legacy Rest API, with it replacing the data ingestion layer within the current Redux setup. The graphql API layer will also contain the selector logic in the form of resolvers in providing data in the required format by the individual components.
This arrangement allows the separation of concern in moving the data logic away from the app into a separate layer that handles all logic calculation, allowing us to move towards a more loosely coupled FE architecture of UI components and calculation logic.
One of the key advantages of the redux store setup is the ability to set up global state variables that will trigger real time updates via the dispatch of actions. Within the Apolllo client setup, this can be achieved via setting up Reactive variables for global state management ( such as states to indicate the ‘selected node’, ‘clicked node’, ‘hovered node’, etc)
Updating the reactive variable will trigger the update of the apollo calculation, and in turn trigger the apollo client and cache to update the set of related data according to the reactive variable, similar to the dispatch of actions within the redux setup.
The current UI components are set up to ingest data from selectors; each selector could be mapped directly into a graphql query, with the logic within the selector to be implemented within the resolvers in the graphql api layer.
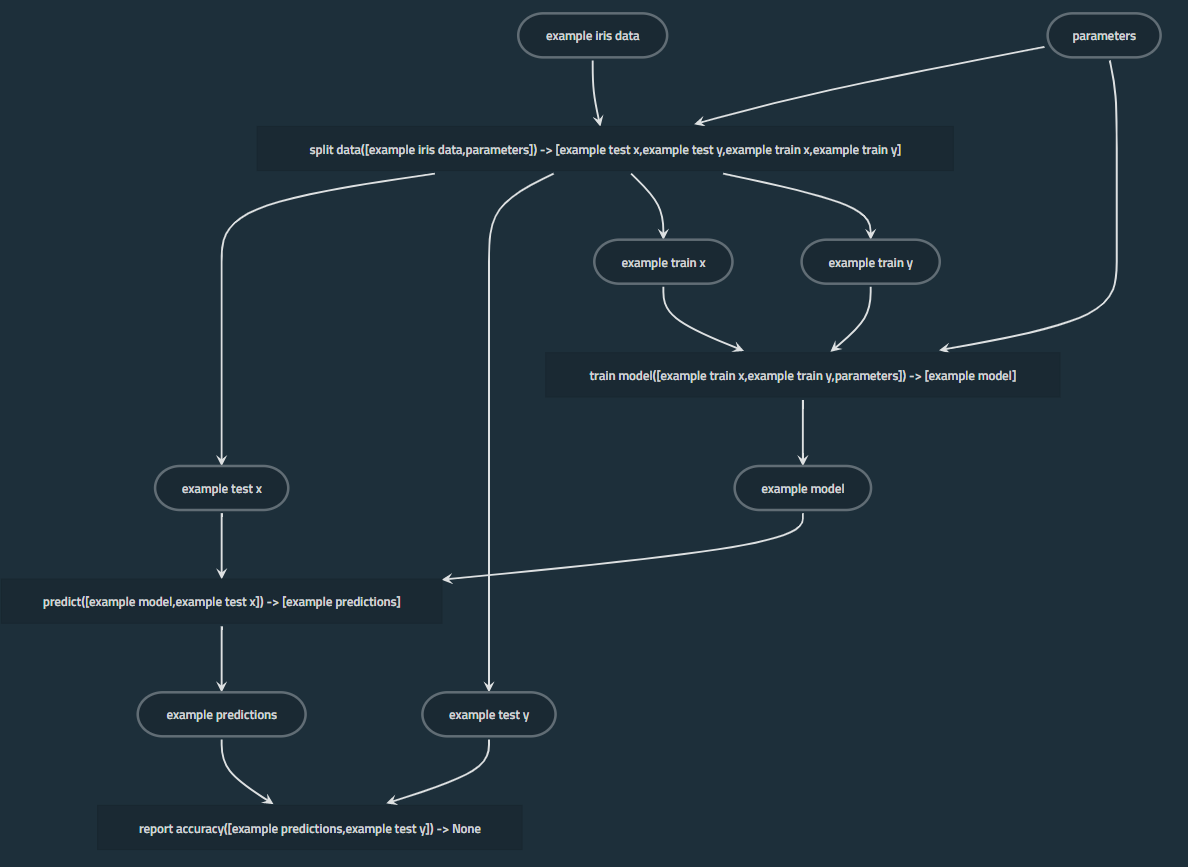
The following diagram illustrates the new architecture with the implementation of the above three key concepts:

Diagram depicting the new data flow via the GraphQL API layer

Diagram depicting the new app architecture
In the meantime, please refer to our architecture docs for the existing data ingestion and architecture setup for your comparison.
The alternative is to replace the REST API directly with a graphql endpoint.
However, that is not desirable given the following reasons:
Other than setting up reactive variables, we can also rely on the use of react hooks or the context API for app state management.
Given the complex and reliance on the redux setup, the core idea of the implementation is to slowly strip away the reliance of the UI component to obtain data via props fed by selector methods.
This milestone mainly focuses on setting up the Graphql API layer to ingest the JSON data object into meaningful format ( groups of nodes and edges) as consumed by the app. This entails the set up of basic resolvers and schema to return a fixed set of nodes and edges to simulate the data returned by the basic selectors.
This also requires configuration of the apollo client cache to allow it to read and write from the localStorage and connect with the webworker.
This milestone will focus on migrating the existing core logic of the selector setup heavily utilized in the node-list and flowchart component into reducers within the graphql API layer.
This will also involve setting up related queries to structure the data requirements for UI components as fulfilled previously by the selectors.
As the title states, this milestone will mainly focus on migrating the global states via the set up of reactive variables, slowly stripping away the reliance of UI components on the redux store.
After having stripped away all selectors and global states within the redux store, it is safe to completely strip out all redux store setup to fully migrate to the new architecture.
This will leave us with a cleaner and highly readable codebase, with better separation of concerns and a loosely coupled architecture that allows adaptability and reusability in enabling faster development down the line.
The change is entirely backwards compatible given that the mechanisms for data input via the REST API or a JSON data file remains the same, and all changes still sits within the context of the Front End.
kedro-viz changes the node names apparently by pretty_name function, but it is often the case that the original node names are better.
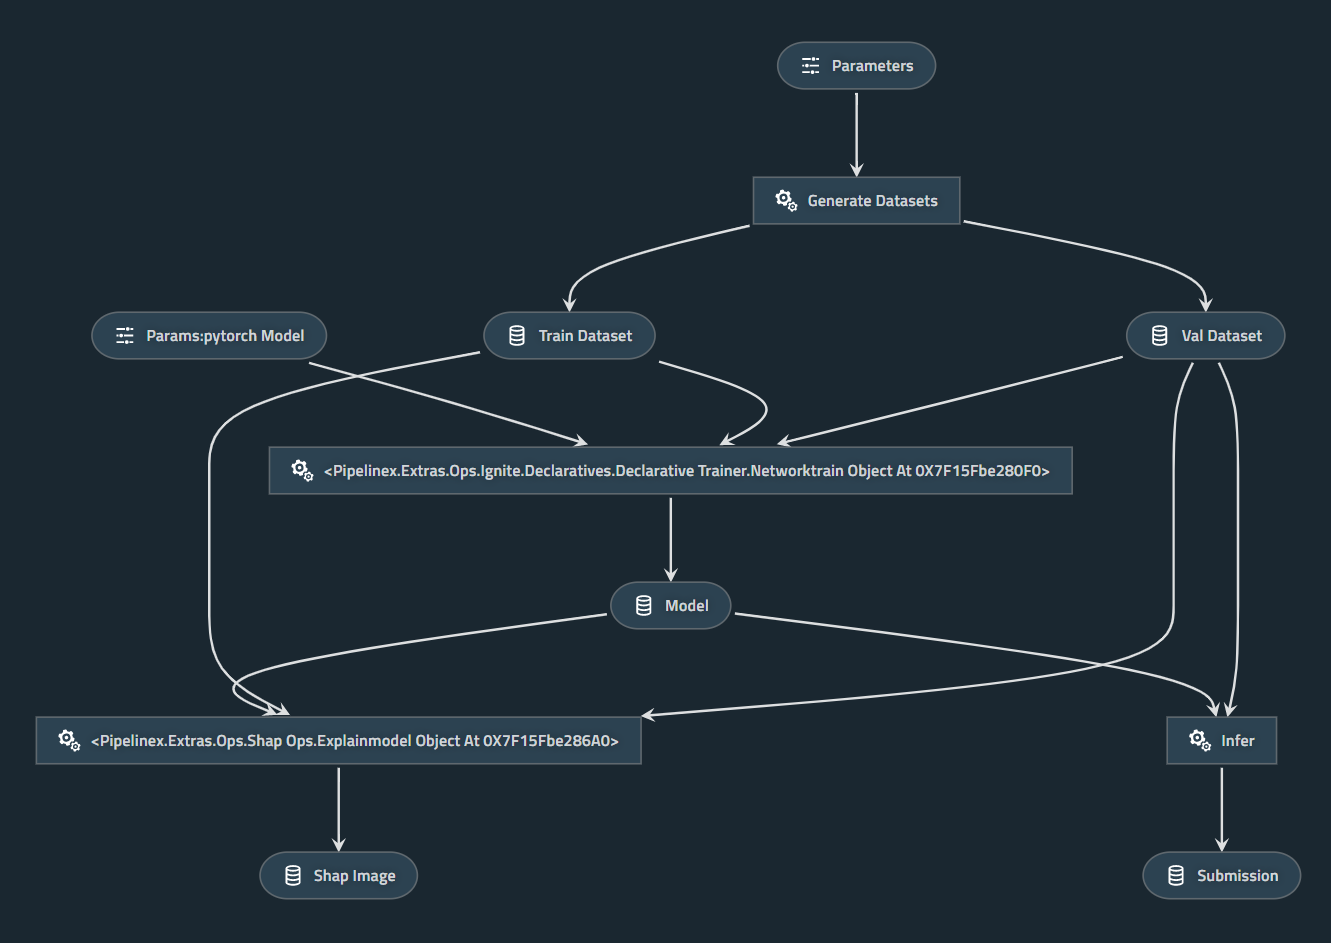
(Image from https://github.com/Minyus/pipelinex_pytorch)
As shown in the visualized pipeline above,
params:pytorch_model became Params:pytorch Model, which is not desirable.pipelinex.extras.ops.ignite.declaratives.declarative_trainer.NetworkTrain became Pipelinex.Extras.Ops.Ignite.Declaratives.Declarative Trainer.Networktrain, which is not desirable.Remove pretty_name function.
Add a new arg to allow disabling pretty_name transform.
kedro viz fails to launch if a modular pipeline contains a transcoded dataset.
How has this bug affected you? What were you trying to accomplish?
Launch kedro viz in a project with a modular pipeline containing transcoded dataset. Observe that it throws an exception as follow:
Traceback (most recent call last):
  File "/Users/lim_Hoang/opt/anaconda3/envs/kedro-viz38/lib/python3.8/multiprocessing/process.py", line 315, in _bootstrap
    self.run()
  File "/Users/lim_Hoang/opt/anaconda3/envs/kedro-viz38/lib/python3.8/multiprocessing/process.py", line 108, in run
    self._target(*self._args, **self._kwargs)
  File "/Users/lim_Hoang/Projects/kedro-viz/package/kedro_viz/server.py", line 83, in run_server
    populate_data(data_access_manager, catalog, pipelines, session_store_location)
  File "/Users/lim_Hoang/Projects/kedro-viz/package/kedro_viz/server.py", line 42, in populate_data
    data_access_manager.add_pipelines(pipelines)
  File "/Users/lim_Hoang/Projects/kedro-viz/package/kedro_viz/data_access/managers.py", line 85, in add_pipelines
    self.add_pipeline(registered_pipeline_id, pipeline)
  File "/Users/lim_Hoang/Projects/kedro-viz/package/kedro_viz/data_access/managers.py", line 151, in add_pipeline
    self.modular_pipelines.add_output(
  File "/Users/lim_Hoang/Projects/kedro-viz/package/kedro_viz/data_access/repositories.py", line 331, in add_output
    raise ValueError(
ValueError: Attempt to add a non-data node as input to modular pipeline transcoding
Kedro Viz should launch successfully.
An exception was thrown.
Include as many relevant details as possible about the environment you experienced the bug in:
Unpin pylint and make use of improved pylint features by updating the line
pylint>=2.3.1, <2.4.0 # 2.4.1 doesn't work for Python 3.5, and requires investigation.
in test_requirements.txt
Similar to how it was done in https://github.com/quantumblacklabs/kedro-docker/pull/22
First off, Love the package. It really makes Kedro shine for really large projects. Kedro definitely would not be the same without kedro-viz
Tabbing into a KedroViz Component jumps into the body first (nodes and data) instead of the sidebar. Is this intentional? It's something that did not feel right to me, definitely not a show stopper if this is how KedroViz is intended to behave.
Tab into a KedroViz Component.
Tabbing into the KedroViz component should start with the sidebar and allow me to narrow down my nodes before tabbing into them.
I found this on chrome while embedding a KedroViz component inside of a gatsby app.
Not sure that I am allowed to add labels, but Priority: Low and possibly Type: Discussion seems applicable
Installing kedro-viz under Python 3.8 is not possible.
Python 3.8 support of kedro has been added recently. kedro-viz does not support Python 3.8 yet: python_requires=">=3.6, <3.8",
Successful installation of kedro-viz.
Installation aborts.
$ kedro --version
kedro, version 0.16.1
$ pip3 install --user kedro-viz
ERROR: Could not find a version that satisfies the requirement kedro-viz (from versions: none)
ERROR: No matching distribution found for kedro-viz
Include as many relevant details as possible about the environment you experienced the bug in:
Some users has reported problems with installing Kedro-Viz on Windows. Example:

I think this only happens when running kedro install instead of a normal pip install
I need to reproduce this first.
Tell us what should happen.
Tell us what happens instead.
-- If you received an error, place it here.
-- Separate them if you have more than one.
Include as many relevant details as possible about the environment you experienced the bug in:
One of trufflehog's dependencies dependency upgraded itself and broke everything (see trufflesecurity/trufflehog#200).
We've pinned it inside test_requirements as a temporary workaround, but it is fixed in their side. So we would like to remove the line in test_requirements.txt
gitdb2==3.0.0 # pin trufflehog dependency to get it working for now https://github.com/dxa4481/truffleHog/issues/200
While doing this, remember to bump the lower bound of trufflehog.
I just want to run run_viz with --host 0.0.0.0 option.
there is no auto-reload option. so just %reload_kedro and %run_viz in notebooks are very easy to see my visualized pipeline.
but I run kedro in a docker container in a remote server, so the host option should not be the default 127.0.0.1.
I use npm install Kedro-viz, how can I change node icon by using JS or using antd icon to cover it

I'm always frustrated when I'm running daily or weekly sets of modular pipelines and my final output does not make complete sense. This indicates that there was an issue when running the pipeline but I'm not sure, at a glance, what step didn't provide output.
One example problem: one initial dataset had the mapping of market IDs. One day, the market ID for our second biggest market was omitted from the first step, causing all subsequent downstream analysis to be off by a nontrivial amount.
This change is important to me because it would help me, at a glance, identify changes across runs through visual cues, so I know where to begin.
Visualize the total size of each dataset that has been processed via kedro viz:
The day that things ran correctly:

The day that things failed:

Would be nice to also visualize the nodes that had been attempted to run, but failed

In this example, by visualizing the size of each step that had been run, you would immediately see that the data set with the biggest difference was the companies set. Even though the pipeline strictly failed a step later, you would immediately know where to start debugging.
When trying to visualize a specific pipeline, no visualization is created.
How has this bug affected you? What were you trying to accomplish?
I would like to be able to visualize the various sub-pipelines in my project
A visual of the named pipeline should appear in the browser window
kedro viz tab opens with no visualized pipeline. If I do kedro viz then my default pipeline shows up fine. If I do kedro viz --pipeline __default__, it works. In fact, any pipeline can be visualized if I change it's key in the pipeline registry to 'default'.
If I run kedro viz --pipeline <pipeline_name>, open blank visual in chrome ctrl-c in command window then run kedro viz it will show me the previously named pipeline rather than the default pipeline.
-- If you received an error, place it here.
INFO: 127.0.0.1:49846 - "GET /manifest.json HTTP/1.1" 404 Not Found
-- Separate them if you have more than one.
Include as many relevant details as possible about the environment you experienced the bug in:
Short description of the problem here.
How has this bug affected you? What were you trying to accomplish?
pipx run kedro newparameters.ymlkedro viz does workkedro viz is now brokenkedro viz should provide an error that is more intuitive and leads the user to knowing that a parameter is misspelled or potentially missing.
KedroParameterError: typo is not a valid parameter, see valid parameters with `catalog.list('params')
kedro viz gives a very obscure error that is not very intuitive without reading the server.py source.
~/git/misspelled-params via 🐍 v3.8.8 via ©misspelled-params took 16s
❯ kedro viz
2021-05-04 21:27:49,539 - kedro.framework.session.store - INFO - `read()` not implemented for `BaseSessionStore`. Assuming empty store.
fatal: not a git repository (or any of the parent directories): .git
2021-05-04 21:27:49,620 - kedro.framework.session.session - WARNING - Unable to git describe /home/waylon/git/misspelled-params
/home/waylon/miniconda3/envs/misspelled-params/lib/python3.8/site-packages/kedro/framework/context/context.py:60: DeprecationWarning: Accessing pipelines via the context will be deprecated in Kedro 0.18.0.
  warn(
Traceback (most recent call last):
  File "/home/waylon/miniconda3/envs/misspelled-params/lib/python3.8/site-packages/kedro_viz/server.py", line 755, in viz
    _call_viz(host, port, browser, load_file, save_file, pipeline, env)
  File "/home/waylon/miniconda3/envs/misspelled-params/lib/python3.8/site-packages/kedro_viz/server.py", line 816, in _call_viz
    _DATA = format_pipelines_data(pipelines)
  File "/home/waylon/miniconda3/envs/misspelled-params/lib/python3.8/site-packages/kedro_viz/server.py", line 333, in format_pipelines_data
    format_pipeline_data(
  File "/home/waylon/miniconda3/envs/misspelled-params/lib/python3.8/site-packages/kedro_viz/server.py", line 458, in format_pipeline_data
    _add_parameter_data_to_node(dataset_full_name, task_id)
  File "/home/waylon/miniconda3/envs/misspelled-params/lib/python3.8/site-packages/kedro_viz/server.py", line 542, in _add_parameter_data_to_node
    parameter_value = _get_dataset_data_params(dataset_namespace).load()
AttributeError: 'NoneType' object has no attribute 'load'
kedro.framework.cli.utils.KedroCliError: 'NoneType' object has no attribute 'load'
Run with --verbose to see the full exception
Error: 'NoneType' object has no attribute 'load'
Include as many relevant details as possible about the environment you experienced the bug in:
I have replicated this issue in this repo WaylonWalker/kedro-misspelled-params-. You should be able to clone the repo and replicate the error message.
Currently importing and using mockState in tests will cause the 'announceFlags' test to fail. This is because the pipeline field within flags in the mock state are assigned to true which does not match the default state as set up in the config file. ( this is previously set up to enable other tests.). To solve this, we would need to add checks within the config file to assign different default values for flags under testing scenarios.
This bug has caused test to fail while working on KED-1941 when we needed to import and use mockState within the tests
mockState into app.test.jsit announces flags test will failOn fixing the bug, different default values will be assigned for flags which would not cause any tests to fail.
The it announces flags test fails ( see below)

kedro viz fails if circular dependencies between layers exist.
Example:
toposort.CircularDependencyError: Circular dependencies exist among these items: {'feature':{'intermediate', 'primary'}, 'intermediate':{'primary'}, 'model':{'intermediate', 'primary', 'feature', 'model_input'}, 'model_input':{'intermediate', 'primary', 'feature'}, 'model_output':{'intermediate', 'primary', 'feature', 'model_input', 'model'}, 'primary':{'intermediate'}, 'reporting':{'intermediate', 'primary', 'feature', 'model_input', 'model_output', 'model'}}
Error: Circular dependencies exist among these items: {'feature':{'intermediate', 'primary'}, 'intermediate':{'primary'}, 'model':{'intermediate', 'primary', 'feature', 'model_input'}, 'model_input':{'intermediate', 'primary', 'feature'}, 'model_output':{'intermediate', 'primary', 'feature', 'model_input', 'model'}, 'primary':{'intermediate'}, 'reporting':{'intermediate', 'primary', 'feature', 'model_input', 'model_output', 'model'}}
At this point a graph visualization of the pipeline would really help to spot and remove the cycle, but... you see the problem, there is a circular dependency here too.
Circular dependencies are easy to introduce by accident in complex pipelines and difficult to find. They do not necessarily lead to pipeline failure with kedro run, so they turn up much later when trying to run kedro viz again.
This partially helped me find a circular dependency, but still required additional knowledge to fix it:
dependencies = {'feature':{'intermediate', 'primary'}, 'intermediate':{'primary'}, 'model':{'intermediate', 'primary', 'feature', 'model_input'}, 'model_input':{'intermediate', 'primary', 'feature'}, 'model_output':{'intermediate', 'primary', 'feature', 'model_input', 'model'}, 'primary':{'intermediate'}, 'reporting':{'intermediate', 'primary', 'feature', 'model_input', 'model_output', 'model'}}

import networkx
dependency_graph = networkx.DiGraph(dependencies, )
networkx.algorithms.cycles.find_cycle(dependency_graph)
My team ran twice into the same problem: we rely on some parameters that are not in any Kedro catalog.yaml so as to force the user to provide them via the cli (and --params). As a consequence kedro-viz can't infer their type and raises the following Error that is hard to link with the offending parameter(s).
kedro_viz/server.py", line 427, in format_pipeline_data
    parameter_value = _get_dataset_data_params(namespace).load()
AttributeError: 'NoneType' object has no attribute 'load'
Error: 'NoneType' object has no attribute 'load'
Catching the error to augment it with the name of the parameter that causes the issue.
(Optional) Providing a default handling for missing definitions? But I could understand that not specifying the parameter in any parameters.yaml is abusing the way Kedro works
Right now we manually update the CSS + declaration order.
Important to have consistency in our CSS files as we have in our JS files.
Use something like https://github.com/prettier/stylelint-prettier (since we have prettier already enabled)
Manually order
Stylelint fix
I found that when I disable datasets in the "element types" menu, Kedro viz cuts off the left side of the diagram when exporting to png or svg. This causes some edges in the diagram to be be cut off as a result.
I was trying to export the kedro viz diagram for some of my pipelines for including them in my documentation. I would like to use the export function instead of a screenshot because this allows me to export as SVG.
kedro vizThe exported diagram should be exported as svg or png, with all nodes and edges visible
The exported diagram has some cut off edges, because the left side of the diagram is cut off
-- If you received an error, place it here.
-- Separate them if you have more than one.
Include as many relevant details as possible about the environment you experienced the bug in:
It would be nice to have the option of run kedro-viz on a server and update the visualization according to the changes in the code.
When working in large teams sometimes it is necessary to have an actual picture of how is the current code. Now, as a team, we keep a screenshot of the pipeline in confluence, but when multiple changes occurring, it is difficult to keep it up to date.
Somehow have a CI, who updates the server where kedro-viz is running with the current changes each time there is a commit on master.
An alternative could be to have a debug mode, that works like this: when running locally, each time that there is a change in the pipeline, reload the server with the new changes kedro-viz --debug=true
There currently does not seem to exist a built-in way to viz non-default pipelines.
The current work-around is to change the default pipeline in the kedro project code.
It would be great to viz alternative pipelines without touching code.
I would like to have a function that receives an Instance of a Kedro Pipeline and exports it as PNG.
Why is this change important to you? How would you use it? How can it benefit other users?
I will use it from a Notebook to visualize my pipeline object into the same cell. So there is no need to open ports to visualise the pipeline.
Is your feature request related to a problem? A clear and concise description of what the problem is: "I'm always frustrated when ..."
Currently Viz only supports a small subset of Plotly.js plots, because there is a push to limit the bundle size. It would be useful to understand two things:
(1) How difficult it is to make the bundle size and optional dependency of Kedro Viz?
(2) Which plots do users want to use and can't?
(Optional) Suggest an idea for implementing the addition or change.
Perhaps there is a way of doing this in the same way we do pip install "kedro[pandas]" on the python side.
I am trying to visualize a pipeline with transcoded datasets.
It seems that I am getting two issues:
catalog.yml:
database:
  layer: raw
  type: pandas.ParquetDataSet
  filepath: "db.parquet"

items@dask:
  layer: interim
  type: dask.ParquetDataSet
  filepath: "items.parquet"

items@pandas:
  layer: interim
  type: pandas.ParquetDataSet
  filepath: "items.parquet"

processed_items:
  layer: interim
  type: pandas.ParquetDataSet
  filepath: "items.parquet"

other:
  layer: processed
  type: pandas.ParquetDataSet
  filepath: "db.parquet"
pipeline_registry.py:
def register_pipelines() -> Dict[str, Pipeline]:
    return {
        "__default__": Pipeline(
            [
                node(process_db, {"df": "database"}, "items@dask"),
                node(process_items, {"df": "items@pandas"}, "processed_items"),
                node(some_other_process, {"df": "processed_items"}, "other"),
            ]
        )
}items@dask --> items@pandas)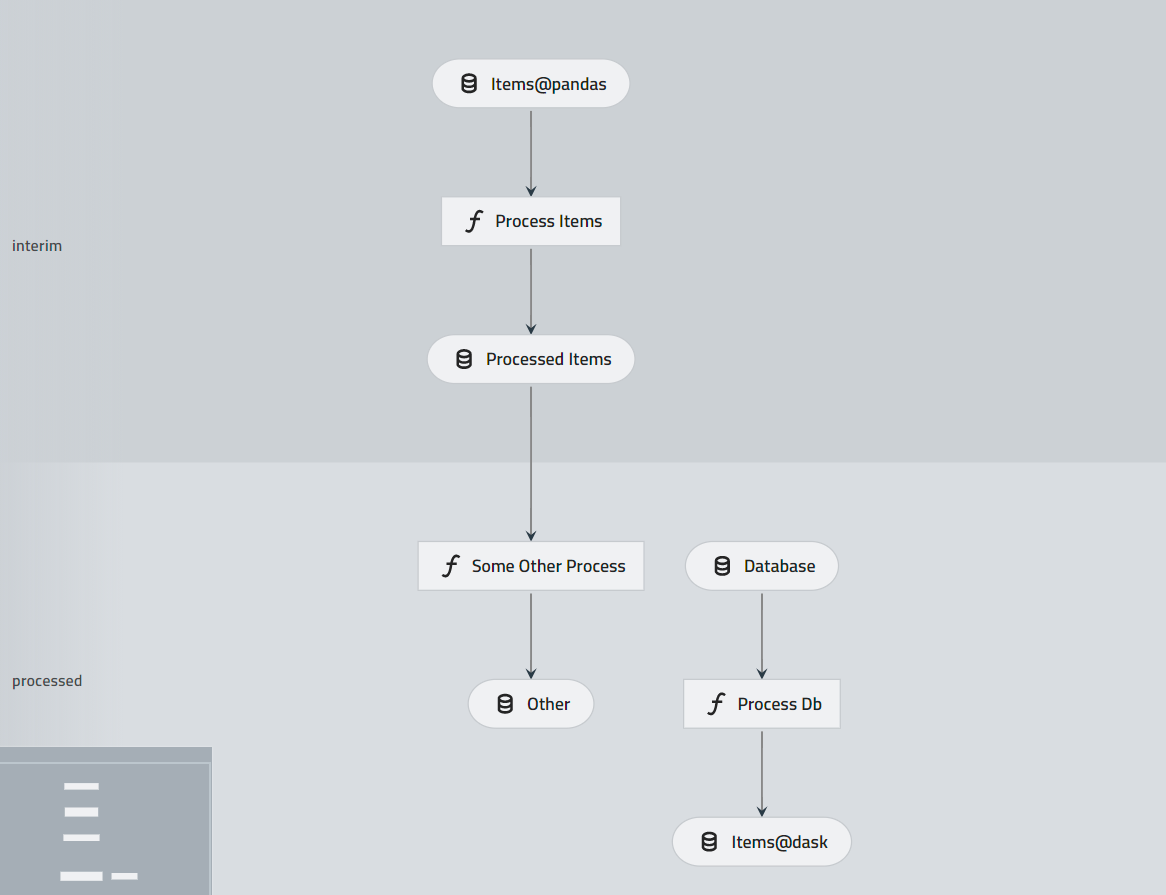
"layer": null)database (processed instead of raw), items@dask (processed instead of raw), items@pandas: (interim instead of raw).raw layer in visualization (and json)items@dask and items@pandas{
"edges": [
{
"source": "945fca12",
"target": "3149b78a"
},
{
"source": "6d613a1e",
"target": "5ef48758"
},
{
"source": "5ef48758",
"target": "0d23f1a2"
},
{
"source": "e4f3fb90",
"target": "9b476c5c"
},
{
"source": "3149b78a",
"target": "e4f3fb90"
},
{
"source": "9b476c5c",
"target": "d0941e68"
}
],
"layers": [
"interim",
"processed"
],
"modular_pipelines": [],
"nodes": [
{
"full_name": "Process Db",
"id": "5ef48758",
"modular_pipelines": [],
"name": "Process Db",
"parameters": {},
"pipelines": [
"__default__"
],
"tags": [],
"type": "task"
},
{
"dataset_type": "kedro.extras.datasets.pandas.parquet_dataset.ParquetDataSet",
"full_name": "database",
"id": "6d613a1e",
"layer": "raw",
"modular_pipelines": [],
"name": "Database",
"pipelines": [
"__default__"
],
"tags": [],
"type": "data"
},
{
"dataset_type": "kedro.extras.datasets.dask.parquet_dataset.ParquetDataSet",
"full_name": "items@dask",
"id": "0d23f1a2",
"layer": null,
"modular_pipelines": [],
"name": "Items@dask",
"pipelines": [
"__default__"
],
"tags": [],
"type": "data"
},
{
"full_name": "Process Items",
"id": "3149b78a",
"modular_pipelines": [],
"name": "Process Items",
"parameters": {},
"pipelines": [
"__default__"
],
"tags": [],
"type": "task"
},
{
"dataset_type": "kedro.extras.datasets.pandas.parquet_dataset.ParquetDataSet",
"full_name": "items@pandas",
"id": "945fca12",
"layer": null,
"modular_pipelines": [],
"name": "Items@pandas",
"pipelines": [
"__default__"
],
"tags": [],
"type": "data"
},
{
"dataset_type": "kedro.extras.datasets.pandas.parquet_dataset.ParquetDataSet",
"full_name": "processed_items",
"id": "e4f3fb90",
"layer": "interim",
"modular_pipelines": [],
"name": "Processed Items",
"pipelines": [
"__default__"
],
"tags": [],
"type": "data"
},
{
"full_name": "Some Other Process",
"id": "9b476c5c",
"modular_pipelines": [],
"name": "Some Other Process",
"parameters": {},
"pipelines": [
"__default__"
],
"tags": [],
"type": "task"
},
{
"dataset_type": "kedro.extras.datasets.pandas.parquet_dataset.ParquetDataSet",
"full_name": "other",
"id": "d0941e68",
"layer": "processed",
"modular_pipelines": [],
"name": "Other",
"pipelines": [
"__default__"
],
"tags": [],
"type": "data"
}
],
"pipelines": [
{
"id": "__default__",
"name": "Default"
}
],
"selected_pipeline": "__default__",
"tags": []
}I was browsing through the implementation of the viz server and noticed that the host variable from the cli does not get passed to webbrowser on line 347.
If the node is wrapped by a decorator, "show code" option will display the source code of the decorator instead.
from typing import Any

import pandas as pd

ID_COLS_TO_NUMERIC = ["cust_id", "customer_id"]

def cast_df(fun: callable) -> callable:
    """Use this decorator to automagically cast dates and ids of all
    pd.DataFrame arguments.

    Example:
        >>> @cast_df
        >>> def my_node(df_1: pd.DataFrame, param_1: str)
        >>> ...

    """

    def _new_fun(*args, **kwargs):
        args = [_cast_if_dataframe(a) for a in args]
        kwargs = {k: _cast_if_dataframe(v) for k, v in kwargs.items()}
        return fun(*args, **kwargs)

    _new_fun.__name__ = fun.__name__
    return _new_fun


def _cast_if_dataframe(df: Any) -> Any:
    if isinstance(df, pd.DataFrame):
        df = _cast_df_columns(df)
    return df


def _cast_df_columns(df: pd.DataFrame) -> pd.DataFrame:
    """Casts columns date columns and id columns."""

    date_columns = [col for col in df.columns if "date" in col.lower()]
    id_columns = [col for col in df.columns if col.lower() in ID_COLS_TO_NUMERIC]
    for date in date_columns:
        df[date] = pd.to_datetime(df[date])
    for i in id_columns:
        df[i] = pd.to_numeric(df[i], errors="coerce")

return df@cast_df
def my_node(x, y):
...When running kedro viz, "Show code" option should display the source code of my_node()
When running kedro viz, "Show code" option displays the source code the decorator:

Include as many relevant details as possible about the environment you experienced the bug in:
Kedro-viz 3.11.0 try to call the method _get_pipeline of KedroContext, which does not exist anymore in Kedro 0.17.3.
Just trying to visualize a simple pipeline.
kedro runkedro vizExpect my browser to open with a pipelien visualization.
Here is the error I get. The pipeline run successfully. The visualization crashes.
Traceback (most recent call last):
  File "/home/ec2-user/.local/share/virtualenvs/api-dyJrA_NI/lib/python3.8/site-packages/kedro_viz/server.py", line 755, in viz
    _call_viz(host, port, browser, load_file, save_file, pipeline, env)
  File "/home/ec2-user/.local/share/virtualenvs/api-dyJrA_NI/lib/python3.8/site-packages/kedro_viz/server.py", line 808, in _call_viz
    pipelines = _get_pipelines_from_context(context, pipeline_name)
  File "/home/ec2-user/.local/share/virtualenvs/api-dyJrA_NI/lib/python3.8/site-packages/kedro_viz/server.py", line 183, in _get_pipelines_from_context
    return {pipeline_name: context._get_pipeline(name=pipeline_name)}
AttributeError: 'KedroContext' object has no attribute '_get_pipeline'
kedro.framework.cli.utils.KedroCliError: 'KedroContext' object has no attribute '_get_pipeline'
I upgraded my project to kedro=0.16.1. However, I'm not able to run kedro viz
How has this bug affected you? What were you trying to accomplish?
kedro install to install all requirementskedro vizTraceback (most recent call last):
File "~/python3.6/site-packages/kedro/framework/cli/cli.py", line 586, in load_entry_points
entry_point_commands.append(entry_point.load())
File "~/python3.6/site-packages/pkg_resources/__init__.py", line 2462, in load
return self.resolve()
File "~/python3.6/site-packages/pkg_resources/__init__.py", line 2468, in resolve
module = __import__(self.module_name, fromlist=['__name__'], level=0)
File "~/python3.6/site-packages/kedro_viz/__init__.py", line 34, in <module>
from kedro_viz.server import format_pipeline_data # noqa
File "~/python3.6/site-packages/kedro_viz/server.py", line 55, in <module>
if KEDRO_VERSION.match(">=0.16.0"):
AttributeError: 'VersionInfo' object has no attribute 'match'
Error: Loading global commands from kedro-viz = kedro_viz.server:commands
Usage: kedro [OPTIONS] COMMAND [ARGS]...
Try 'kedro -h' for help.
Error: No such command 'viz'.
Include as many relevant details as possible about the environment you experienced the bug in:
Thanks,
Opening the side panel by clicking on a PartitionedDataSet results in a ValidationError:
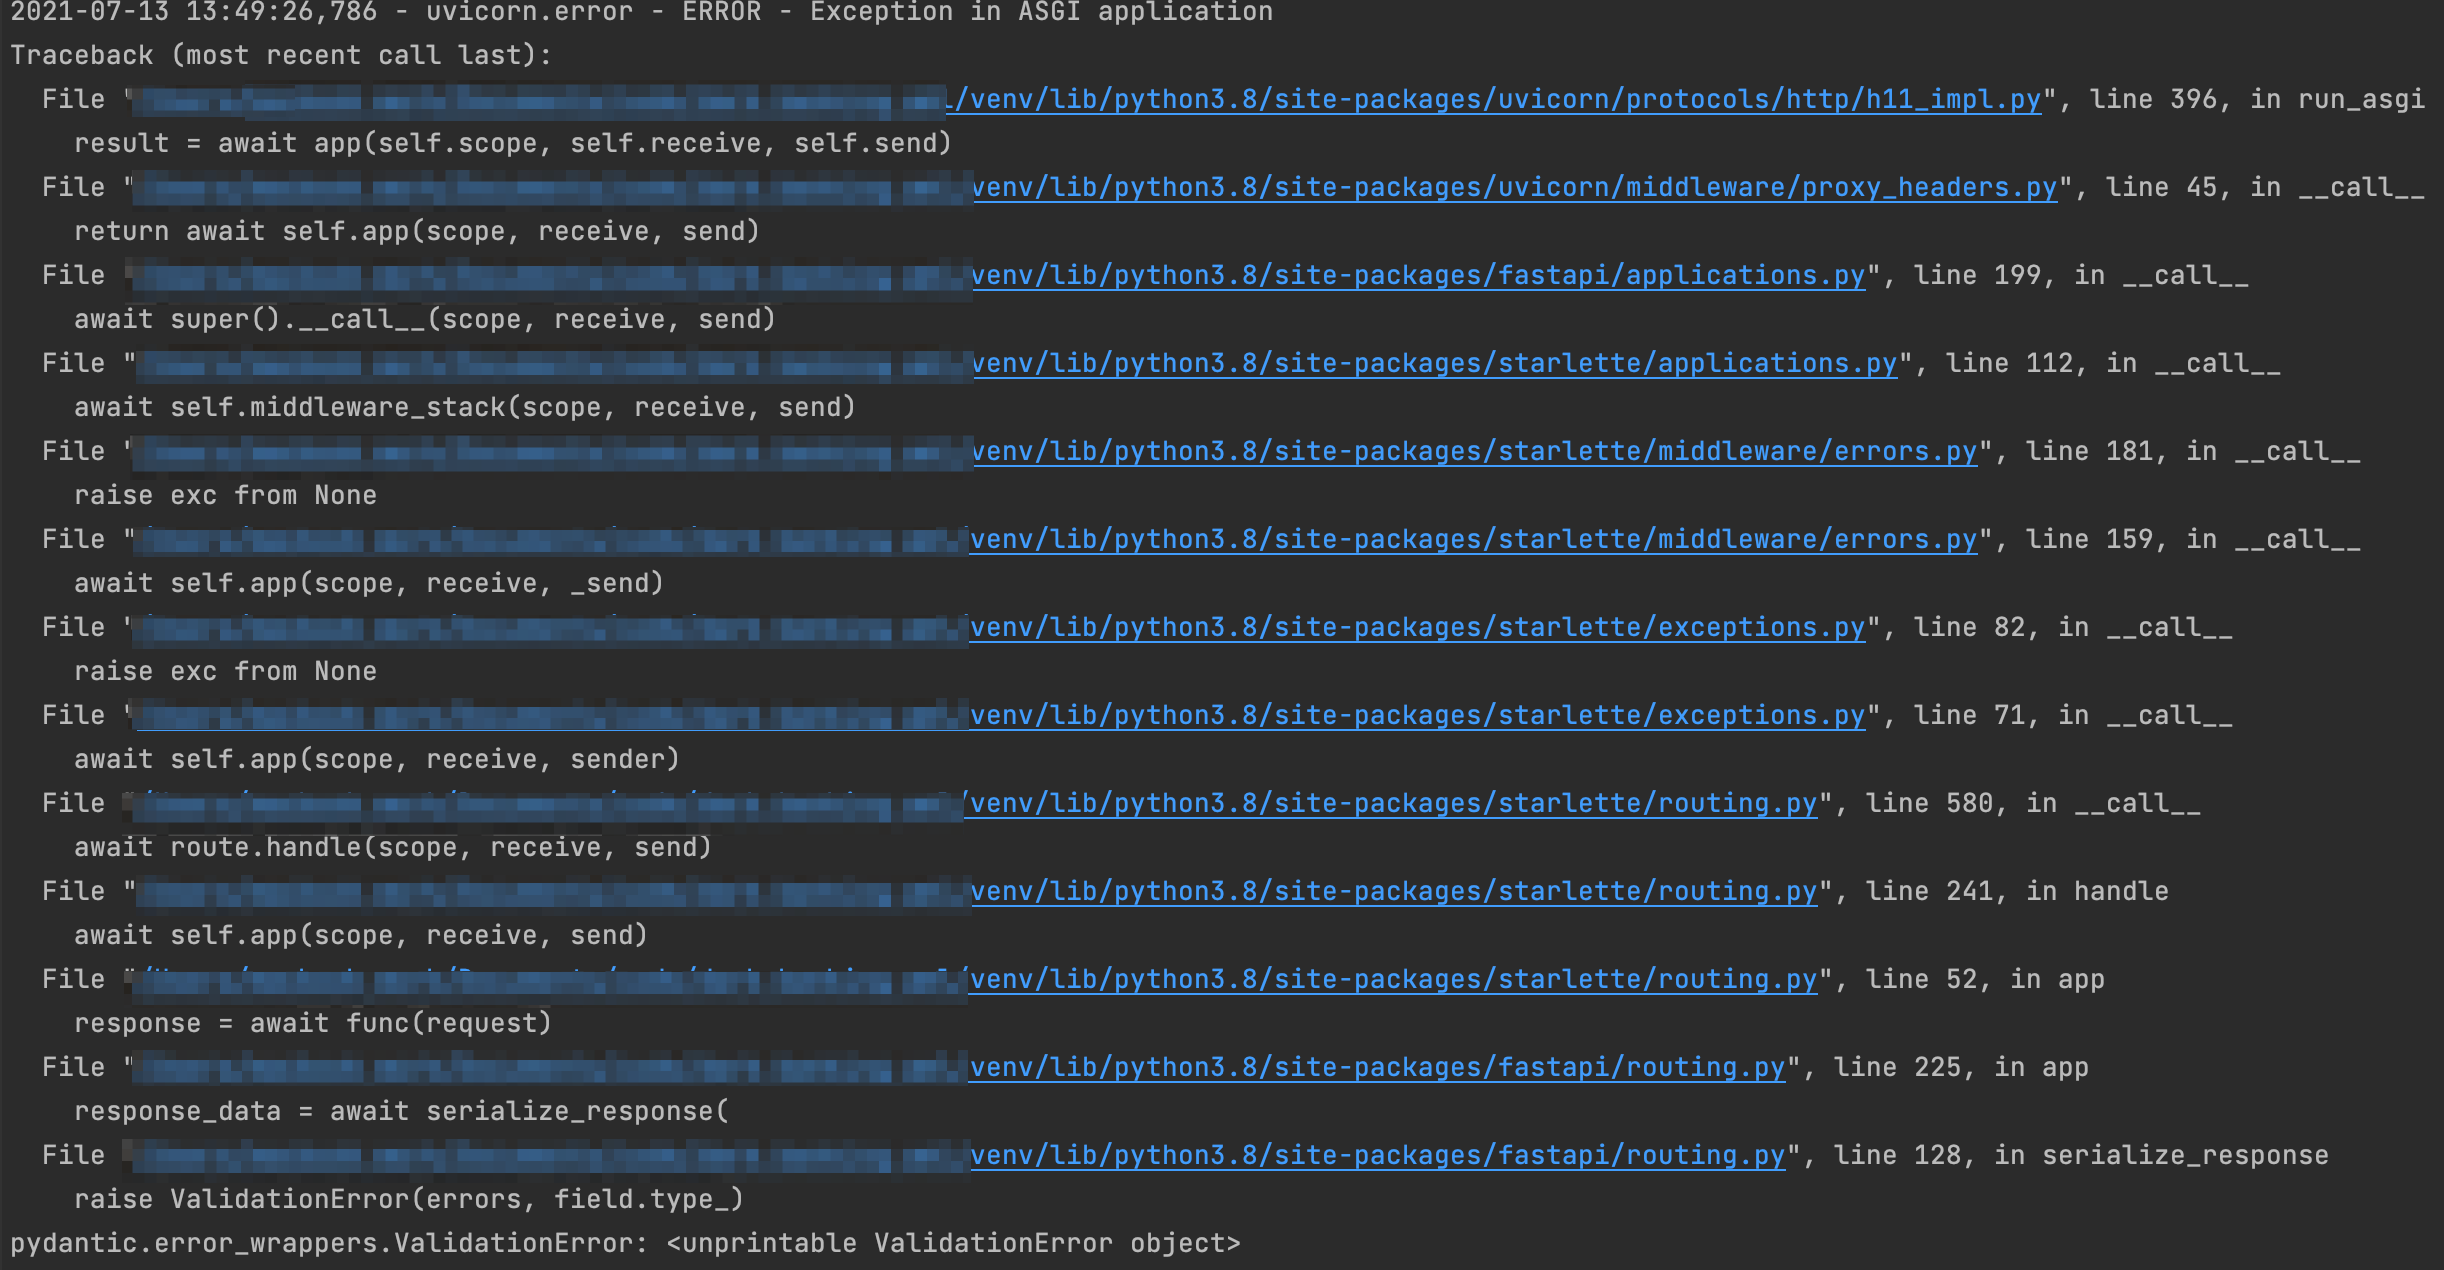
Information for the PartitionedDataSet is not shown in the panel, and the error logs are polluted.
kedro-vizA filled panel as if the dataset wasn't partioned, with a label/tag etc.

2021-07-13 13:53:39,384 - uvicorn.error - ERROR - Exception in ASGI application
Traceback (most recent call last):
  File "/.../venv/lib/python3.8/site-packages/uvicorn/protocols/http/h11_impl.py", line 396, in run_asgi
    result = await app(self.scope, self.receive, self.send)
  File "/.../venv/lib/python3.8/site-packages/uvicorn/middleware/proxy_headers.py", line 45, in __call__
    return await self.app(scope, receive, send)
  File "/.../venv/lib/python3.8/site-packages/fastapi/applications.py", line 199, in __call__
    await super().__call__(scope, receive, send)
  File "/.../venv/lib/python3.8/site-packages/starlette/applications.py", line 112, in __call__
    await self.middleware_stack(scope, receive, send)
  File "/.../venv/lib/python3.8/site-packages/starlette/middleware/errors.py", line 181, in __call__
    raise exc from None
  File "/.../venv/lib/python3.8/site-packages/starlette/middleware/errors.py", line 159, in __call__
    await self.app(scope, receive, _send)
  File "/.../venv/lib/python3.8/site-packages/starlette/exceptions.py", line 82, in __call__
    raise exc from None
  File "/.../venv/lib/python3.8/site-packages/starlette/exceptions.py", line 71, in __call__
    await self.app(scope, receive, sender)
  File "/.../venv/lib/python3.8/site-packages/starlette/routing.py", line 580, in __call__
    await route.handle(scope, receive, send)
  File "/.../venv/lib/python3.8/site-packages/starlette/routing.py", line 241, in handle
    await self.app(scope, receive, send)
  File "/.../venv/lib/python3.8/site-packages/starlette/routing.py", line 52, in app
    response = await func(request)
  File "/.../venv/lib/python3.8/site-packages/fastapi/routing.py", line 225, in app
    response_data = await serialize_response(
  File "/.../venv/lib/python3.8/site-packages/fastapi/routing.py", line 128, in serialize_response
    raise ValidationError(errors, field.type_)
pydantic.error_wrappers.ValidationError: <unprintable ValidationError object>
Include as many relevant details as possible about the environment you experienced the bug in:
I am running the KedroViz react component inside of a gatsby application. When doing so I get an error that window is not available. To resolve this I need to implement a componentDidMount method, and only render KedroViz after the component did mount.
Is it possible to check if window is available before using it? The Error came from config.js#L7, appears to me that it could check for window before using it.
I am running KedroViz 3.2.0, I believe that this is in all versions, and is not related to the new release.
👨💻 index.js
The error occurred in config.js#L7. Without understanding KedroViz further I cannot say that it would not error on other windows. I do see 8 instances of window just by searching the repo.
Thanks for open sourcing everything and making such an amazing set of tools!!
I would like to have the ability to create kedro-viz data and save it to a json file outside of running the kedro-viz server. The main motivation for this is to keep a simple live version of every pipeline my team is maintaining right at our fingertips for anyone to view.
Why is this change important to you? How would you use it? How can it benefit other users?
https://github.com/quantumblacklabs/kedro-viz/blob/develop/package/kedro_viz/server.py#L110
- def get_data_from_kedro():
+ def get_data_from_kedro(pipeline=None):
    """ Get pipeline data from Kedro and format it appropriately """

    def pretty_name(name):
        name = name.replace("-", " ").replace("_", " ")
        parts = [n[0].upper() + n[1:] for n in name.split()]
        return " ".join(parts)

-     pipeline = get_project_context("create_pipeline")()
+    if pipeline == None:
+       pipeline = get_project_context("create_pipeline")()
I looked at making this change but do not understand how kedro-viz gets packaged. I tried to inspect kedro.server, but do not even see get_data_from_kedro
Copy the get_data_from_kedro function into my own codebase and make the change myself. I have done this, but do not want to maintain a "fork" of this function so that we can easily follow any data structure changes.
get_data_from_kedro importableget_data_from_kedroWhen I run kedro viz in a project with SparkContext an error occurs and no graph is shown.
We should view the output of the Kedro Viz command on the browser

Running on:
Python 3.6.9

Hello!
First of all, thank you SO much for such a great project! It has made building large pipelines so much easier.
This is a great-to-have, are there any plans for rendering docstrings (under the "Description (docstirng):" heading in the side panel) in the style of Sphinx documentations? Right now, from what I can see, docstrings are rendered as plain text even if I specify things like param and return.
Please let me know if I have missed anything.
Cheers!
Originally raised here: kedro-org/kedro#56 by @Minyus
I've updated the title with our internal ticket number to keep track of this more easily. :)
An option to include the image of visualized pipelines in the Sphinx document generated by kedro build-docs command
kedro-viz offers kedro viz command that can generate interactive visualized pipelines.
This visualization is very useful to explain to the stakeholders and it is even nicer to automate the manual operation to run kedro viz command, access the URL, take a screenshot, and paste it in the document.
Programmatically communicate with the kedro_viz.server.
Use a graph visualization tool such as graphviz.
I have a teammate without a scroll wheel that was not able navigate a large viz. Would it be possible to add buttons, or some other UI element to control the zoom?
Is your feature request related to a problem? A clear and concise description of what the problem is: "I'm always frustrated when ..."
Users can label their dataset in the catalog and provide layers - but there is very little they can do to differentiate datasets beyond this from a visual perspective. Adding the facility to apply an icon from an existing library of icons would be an effective mechanism for making the pipeline visualisation a clearer and more efficient story-telling tool.
Why is this change important to you? How would you use it? How can it benefit other users?
A simple example for where this would be useful would be to allow users to mark Excel datasources vs SQL datasources at a glance, even more so in the collapsed label-less view.
(Optional) Suggest an idea for implementing the addition or change.
On the YAML catalog side there could be an extra key for icon like so:
flight_times:
    type: pandas.CSVDataSet
    layer: raw
    load_args:
          sep: '|'
    icon: carbon-csv
This could pull in the following icon from the Carbon design system (by IBM): provided by the iconfiy framework which collects several open source icon libraries.
https://iconify.design/icon-sets/carbon/csv.html
By using the [iconfiy-react](https://github.com/iconify/iconify-react) library this would hopefully be a low effort addition
A declarative, efficient, and flexible JavaScript library for building user interfaces.
🖖 Vue.js is a progressive, incrementally-adoptable JavaScript framework for building UI on the web.
TypeScript is a superset of JavaScript that compiles to clean JavaScript output.
An Open Source Machine Learning Framework for Everyone
The Web framework for perfectionists with deadlines.
A PHP framework for web artisans
Bring data to life with SVG, Canvas and HTML. 📊📈🎉
JavaScript (JS) is a lightweight interpreted programming language with first-class functions.
Some thing interesting about web. New door for the world.
A server is a program made to process requests and deliver data to clients.
Machine learning is a way of modeling and interpreting data that allows a piece of software to respond intelligently.
Some thing interesting about visualization, use data art
Some thing interesting about game, make everyone happy.
We are working to build community through open source technology. NB: members must have two-factor auth.
Open source projects and samples from Microsoft.
Google ❤️ Open Source for everyone.
Alibaba Open Source for everyone
Data-Driven Documents codes.
China tencent open source team.