

A 2D charting library for haskell
Further information can be found in the associated wiki.
A 2D charting library for haskell
A 2D charting library for haskell
Further information can be found in the associated wiki.


Example 6 claims to be
produced by the script test/darcs_usage.hs in the source distribution
But I cannot find this anywhere. Maybe this piece of documentation should be updated.
This module is not exported from version 1.3.1, but the online example use it.
Hi Tim,
do you have plan to integrate histograms into haskell-charts ?
For this need I currently use Ben Gamari's Chart-Histogram package, which works well. Do you think it is better as a third party package, rather that directly provided as a feature of haskell-chart package ?
Cheers,
Hi Tim,
using cairo PNG backend, increasing the PNG size will increase the space used for plotting data, but not the text size. As a result, if I want a good resolution, text will appear tiny. There are attributes to control the size of individual areas (layout title, axis title ...), but it seems really complicated to go exhaustively over them all, when what we want is "scale up text on chart".
Also, I can't find how to set labels font size for a pie chart.
What is your point of view ? Am I missing something ? Thank you.
While browsing through the examples, I noticed that some of the charts don't exactly correspond with the sample code given. For example:
In example 1 ("Amplitude Modulation") the graph is plotted with red points, but the first block of code (written with the easy helper functions) contains no code for specifying that points be plotted with the colour red. When the code is compiled and run, it produces a graph whose points are plotted with the colour green (the default).
It appears that the second block of code (written without the easy helper functions) does produce the correct output.
It would be useful if both code sections produced the same output, so that users could compare how to produce the same effect with both techniques.
(For example, it's not clear to me how I would specify that points are plotted with the colour red when using the easy helper functions.)
Hi Tim,
I am trying to build a project on Windows, and GHC crashes when installing the Chart-cairo dependency. At the moment, I don't know how to provide you a detailed bug report about what happens, as Windows just pops up a window informing me that GHC program crashed. Cabal tells this :
Loading package operational-0.2.3.2 ... linking ... done.
Loading package Chart-1.2.3 ... linking ... done.

This application has requested the Runtime to terminate it in an unusual way.
Please contact the application's support team for more information.
Failed to install Chart-cairo-1.2.3
World file is already up to date.
cabal.exe: Error: some packages failed to install:
Chart-cairo-1.2.3 failed during the building phase. The exception was:
ExitFailure 3
I believe GHC is in a TemplateHaskell related phase at this moment.
Plateform is : Windows 7 32bits + MINGW + GHC 7.6.3 + Haskell Platform 2013.2.0.0 + cabal-install 1.18 (sandboxed build)
I believe that GTK libs are correctly installed and available, since I can build cairo itself and other Gtk-related packages fine.
Note that I tried GHC 7.8.3 (without platform) and it crashed in the same way.
Please, let me know what I can do to give you a more detailed report.
Best regards, and thank you again for your very nice package.
I'm not sure if this is an intentional design decision, but drawing a line with a single point results in the axes changing to the correct range, but nothing being draw. I would suggest drawing a dot or something.
Hi,
lens has a new version again; you might want to upload a corresponding Chart package.
Thanks,
Joachim
Would it be possible to release an updated version of Chart that supports lens version 4.x?
The order of chart and "example1_big.png" in the main function of the non-Easy example in the example 1 is inverted on the wiki but not on the source.
The following error occurs when running either export to PDF or SVG on the Cairo backend. It doesn't appear to affect the output.
<Error>: The function ‘CGFontGetGlyphPath’ is obsolete and will be removed in an upcoming update. Unfortunately, this application, or a library it uses, is using this obsolete function, and is thereby contributing to an overall degradation of system performance.
Filled circles (whether opaque or not) are not displayed by the diagrams SVG backend but are by the Cairo one. The code and output I get can be found at https://gist.github.com/DougBurke/8889814
The output file circles-cairo.svg has an orange line with filled circles (green, partly transparent) with a black outline. The diagrams version (circles-diagrams.svg) has the orange line and black circles, but no green fill (also tried using a fully opaque green for the fill and it also fails to be displayed).
I don't know if this is an issue with the backend code (i.e. chart) or the diagrams library itself.
Here's my package database contents and ghc/os version:
% cabal sandbox hc-pkg -- list
/var/lib/ghc/package.conf.d
   Cabal-1.16.0
   array-0.4.0.1
   base-4.6.0.1
   bin-package-db-0.0.0.0
   binary-0.5.1.1
   bytestring-0.10.0.2
   containers-0.5.0.0
   deepseq-1.3.0.1
   directory-1.2.0.1
   filepath-1.3.0.1
   ghc-7.6.3
   ghc-prim-0.3.0.0
   haskell2010-1.1.1.0
   haskell98-2.0.0.2
   hoopl-3.9.0.0
   hpc-0.6.0.0
   integer-gmp-0.5.0.0
   old-locale-1.0.0.5
   old-time-1.1.0.1
   pretty-1.1.1.0
   process-1.1.0.2
   rts-1.0
   template-haskell-2.8.0.0
   time-1.4.0.1
   unix-2.6.0.1
/home/dburke/build/ihaskell/.cabal-sandbox/x86_64-linux-ghc-7.6.3-packages.conf.d
   Boolean-0.2
   Chart-1.2
   Chart-cairo-1.2
   Chart-diagrams-1.2
   HTTP-4000.2.10
   HUnit-1.2.5.2
   HaTeX-3.10.0.0
   MemoTrie-0.6.1
   MissingH-1.2.0.2
   MonadCatchIO-transformers-0.3.1.0
   MonadRandom-0.1.12
   NumInstances-1.3
   OneTuple-0.2.1
   QuickCheck-2.6
   ReadArgs-1.2.1
   SVGFonts-1.4.0.1
   active-0.1.0.10
   aeson-0.6.2.1
   aeson-pretty-0.7.1
   ansi-terminal-0.6.1.1
   arithmoi-0.4.0.3
   async-2.0.1.5
   attoparsec-0.11.1.0
   base-unicode-symbols-0.2.2.4
   base64-bytestring-1.0.0.1
   basic-prelude-0.3.6.0
   bifunctors-4.1.1
   blaze-builder-0.3.3.2
   blaze-html-0.7.0.1
   blaze-markup-0.6.0.0
   blaze-svg-0.3.3.1
   byteable-0.1.1
   cairo-0.12.5.1
   cereal-0.3.5.2
   circle-packing-0.1.0.3
   classy-prelude-0.7.0
   cmdargs-0.10.7
   colour-2.3.3
   comonad-4.0
   contravariant-0.4.4
   cpphs-1.18
   cryptohash-0.11.2
   data-default-0.5.3
   data-default-class-0.0.1
   data-default-instances-base-0.0.1
   data-default-instances-containers-0.0.1
   data-default-instances-dlist-0.0.1
   data-default-instances-old-locale-0.0.1
   diagrams-1.0.0.1
   diagrams-cairo-1.0.1.2
   diagrams-contrib-1.1.0.1
   diagrams-core-1.0.0.1
   diagrams-lib-1.0.1
   diagrams-postscript-1.0.1.2
   diagrams-svg-1.0.1.3
   distributive-0.4
   dlist-0.6.0.1
   dual-tree-0.2.0.1
   exceptions-0.3.3
   extensible-exceptions-0.1.1.4
   fingertree-0.1.0.0
   force-layout-0.3
   free-4.5
   generic-deriving-1.6.2
   ghc-parser-0.1.1.0
   ghc-paths-0.1.0.9
   ghci-lib-0.1.0.0
   groupoids-4.0
   groups-0.4.0.0
   hashable-1.2.1.0
   haskeline-0.7.1.2
   haskell-src-exts-1.14.0.1
   haskell-src-meta-0.6.0.5
   here-1.2.3
   hlint-1.8.57
   hscolour-1.20.3
   hslogger-1.2.3
   hspec-1.8.1.1
   hspec-expectations-0.5.0.1
   ihaskell-0.3.0.4
   ihaskell-aeson-0.1.0.0
   ihaskell-basic-0.1.0.0
   ihaskell-blaze-0.1.0.0
   ihaskell-charts-0.1.0.0
   ihaskell-diagrams-0.1.0.0
   ihaskell-hatex-0.1.0.0
   ihaskell-magic-0.1.0.0
   intervals-0.4.1
   ipython-kernel-0.1.0.0
   keys-3.10
   lens-3.10.1
   lifted-base-0.2.1.1
   magic-1.0.8
   matrix-0.2.4.0
   monad-control-0.3.2.2
   monads-tf-0.1.0.1
   mono-traversable-0.2.0.0
   monoid-extras-0.3.2.4
   mtl-2.1.2
   nats-0.1.2
   network-2.4.2.2
   network-info-0.2.0.3
   newtype-0.2
   operational-0.2.2.1
   optparse-applicative-0.7.0.2
   parallel-3.2.0.4
   parsec-3.1.5
   pointed-4.0
   primitive-0.5.1.0
   profunctors-4.0.2
   quickcheck-io-0.1.0
   random-1.0.1.1
   reflection-1.4
   regex-base-0.93.2
   regex-compat-0.95.1
   regex-posix-0.95.2
   safe-0.3.4
   scientific-0.2.0.1
   semigroupoids-4.0
   semigroups-0.12.2
   setenv-0.1.1.1
   shelly-1.4.4
   split-0.2.2
   statestack-0.2
   stm-2.4.2
   strict-0.3.2
   syb-0.4.1
   system-argv0-0.1.1
   system-fileio-0.3.12
   system-filepath-0.4.9
   tagged-0.7
   tar-0.4.0.1
   terminfo-0.4.0.0
   text-1.1.0.0
   th-lift-0.5.6
   th-orphans-0.8
   transformers-0.3.0.0
   transformers-base-0.4.1
   transformers-compat-0.1.1.1
   tuple-0.2.0.1
   uniplate-1.6.12
   unix-compat-0.4.1.1
   unordered-containers-0.2.3.3
   utf8-string-0.3.7
   uuid-1.3.3
   vector-0.10.9.1
   vector-instances-3.3
   vector-space-0.8.6
   vector-space-points-0.1.3
   void-0.6.1
   xml-1.3.13
   zeromq4-haskell-0.2

% ghc --version
The Glorious Glasgow Haskell Compilation System, version 7.6.3
% uname -a
Linux brobdingnag 3.11.0-15-generic #25-Ubuntu SMP Thu Jan 30 17:22:01 UTC 2014 x86_64 x86_64 x86_64 GNU/Linux
I am not sure that this is a chart or chart-cairo bug, but I don't have the expertise to deal with this myself...
If you generate two SVGs using Chart and chart-cairo, and then conjoin them into one HTML file, then when you display them the second one gets messed up. I think this is because the glyphs from the first one are used in the second one, sine they share names.
You can look at an example by curling and viewing this file, or here (see cell output 31).
Here is some code you can use to generate this broken HTML file:
{-# LANGUAGE OverloadedStrings #-}
import Graphics.Rendering.Chart
import Data.Default.Class
import Control.Lens
import Graphics.Rendering.Chart.Backend.Cairo


import Data.Colour
import Data.Colour.Names

xvals = [1.5, 2.5, 5, 8 :: Double ]
yvals = [0.025, 0.1, 9, 230 :: Double ]

xlvals = map LogValue xvals
ylvals = map LogValue yvals

-- | Connect the points (xs,ys) with a solid
--   line using the given color.
lineXY :: (PlotValue a, PlotValue b) => Colour Double -> [a] -> [b] -> Plot a b
lineXY col xs ys = toPlot p
    where
        p = plot_lines_style .~ solidLine 1 (opaque col)
            $ plot_lines_values .~ [zip xs ys]
            $ def

-- | Draw symbols at the points (xs,ys).
--
symbolXY ::
    (PlotValue a, PlotValue b) =>
    (AlphaColour Double -> PointStyle)
    -> Colour Double
    -> [a]
    -> [b]
    -> Plot a b
symbolXY sym col xs ys = toPlot p
    where
        p = plot_points_style .~ sym (opaque col)
            $ plot_points_values .~ zip xs ys
            $ def

asCircle = filledCircles 10
asStar = stars 10 2

-- | This function will plot the given function of x over the list of xs.
plotIt ::
  (PlotValue a, PlotValue b) =>
  (Colour Double -> [a] -> [b] -> Plot a b)
  -> [a]
  -> [b]
  -> Renderable ()

plotIt plotType xs ys = toRenderable l
    where
        l = layout_title .~ "Plot"
            $ layout_plots .~ [ plotType blue xs ys ]
            $ def

main = do
  let renderable = plotIt (symbolXY asCircle) xvals yvals
      renderable' = plotIt (symbolXY asStar) xlvals ylvals
      filename = "svg.svg"
      filename' = "svg2.svg"
      opts = def{_fo_format = SVG, _fo_size = (500, 400)}
  renderableToFile opts renderable filename
  renderableToFile opts renderable' filename'
Then run cat svg.svg svg2.svg > two.html, and view two.html in Firefox or Chrome.
Any idea what's going on? Is this a bug in browsers? Or in Chart? or what?
I've been using Chart with the Diagrams backend (itself using the Rasterific backend) and been very impressed. One thing I haven't been able to figure out how to do is increase the gap between axis labels and axis title. In particular, my X-axis title is pressed right up against the axis labels. Modifying axis_label_gap moves both the labels and title. It's entirely possible I've overlooked a way to increase that spacing, but, if not, perhaps an axis_title_gap field could be added to AxisStyle.
I could not draw multiple sets of points with the Easy module. Drawing multiple sets of points with the classic approach work flawlessly. Here's some code that creates two images that should be the same using the two techniques.
import Graphics.Rendering.Chart
import Graphics.Rendering.Chart.Easy
import Graphics.Rendering.Chart.Backend.Cairo
import Data.Colour
import Data.Colour.Names
import Data.Default.Class
import Control.Lens

main = do
    renderableToFile def "example2.png" chart
    toFile def "example1.png" $ do
        layout_title .= "Amplitude Modulation"
        plot (line "am" [signal [0,(0.5)..400]])
        plot (points "am points" (signal [0,7..400]))
        plot (points "bm points" (signal [0,8..400]))

signal :: [Double] -> [(Double,Double)]
signal xs = [ (x,(sin (x*3.14159/45) + 1) / 2 * (sin (x*3.14159/5))) | x <- xs ]

setLinesBlue :: PlotLines a b -> PlotLines a b
setLinesBlue = plot_lines_style  . line_color .~ opaque blue

chart = toRenderable layout
  where
    am :: Double -> Double
    am x = (sin (x*3.14159/45) + 1) / 2 * (sin (x*3.14159/5))

    sinusoid1 = plot_lines_values .~ [[ (x,(am x)) | x <- [0,(0.5)..400]]]
              $ plot_lines_style  . line_color .~ opaque blue
              $ plot_lines_title .~ "am"
              $ def

    sinusoid2 = plot_points_style .~ filledCircles 2 (opaque red)
              $ plot_points_values .~ [ (x,(am x)) | x <- [0,7..400]]
              $ plot_points_title .~ "am points"
              $ def

    sinusoid3 = plot_points_style .~ filledCircles 2 (opaque green)
              $ plot_points_values .~ [ (x,(am x)) | x <- [0,8..400]]
              $ plot_points_title .~ "bm points"
              $ def

    layout = layout_title .~ "Amplitude Modulation"
           $ layout_plots .~ [toPlot sinusoid1,
                              toPlot sinusoid2,
                              toPlot sinusoid3]
$ defThe current version range is: lens >= 3.9 && < 3.11, but Chart builds with no errors or warnings when using lens 4.0.
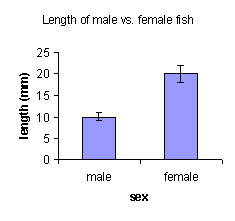
I'm struggling to put together a graph like this one: http://mathbench.umd.edu/modules/prob-stat_bargraph/graphics-final/graph-male-female.jpg
Is this possible with the current API? I don't think there's any way to "hook" into a PlotBars render to capture the correct x-axis values to feed into a PlotErrBars.
Currently the fonts included with chart-diagrams are installed in a directory relative to either your .cabal or ~/Library/Haskell on OS X directory, or inside your cabal sandbox when binaries are built. This causes issues with deploying apps using chart-diagrams because the paths that are searched for are hard coded to absolute paths meaning that they must be installed on the production environment at exactly the same path.
I've seen that there are some functions which allow you to specify the paths to fonts, but to keep the interface easy to use with the default fonts, I feel that including the SVG fonts at compile time using something like include-file and then having defaultFonts use those included fonts would mean that no extra setup is necessary in when deploying binaries based on chart-diagrams.
The changes, I hope, would be minimal (but I haven't tried making the change properly myself yet)
defaultFonts :: IO (FontStyle -> DFont)
defaultFonts = do
  serifR   <- loadDefaultFont "fonts/LinLibertine_R.svg"
  serifRB  <- loadDefaultFont "fonts/LinLibertine_RB.svg"
  serifRBI <- loadDefaultFont "fonts/LinLibertine_RBI.svg"
  serifRI  <- loadDefaultFont "fonts/LinLibertine_RI.svg"
  sansR   <- loadDefaultFont "fonts/SourceSansPro_R.svg"
  sansRB  <- loadDefaultFont "fonts/SourceSansPro_RB.svg"
  sansRBI <- loadDefaultFont "fonts/SourceSansPro_RBI.svg"
  sansRI  <- loadDefaultFont "fonts/SourceSansPro_RI.svg"
  monoR  <- loadDefaultFont "fonts/SourceCodePro_R.svg"
  monoRB <- loadDefaultFont "fonts/SourceCodePro_RB.svg"
would become something like
defaultFonts :: IO (FontStyle -> DFont)
defaultFonts = do
  let
    $(includeFileInSource "fonts/LinLibertine_R.svg" "serifR")
    $(includeFileInSource "fonts/LinLibertine_RB.svg" "serifRB")
    $(includeFileInSource "fonts/LinLibertine_RBI.svg" "serifRBI")
    $(includeFileInSource "fonts/LinLibertine_RI.svg" "serifRI")
    $(includeFileInSource "fonts/SourceSansPro_R.svg" "sansR")
    $(includeFileInSource "fonts/SourceSansPro_RB.svg" "sansRB")
    $(includeFileInSource "fonts/SourceSansPro_RBI.svg" "sansRBI")
    $(includeFileInSource "fonts/SourceSansPro_RI.svg" "sansRI")
    $(includeFileInSource "fonts/SourceCodePro_R.svg" "monoR")
$(includeFileInSource "fonts/SourceCodePro_RB.svg" "monoRB")I would like the following extra instances for the ToRenderable typeclass. This would make things more intuitive and simple – is there any reason these are a bad idea?
instance ToRenderable a => ToRenderable (EC a ()) where
  toRenderable = toRenderable . execEC

instance ToRenderable a => ToRenderable (EC l a) where
  toRenderable = toRenderable . plot
Together this lets you write something like:
import Graphics.Rendering.Chart.Easy

xs = [0, 0.1..100]
ys = sin <$> xs
toRenderable $ line "Sine Wave" [zip xs ys]
and have it immediately produce a line plot (if in IHaskell), which IMHO is a pretty awesome way to get a plot going.
So I've been using a chart with candle plots and I can't seem to find a setting to margin the first and last candle plots so that they aren't being drawn off screen half way. Is there a setting for this (or a recommend work around)? If not I could probably try to implement a solution and create a pull request (unless someone else could do it real quick).
If I did implement such a solution, would there be a desired approach in how I do it?
With this naive code:
I expect to see 6 graphs, 3 above and 3 below. The PNG file is wide enough, but only the first graph in each row is displayed. This is using latest versions of chart and chart-cairo on hackage and cairo 0.2.12.
Here's what the paste above outputs:
It would be nice to have an example of using Grids to compose charts in the wiki? I've been playing around with them and haven't found a pattern for a nice result yet.
Hi Tim,
thank you very much for this beautiful package, it is highly appreciated.
I am looking for a way to label the axis of a chart (to display data units), but I don't find anything at the moment in the docs. Is it possible with 1.2.2 ? If not, I think it should be made possible, because it is very important for scientific usages. In my field, a chart with no unit would draw a lot of negative reviews.
EDIT : for clarification, I am not talking about axis value labels (for example 0,1,2,3 ...), but about a label that describe the axis itself, like "time (sec.)", or "Plant power (W)" etc. IOW, a single string that can be attached to an axis to describe it.
Regards,
Plotting 75k points results in the following run statistics:
  17,095,699,408 bytes allocated in the heap
   5,963,243,808 bytes copied during GC
     734,099,456 bytes maximum residency (20 sample(s))
       6,439,600 bytes maximum slop
            1861 MB total memory in use (0 MB lost due to fragmentation)

                                    Tot time (elapsed)  Avg pause  Max pause
  Gen  0     32989 colls,     0 par    5.60s    5.61s     0.0002s    0.0014s
  Gen  1        20 colls,     0 par    6.64s    6.66s     0.3330s    1.9475s

  INIT    time    0.00s  (  0.00s elapsed)
  MUT     time   20.44s  ( 20.48s elapsed)
  GC      time   12.24s  ( 12.27s elapsed)
  EXIT    time    0.03s  (  0.03s elapsed)
  Total   time   32.72s  ( 32.78s elapsed)

  %GC     time      37.4%  (37.4% elapsed)

  Alloc rate    836,283,704 bytes per MUT second

  Productivity  62.6% of total user, 62.5% of total elapsed
Additional charts (e.g., for multiple charts per diagram via the (|||) or (===) operators) have cumulative memory use, such that creating four charts similar to points0 in the code uses ~90% of my laptop's 8GB memory.
Code and a detailed Time/Allocation profile are in this gist, and the file containing the simulated data is on dropbox (3.7MB). Compilation is with ghc -O3 simpleplots.hs. Chart version is 1.2.2. GHC version is 7.8.2.
I've started playing with converting Chart to use boxed Vectors in the hopes that it will improve memory residency, but I haven't yet gotten far enough for results. The ability to force evaluation of a Renderable could be an alternative if reducing this memory usage is not possible, as it would at least reduce the cumulative effect of multiple charts.
I see in cabal file that the license is BSD. Is this correct? Would you mind if I added it as a LICENSE file?
Here is output of compilation of the very first example on the Wiki
Plotter.hs:27:14:
Not in scope: layout_title' Perhaps you meant one of these: layout1_title' (imported from Graphics.Rendering.Chart),
`_layout1_title' (imported from Graphics.Rendering.Chart)
Plotter.hs:28:14:
Not in scope: layout_plots' Perhaps you meant one of these: layout1_plots' (imported from Graphics.Rendering.Chart),
`_layout1_plots' (imported from Graphics.Rendering.Chart)
Plotter.hs:32:8:
Not in scope: renderableToFile' Perhaps you meant one of these: renderableToPSFile' (imported from Graphics.Rendering.Chart.Backend.Cairo),
renderableToPDFFile' (imported from Graphics.Rendering.Chart.Backend.Cairo), renderableToPNGFile' (imported from Graphics.Rendering.Chart.Backend.Cairo)
Hi,
thank you for this package. Here is a simple suggestion : rename "Chart" to "chart" at some point. I just lost 20 minutes understanding why cabal was complaining :)
Regards,
This applies to Chart-gtk. The short term solution is to constrain the upper version, the long-term solution is:
import qualified Data.Text as T

-- do action m for any keypress (except meta keys)
anyKey :: (Monad m) => m a -> GE.Event -> m Bool
anyKey m (GE.Key {GE.eventKeyName=key})
    | any (`T.isPrefixOf` key) ignores = return True
    | otherwise                      = m >> return True
  where
    ignores :: [T.Text]
    ignores = map T.pack ["Shift","Control","Alt",
"Super","Meta","Hyper"]It looks like trying to plot a graph with NaNs causes the program to become unresponsive.
Chart generation is much slower where an axis as type Int (compared with type Double), eg this code is slow
module Main where

import Graphics.Rendering.Chart.Easy
import Graphics.Rendering.Chart.Backend.Cairo

v ::[(Double,Int)]
v = [(34.0,5959680),(34.25,5959680),(34.5,0)]

main:: IO ()
main = toFile def "chart.png" $ do
    plot (line "v" [v])
whereas it runs quickly if v is changed to have type [(Double,Double)]
I tried to run example 1, but I had to add to imports, Data.Colour and Data.Colour.Names, and replace blue with (opaque blue) and red with (opaque red) to convert them from Colour to AlphaColour.
UTCTime from the time library supports addUTCTime and diffUTCTime making it the preferred type for time manipulations. It would be awesome if chart could support UTCTime as a PlotValue.
Hi,
lens-4.3 has been uploaded to hackage, it would be nice if Chart would support that version.
Thanks,
Joachim
Chart-diagrams-1.0 had no upper bound on diagrams-lib or other Diagrams packages. Cabal will therefore sometimes pick it when trying to use the latest Diagrams. This will recur every time a new major version of diagrams-lib is released (since there's naturally a lag before Charts-diagrams supports it.)
I believe diagrams-lib < 1.0 would be correct; we broke lots between 0.7 and 1.0. Hackage now allows maintainers to edit the package information for previously-released packages. I think this is most certain to prevent build failures for users.
Hi Tim,
I have a problem with legend overflowing the chart area on bar charts. I am attaching an example of a problematic rendering (the name on the right, does not print properly). Can I hint Chart to avoid this behaviour ? Is this a bug that could be fixed ?
Cheers, all the best.

Need to fix:
chart-diagrams/Graphics/Rendering/Chart/Backend/Diagrams.hs
The migration guide is here:
In order to get the example plotWindow [0,0.1..2.9] sin to work outside ghci, had to change to plotWindow[0::Double,0.1..2.9]
Or maybe this is a feature request for examples that run in ghc...
Hello,
I was trying to compile some code using Chart and Diagrams under GHC 7.10 (with base 4.8), one thing lead to another, and I ended up compiling Chart-diagrams against the git version of Diagrams. The problem is, there are a lot of breaking changes, and the two don't quite fit. I tried to fix it, but I got stuck at runBackend* functions (GHC tries to identify "ChartBackend a" with "ChartBackend TextSize"), and the file rendering functions (SVG functions in Diagrams and SVGFonts seem to be completely different).
I just thought I'd share what I did manage to do:
Regards,
Marcin
is there gtk3 support planned?
Hi Tim,
I am trying to customize the granularity of the time axis data for some charts. To do so, I am basically making a custom copy of Graphics.Rendering.Chart.Axis.LocalTime.autoTimeAxis. Is that the right way to go ? In this case, it would help to export everything that this function uses, in particular millisXXX, seconds, minuteSeq and hours.
Thank you very much, I'm still enjoying Chart a lot !
Does the API allow to create horizontal bar graphs (rather than vertical bars, and if so, how?); random example:

Is it possible to do horizontal bar chart instead of vertical ones (as in the examples)?
Philosophical reason: All library code should use a "neutral" data represenation internally, e.g. unicode for text and UTC for date/time.
Pragmatic reason: Most code uses (should use) UTC to represent date/time internally. chart should also use UTC in order to make interaction with other code less painful.
I find myself writing
    denv :: DEnv
    denv = unsafePerformIO $ defaultEnv vectorAlignmentFns 500 500
so that I can create a pure Diagram B R2. With this I can then use the diagrams package to do a poor man's ggplot2 e.g.
https://idontgetoutmuch.files.wordpress.com/2014/06/a38b923b7522fc9d.png?w=1560
I also use BlogLiteratelyD where the diagram needs to be not in the IO monad.
I realise that the default fonts have to be read in but maybe the unsafePerformIO could be done in the chart package itself? Alternatively the fonts could be read in at compile time using Template Haskell.
I've been playing with the idea of interactive plots with the Gtk backend in a branch, and I'm to a point where I want to know if they would be of interest to the project before I spend too much more time on it. Preliminary code can be found here, specifically here.
Right now, functionality includes the ability to zoom in and out and a save menu option. Example code would look like
import Graphics.Rendering.Chart.Gtk
import Graphics.Rendering.Chart.Easy

x :: [Double]
x = [1.9,1.92..18.5]

y :: [Double]
y = cos `map` x

main :: IO ()
main = toZoomableWindow 640 480 $ do
  layoutlr_title .= "Cos wave"
  plotLeft (line "cos" [ x `zip` y] )
  plotRight (line "1 + cos" [ x `zip` (((+1) . sin) `map` x)] )
The syntax is essentially unchanged with the exception that you call toZoomableWindow instead of toWindow and there must be an appropriate Zoomable instance.
I'm open to changing things, and it clearly needs to be cleaned up in terms of location of code; I just wanted to float the idea before getting too far.
Was having problems with version 1.4 because of the lens bound. Will 1.4.1 be uploaded to Hackage soon?
Comparing the test9l.png and test9l.svg outputs from the test suite, it looks like there's a problem with calculating the bar widths/placement since
I've put the SVG file in https://gist.github.com/DougBurke/9590042 - hopefully you can see what I mean.
A declarative, efficient, and flexible JavaScript library for building user interfaces.
🖖 Vue.js is a progressive, incrementally-adoptable JavaScript framework for building UI on the web.
TypeScript is a superset of JavaScript that compiles to clean JavaScript output.
An Open Source Machine Learning Framework for Everyone
The Web framework for perfectionists with deadlines.
A PHP framework for web artisans
Bring data to life with SVG, Canvas and HTML. 📊📈🎉
JavaScript (JS) is a lightweight interpreted programming language with first-class functions.
Some thing interesting about web. New door for the world.
A server is a program made to process requests and deliver data to clients.
Machine learning is a way of modeling and interpreting data that allows a piece of software to respond intelligently.
Some thing interesting about visualization, use data art
Some thing interesting about game, make everyone happy.
We are working to build community through open source technology. NB: members must have two-factor auth.
Open source projects and samples from Microsoft.
Google ❤️ Open Source for everyone.
Alibaba Open Source for everyone
Data-Driven Documents codes.
China tencent open source team.
