GithubHelp home page GithubHelp logo

britecharts / britecharts-react Goto Github PK

View Code? Open in Web Editor NEW
113.0 113.0 22.0 10.28 MB

Britecharts-react is a React wrapper for the Britecharts charting library. It allows the use of Britecharts charts within a React application.

Home Page: http://britecharts.github.io/britecharts-react/

License: Apache License 2.0

JavaScript 99.06% CSS 0.44% Shell 0.15% Dockerfile 0.09% Makefile 0.15% HTML 0.09%
britecharts chart d3 data-visualization es6 interactive-visualizations javascript react

britecharts-react's Introduction

Britecharts

Britecharts is a client-side reusable Charting Library based on D3.js v5 that offers easy and intuitive use of charts and components that can be composed together to create amazing visualizations.

Build Status npm version License PRs Welcome All Contributors Twitter Follow

Bar Chart Line Chart Donut Chart
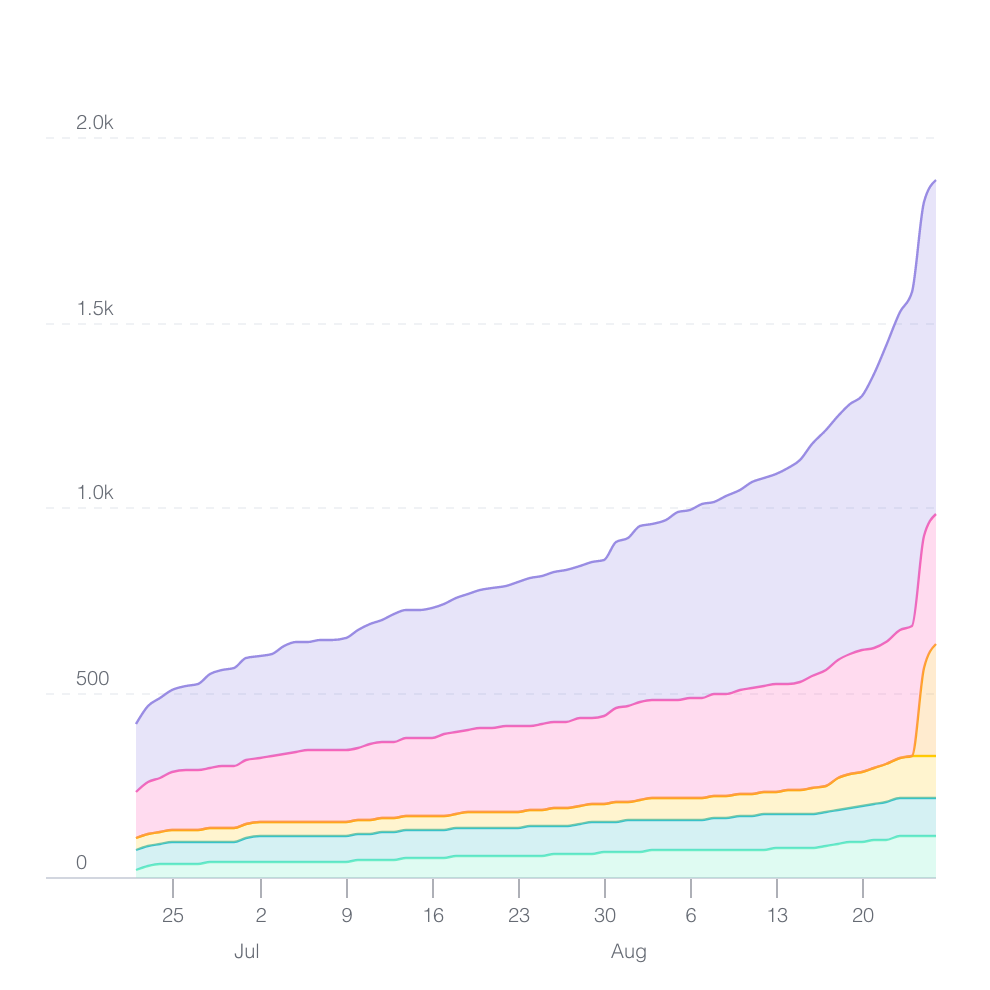
Stacked Bar Chart Stacked Area Chart Grouped Bar Chart
Sparkline Chart Legend Chart Brush Chart

Britecharts components have been written in ES2016 with a Test Driven methodology, so they are fully tested, and we are committed to keeping them that way.

Key Features

  • Reusability
  • Composability
  • Great design

Usage

The typical use of Britecharts involves creating a chart using its simple API, then rendering it on a container which has previously had data applied to it. The code will look like this:

barChart
    .width(500)
    .height(300);

barContainer.datum(dataset).call(barChart);

API

All the components expose some common API methods like width, height, and margin. Additionally, each chart or component can expose specific methods you can find in the documentation:

Installation

Britecharts components are distributed in UMD modules, each one exposing a D3.js component written with the Reusable API pattern. To use any of the Britecharts modules, you will need to require the chart in your JS file using AMD/CommonJS modules or adding a script tag with the src pointing to the file. You would also need to load the d3-selection submodule to select the chart container.

   npm install britecharts d3-selection

You can also load Britecharts from our CDN as we do in this demo page or play around in our JSBin and CodePen demo projects.

They also provide some minimal CSS styling, that can be loaded independently or as a bundle. Check our Styling Britecharts tutorial to see more options.

See Also

Community Roadmap

This project is in active development. We want your input about what is important, for that, add your votes using the πŸ‘ reaction:

To give your feedback, you can open a new issue. You can also find us in the D3.js slack group, in the #britecharts channel. If you want to help, you can check the contributing guide.

If you work with Angular, check out ngx-britecharts and their demos. We are also preparing a wrapper for React, and we will be talking about it on our twitter.

Acknowledgments

Sun Dai designs Britecharts, and two books inspired the code, Developing a D3.js Edge and Mastering D3.js. It also leveraged a significant number of examples and articles from the D3.js community overall.

Contributors ✨

Thanks goes to these wonderful people (emoji key):


Daler Asrorov

πŸ’» πŸ“– πŸ€” 🚧 πŸ‘€ ⚠️

Ryan Wholey

πŸ’» πŸ“– πŸ€” 🚧 πŸ‘€ ⚠️

jchen85

πŸ’» πŸ€” 🚧 πŸ‘€ ⚠️

Marcos GΓ³mez

πŸ’»

ajdani

πŸ› πŸ’» 🚧

shayh

πŸ’»

Jay Clark

πŸ’»

Brendan Ratter

πŸ’» πŸ€”

Rajesh

πŸ’»

Alexis Crespo

πŸ’»

Gago

πŸ’» πŸ–‹ πŸ€” πŸš‡ 🚧 πŸ‘€ πŸ”§ ⚠️

This project follows the all-contributors specification. Contributions of any kind are welcome!

License

Copyright 2019 Eventbrite

Licensed under the Apache License, Version 2.0 (the "License"); you may not use this file except in compliance with the License. You may obtain a copy of the License at

https://www.apache.org/licenses/LICENSE-2.0

Unless required by applicable law or agreed to in writing, software distributed under the License is distributed on an "AS IS" BASIS, WITHOUT WARRANTIES OR CONDITIONS OF ANY KIND, either express or implied. See the License for the specific language governing permissions and limitations under the License.

Read more in the license document

britecharts-react's People

Contributors

adamgruber avatar allcontributors[bot] avatar amber-eb avatar dalerasrorov avatar dalerasrorov-eb avatar davegomez avatar dependabot[bot] avatar golodhros avatar imadrafter avatar jchen85 avatar jshuping avatar karlalnebratt avatar marcelovani avatar miglesiaseb avatar rubenmoya avatar snyk-bot avatar speckospock avatar

Stargazers

 avatar  avatar  avatar  avatar  avatar  avatar  avatar  avatar  avatar  avatar  avatar  avatar  avatar  avatar  avatar  avatar  avatar  avatar  avatar  avatar  avatar  avatar  avatar  avatar  avatar  avatar  avatar  avatar  avatar  avatar  avatar  avatar  avatar  avatar  avatar  avatar  avatar  avatar  avatar  avatar  avatar  avatar  avatar  avatar  avatar  avatar  avatar  avatar  avatar  avatar  avatar  avatar  avatar  avatar  avatar  avatar  avatar  avatar  avatar  avatar  avatar  avatar  avatar  avatar  avatar  avatar  avatar  avatar  avatar  avatar  avatar  avatar  avatar  avatar  avatar  avatar  avatar  avatar  avatar  avatar  avatar  avatar  avatar  avatar  avatar  avatar  avatar  avatar  avatar  avatar  avatar  avatar  avatar  avatar  avatar  avatar  avatar  avatar  avatar  avatar

Watchers

 avatar  avatar  avatar  avatar  avatar  avatar  avatar  avatar  avatar  avatar  avatar  avatar  avatar  avatar  avatar  avatar  avatar  avatar  avatar  avatar  avatar  avatar  avatar  avatar  avatar  avatar  avatar  avatar  avatar  avatar  avatar  avatar  avatar  avatar  avatar  avatar  avatar  avatar  avatar  avatar  avatar  avatar  avatar  avatar  avatar  avatar  avatar  avatar  avatar  avatar  avatar  avatar  avatar  avatar  avatar  avatar  avatar  avatar  avatar  avatar  avatar  avatar  avatar  avatar  avatar  avatar  avatar  avatar  avatar  avatar  avatar  avatar  avatar  avatar  avatar  avatar  avatar  avatar  avatar  avatar  avatar  avatar  avatar  avatar  avatar  avatar  avatar  avatar  avatar  avatar  avatar  avatar  avatar  avatar  avatar  avatar

britecharts-react's Issues

Line Chart not working on Firefox

Expected Behavior

Line chart working

Current Behavior

fullscreen_1_7_18__11_02_pm

Context

Your Environment

  • Browser Name and version: FF 57
  • Operating System and version (desktop or mobile): MacOS

Broken and unclear documentation

Expected Behavior

I'm trying to get a line chart working but it's quite hard since the Line documentation examples are broken and quite unclear because, for instance, the first example code look like this:

const lineData = require('./lineChart.fixtures').default;
    const ResponsiveContainer = require('../helpers/responsiveContainer.js').default;
    const margin = {
        top: 60,
        right: 30,
        bottom: 60,
        left: 70,
    };

    const renderLine = (props) => (
        <ResponsiveContainer
            render={
                ({width}) =>
                    <Line
                        margin={margin}
                        lineCurve="basis"
                        width={width}
                        {...props}
                    />
            }
        />
    );

    <Tooltip
        data={lineData.oneSet()}
        render={renderLine}
        topicLabel="topics"
        title="Tooltip Title"
    />

The import of the <Line> component seem to be missing?

Current Behavior

After searching a lot, I got a working chart, and I wanted to changed the axisTimeCombinations prop. I see there should be some constants to be used (here too, the documentation has a formatting issue on the constant names):

MINUTE_HOUR, HOUR_DAY, DAY_MONTH, MONTH_YEAR

But I can't find them in this package so I tried to use 0 and then 1, hoping to find a good one by any luck but then it fails with the following error:

Uncaught TypeError: t[e] is not a function
    React 11
    unstable_runWithPriority scheduler.development.js:661
    React 5
    unstable_runWithPriority scheduler.development.js:661
    React 4
    Redux 7
    fetchOneResponseTimes actions.js:21
britecharts-react.min.js:49
    o React
    o self-hosted:954
    forEach self-hosted:225
    React 10
    commitRootImpl self-hosted:954
    unstable_runWithPriority scheduler.development.js:661
    React 4
    performSyncWorkOnRoot self-hosted:897
    flushSyncCallbackQueueImpl React
    unstable_runWithPriority scheduler.development.js:661
    React 4
    Redux 3
    handleChangeWrapper self-hosted:850

The package JavaScript seems to be minified, so it's unreadable πŸ€·β€β™‚οΈ.

Here is my code so far:

<ResponsiveContainer
              render={
                ({ width }) => (
                  <Line
                    axisTimeCombinations={2}
                    data={{ data: oneResponseTimes }}
                    lineCurve="basis"
                    margin={{
                      top: 60,
                      right: 30,
                      bottom: 60,
                      left: 70
                    }}
                    height={200}
                    width={width}
                  />
                )
              }
            />

BTW I can't get the <ResponsiveContainer> component to update the width.

Your Environment

  • Britecharts-React version used: latest (0.5.4)
  • Browser Name and version: Firefox 78.5.0esr (64-bit)
  • Operating System and version: Linux Debian Buster

Move into TypeScript

Expected Behavior

Move library to Typescript

Difference from Current Behavior

Right now is on JS with declaration files

Possible Implementation


// import { bullet as bulletChart } from 'britecharts';
// import bulletChart from 'britecharts/dist/umd/bullet.min';
// import bulletChart from 'britecharts/src/charts/bullet';
import bulletChart, { BulletChartData, BulletChartType } from './bulletD3Chart';

export const britechartsCustomEvents = ['customMouseOver', 'customMouseMove', 'customMouseOut', 'customClick'];

const isEventConfig = (configName: string) => britechartsCustomEvents.includes(configName);
const isNotEventConfig = (configName: string) => !isEventConfig(configName);

const setChartProperty = (
    chart: BulletChartType,
    configuration: Record<keyof BulletChartType, string>,
    key: keyof BulletChartType,
) => {
    if (configuration[key] || typeof configuration[key] === 'string') {
        chart[key](configuration[key]);
    }
};

export const applyConfiguration = (chart: BulletChartType, configuration: Record<keyof BulletChartType, string>) => {
    const configurationProperties = Object.keys(configuration);

    // Regular properties
    configurationProperties.filter(isNotEventConfig).forEach((key) => {
        setChartProperty(chart, configuration, key as keyof BulletChartType);
    });

    return chart;
};

const isNotCustomEvent = (configName: string) => !britechartsCustomEvents.includes(configName);

export const validateConfiguration = (chart: BulletChartType, configuration: Record<keyof BulletChartType, string>) => {
    const configurationProperties = Object.keys(configuration);
    const configurationPropertiesWithoutEvents = configurationProperties.filter(isNotCustomEvent);
    const supportedMethods = Object.keys(chart.prototype.constructor);

    const notSupportedMethods = configurationPropertiesWithoutEvents.filter(
        (methodName) => !supportedMethods.includes(methodName),
    );

    if (notSupportedMethods.length) {
        throw new Error(`Method not supported: ${notSupportedMethods.join(' ')}`);
    }

    return true;
};

type ContainerAnchor = HTMLElement & { __data__?: string };

const bullet = {
    create: (el: ContainerAnchor, data: BulletChartData[], configuration = {}) => {
        const container = select(el);
        const chart = bulletChart();

        if (validateConfiguration(chart, configuration as Record<keyof BulletChartType, string>)) {
            const configuredChart = applyConfiguration(chart, configuration as Record<keyof BulletChartType, string>);

            // Calls the chart with the container and dataset
            container.datum(data[0]).call(configuredChart);

            return chart;
        }
        return false;
    },

    update: (el: ContainerAnchor, data: BulletChartData[], configuration = {}, chart: any) => {
        const container = select(el);

        if (validateConfiguration(chart, configuration as Record<keyof BulletChartType, string>)) {
            applyConfiguration(chart, configuration as Record<keyof BulletChartType, string>);

            // Calls the chart with the container and dataset
            if (data && data.length) {
                container.datum(data[0]).call(chart);
            } else {
                container.call(chart);
            }

            return chart;
        }
        return false;
    },

    
    destroy: (el: ContainerAnchor) => {
        select(el).remove();
    },
};

export default bullet;

See the issue about the hooks for the component.

Context

Typescript seems to be the standard nowadays for libraries and React development.
It is easy for us doing this than maintaining the declaration files.

customClick method is not working

The customClick method is broken.

I tracked this comment #139 (comment) where they talk about it, it then gets implemented, but probably never tested.

Expected Behavior

When I use customClick in my React component, it should detect mouse clicks

Current Behavior

Javascript error: Uncaught Error: Method not supported by Britechart: customClick

Possible Solution

Add missing item on charts/constants.js

Steps to Reproduce

Create a component with customClick and the relevant function

Screenshots (if appropriate)

Screenshot 2021-01-16 at 09 06 09

Build system should copy the Britecharts styles into the dist folder

Expected Behavior

We want the user to use Britecharts' styles, so we will copy them into the dist folder of Britecharts-React

Current Behavior

Right now, users need to go and fetch those styles into the Britecharts node_modules folder

Possible Solution

Some kind of task that brings the styles in

Context

Making Britecharts React easier to work with

Importing withResponsiveness() helper

Hi Guys. Could you advise on the intended way to import the withResponsiveness helper?

Current Behaviour

In the docs it uses a relative import, which I assume is because you compile your docs examples (nice)

screen shot 2018-12-05 at 7 37 41 am

I've found the compiled version in britecharts-react/lib/esm/helpers and the below code works fine, but is quite long-winded:

import withResponsiveness from 'britecharts-react/lib/esm/helpers/withResponsiveness';

Expected Behaviour

I would like to import withResponsiveness() from the root, so:

import { Bar, withResponsiveness } from 'britecharts-react';

Possible Solution

Happy to submit a PR to fix this, just let me know :)

Your Environment

  • Version used: 0.4.1 with TypeScript 3.1 and React 16.6

Create Demo project using different compiling targets

Rationale

We want to have a small example project showing the different ways Britecharts-React can be added to our user's project.

Possible Solution

I would aim for a simple Create-react-app with a couple of demo pages showing how to bring in Britecharts-react through the different methods:

  • Using the CDN links
  • Using NPM with the whole bundle
  • Using NPM with individual umd files
  • Using NPM with individual commonjs files
  • Using NPM and webpack using the esm files

Context

This project will serve us in two ways:

  1. It will demonstrate different installation ways for our users
  2. It will help us test that those different bundling targets are working properly

How to change the font-size for the x- and y-axes?

I have been combing the docs looking for a way to change the font-size of the x- and y-axes for a barchart, but don't see an easy answer. I am able to enable labels at the ends of the bars (enableLabels) and resize the font for these (labelsSize), but as I said, no info that I can tell on changing font-size for the axes. Perhaps I am missing something obvious. See this forked codepen for an example of the problem. https://codepen.io/mvolny/pen/XWZrmXR. Code is simple and below Any help is appreciated. Thank you.

const {Bar} = window['britecharts-react'];
const barData = [
{
name: 'Radiating',
value: 2,
},
{
name: 'Opalescent',
value: 4,
},
{
name: 'Shining',
value: 3,
},
{
name: 'Vibrant',
value: 6,
},
{
name: 'Vivid',
value: 6,
},
{
name: 'Brilliant',
value: 1,
},
];
const marginObject = {
left: 100,
right: 40,
top: 40,
bottom: 40,
};

ReactDOM.render(
<Bar
data={barData}
width={400}
isHorizontal={true}
margin={marginObject}
enableLabels={true} //change labels but not x and y
labelsSize={15} //change labels but not x and y
/>,
document.getElementById('app')
);

Feature Proposal

Enable labels for stacked bar chart

I wanted to know if the stacked bar chart could have a total count value at the end of the bars similar to the single bar chart component.

Screen Shot 2019-07-17 at 12 19 35 PM

Screen Shot 2019-07-17 at 12 24 01 PM

Essentially the API should have an enableLabels for stacked bar charts too because it is a very important feature as it saves space and allows for a more readable and clean UI.

The data I want to display is formatted like [someAttribute] : [subAttribute1 : COUNT] [subAttribute2 : COUNT] and a stacked bar chart is the most appropriate display. However, I want to have a label at the end of the bars that displays the total count to make it more readable along with other tool tips that display information on the sub attributes.

RTL languages not supported in legend

Request for support of RTL languages

Expected Behavior

Full support for all languages

Current Behavior

Not supporting hebrew in legend component

Possible Solution

Please add the rtl support:)

Your Environment

  • Version used: last version.
  • Browser Name and version:
  • Operating System and version (desktop or mobile): mac OSX El capitan

image

Tooltip erroring when using responsive container in line chart

I've found a problem with the tooltip not being rendered correctly

Current Behavior

screen shot 2017-12-07 at 13 05 12

I've been trying to debug it and I've found that here path.nodes() returns [] which later breaks everything with a Uncaught TypeError: Cannot read property 'getTotalLength' of undefined in here.

Expected Behavior

It renders the tooltip correctly

Steps to Reproduce (for bugs)

  1. Checkout the branch used in https://github.com/eventbrite/britecharts-react/pull/72
  2. Run the documentation and go to the multiple lines with tooltip and responsive example
  3. Move the mouse through the chart

highlightSliceById prop of Donut component is not working

Expected Behavior

when defining the Donut component
<Donut data={data} highlightSliceById={2} />

on page load, I should visualize the donut chart with the slice out of the outer radius and the data shown in the center of the donut.

Current Behavior

It is not showing!

Possible Solution

I don't need a new solution. I just need that prop to work!

Your Environment

  • Version used: 0.5.1
  • Browser Name and version: Chrome
  • Operating System and version: Windows 10
  • Link to your project or codepen:

Update project's documentation

Expected Behavior

To offer correct and complete documentation on how to use the library.

Context | Current Behavior

The documentation offers a poor description on how to use the chart components as well on how to use the responsiveness helpers as described in the issue #144.

Possible Solution

  • Update the documentation with correct and tested code.
  • Offer correct and easy to find dataset examples to test the charts.
  • Offer CommonJS and ES5 examples on how to import and use the components.

Chart does not render with Tooltip when data is progressively added

Expected Behavior

When a chart is set to render with a tooltip and data is progressively added, the chart should render and update continuously. This works without a tooltip: https://codepen.io/anon/pen/zXPVba

Current Behavior

The chart renders, but the data line is not shown: https://codepen.io/anon/pen/EJbJGq

Possible Solution

Not sure, may be something I did wrong?

Steps to Reproduce (for bugs)

https://codepen.io/anon/pen/EJbJGq

Context

Trying to create a chart that displays live monitoring data, new datapoints are expected to be added at most every second.

Your Environment

Chrome Version 73.0.3683.103 (Official Build) (64-bit)
OSX mojave 10.14.4

Configure Release process to generate dist and docs in Travis

Expected Behavior

When we release a new version in NPM, we want Travis to build the new version of the docs and to generate the new distribution files.

Current Behavior

We have to do it manually before releasing

Possible Solution

It could be:

  • Prepare on package.json
  • Some other (research a bit)

Context

This will make our repo cleaner and our code reviews easier.
We could also implement this on Britecharts.

Create commonjs build target

Expected Behavior

We want to expose a commonjs versions of the modules. They would leave in /lib/cjs

Current Behavior

We just have umd

Possible Solution

Upgrading our build system to produce this

Legend Chart (vertical) breaking when combined with responsive containers

Expected Behavior

Vertical legend responds to changes in the width

Current Behavior

Right now, the legend responds properly to the responsive HOC (or container) if it is a horizontal legend, the vertical one renders extra elements:
britecharts_react_-_react_charting_library_based_in_britecharts

Possible Solution

Check out the updating of Britecharts for the legend.

Support TypeScript

It seems that the library doesn't have the Typescript types defined.
I tried to do npm i @types/britecharts-react but the module doesn't exist.

I used react-scripts-ts to create my react test project.

Below the TypeScript error I get from the compiler when I import the library:

Could not find a declaration file for module 'britecharts-react'. 'test-app/node_modules/britecharts-react/dist/britecharts-react.min.js' implicitly has an 'any' type.
Try npm install @types/britecharts-react if it exists or add a new declaration (.d.ts) file containing declare module 'britecharts-react';

StackedArea chart doesn't render correctly

I'm having issues when rendering the StackedArea chart in every browser.

Expected Behavior

The StackedArea chart should look as the default one in the demo.

Current Behavior

  • It shows a black background for the data representations.
  • Shows a black line across the Y axis
  • Shows a black line below the X axis

Steps to Reproduce (for bugs)

This is the code I'm using:

import { StackedArea, Tooltip } from 'britecharts-react';

const renderStackedAreaChart = props => <StackedArea width={800} {...props} />;

const StackedAreaChart = ({ data, title }) => (
    <Tooltip
        data={data}
        render={renderStackedAreaChart}
        title={title}
    />
);

and this is the data I'm passing to it:

const data = [
  { date: '2017-12-12T00:00:00Z', name: 'subscribed', value: 0 },
  { date: '2017-12-12T00:00:00Z', name: 'unsubscribed', value: 0 },
  { date: '2017-12-11T00:00:00Z', name: 'subscribed', value: 1 },
  { date: '2017-12-11T00:00:00Z', name: 'unsubscribed', value: 1 },
  { date: '2017-12-10T00:00:00Z', name: 'subscribed', value: 0 },
  { date: '2017-12-10T00:00:00Z', name: 'unsubscribed', value: 0 },
  { date: '2017-12-09T00:00:00Z', name: 'subscribed', value: 0 },
  { date: '2017-12-09T00:00:00Z', name: 'unsubscribed', value: 0 },
  { date: '2017-12-08T00:00:00Z', name: 'subscribed', value: 0 },
  { date: '2017-12-08T00:00:00Z', name: 'unsubscribed', value: 0 }
];

Screenshots (if appropriate):

stackedarea

Your Environment

  • Version used: 0.4.1
  • Browser Name and version: Chrome, Firefox, Safari (latest by 10/25/2018)
  • Operating System and version: macOS High Sierra

Parse error when when generating chart boilerplate via plop

Hi there! I wanted to take a stab at creating a Scatter Plot, but I'm getting an error when I try to use plop to generate the boilerplate code.

Expected Behavior

Plop should generate 7 boilerplate files for a Scatter Plot.

Current Behavior

I get the following error:

? Component name (with PascalCase capitalization, eg StackedArea) ScatterPlot
[SUCCESS] add /src/charts/scatterPlot/scatterPlotChart.test.js
[SUCCESS] add /src/charts/scatterPlot/scatterPlotChart.js
[SUCCESS] add /src/charts/scatterPlot/scatterPlotChart.fixtures.js
[SUCCESS] add /src/charts/scatterPlot/ScatterPlot.js
[FAILED] add Parse error on line 26:
...lCase componentName }    }Data.firstDat
-----------------------^
Expecting 'CLOSE_RAW_BLOCK', 'CLOSE', 'CLOSE_UNESCAPED', 'OPEN_SEXPR', 'CLOSE_SEXPR', 'ID', 'EQUALS', 'OPEN_BLOCK_PARAMS', 'STRING', 'NUMBER', 'BOOLEAN', 'UNDEFINED', 'NULL', 'DATA', 'SEP', got 'INVALID'
[FAILED] add src/charts/{{camelCase componentName}}/Readme.md Aborted due to previous action failure
[FAILED] add src/charts/{{camelCase componentName}}/Checklist.md Aborted due to previous action failure

Possible Solution

Looks like maybe a missing bracket in Component.test.js. I couldn't find the fix after a few minutes but i may give it another go later and submit a PR if I fix it.

Your Environment

  • Version used: Node v11.2.0
  • Operating System and version: macOS 10.14.2

Tooltip with StackedBar not being rendered

Expected Behavior

When I add a Tooltip for a StackedBar, I expect the tooltip being rendered along with the chart. This is also happening to me on Bar charts.

Current Behavior

The tooltip is not being rendered. I created a small pen to show you the behavior. I started from a similar pen which worked for Line charts.

The chart is being rendered, but the tooltip is not being rendered.

Possible Solution

Not sure, if it's not implemented yet or if it should be rendered but I'm missing something. I thought that the tooltip worked since on the documentation there's this mention:

The tooltip component is a great companion to the line, stacked area, stacked bar and grouped bar charts.

Steps to Reproduce (for bugs)

Please, check this pen: https://codepen.io/juanpaucar/pen/maJrgQ

Screenshots (if appropriate):

Context

I just started using this charts and it seemed weird to me that they don't work for Bar and Stacked Bar.

Your Environment

Ubuntu 18.04
Node 10.13.0
Britecharts and Britecharts-react latests versions
https://codepen.io/juanpaucar/pen/maJrgQ

Cant set tooltip title to empty string

When using the <Tooltip /> chart. It is not possible to set an empty title

Expected Behavior

When I set the Tooltip with an empty title <Tooltip title="" /> the tooltip should not render a "tooltip title"

Current Behavior

The tooltip is set to the default title "Tooltip title" instead of only the formattedDate

Possible Solution

The setChartProperty in src/charts/helpers/configuration.js do a false check for configuration[key], this will not allow setting empty sting hence they evaluate as falsy

Steps to Reproduce (for bugs)

  1. Create a Chart with a Tooltip
  2. Set the tooltip title to an empty string
  3. Render the Chart with Tooltip

screen shot 2018-04-04 at 11 01 48

Context

I would like to a accomplice the Britechart tooltip API for title

<static> title(_x)
Gets or Sets the title of the tooltip (to only show the date, set a blank title)

http://eventbrite.github.io/britecharts/module-Tooltip.html#.title__anchor

Your Environment

  • Version used: 0.4.0
  • Browser Name and version: Chrome 65.0.3325
  • Operating System and version: MacOs 10.13.3

Move implementation into Hooks

Expected Behavior

Component wrapper should be a hooks based implementation

Difference from Current Behavior

Right now we have classes

Possible Implementation

I have a good example here:

/* eslint-disable */
import React, { useState, useEffect, useRef } from 'react';

import bullet from './bulletChartWrapper';

export interface BulletChartProps {
    /**
     * Internally used, do not overwrite.
     */
    data: {
        ranges: number[];
        measure: number;
    }[];

    /**
     * Gets or Sets the height of the chart
     */
    height?: number;

    /**
     * Gets or Sets the margin of the chart
     */
    margin?: { top?: number; bottom?: number; left?: number; right?: number };

    /**
     * Gets or Sets the number format of the bar chart
     * See examples in https://observablehq.com/@d3/d3-format
     */
    numberFormat?: string;

    /**
     * Gets or Sets the distance between the range labels and the chart
     */
    paddingBetweenLabelsAndChart?: number;

    /**
     * Gets or Sets the width of the chart
     */
    width?: number;

    /**
     * Internally used, do not overwrite.
     *
     * @ignore
     */
    chart?: any;
}

const getChartConfiguration = (props: BulletChartProps) => {
    let configuration: Partial<BulletChartProps> = { ...props };

    delete configuration.data;
    delete configuration.chart;

    return configuration;
};

type ChartFileType = {
    destroy: (node: HTMLElement) => void;
    create: () => ChartFileType;
    update: () => void;
} | null;

export const Bullet: React.FC<BulletChartProps> = (props) => {
    const { data, chart } = props;
    const rootRef = useRef<HTMLDivElement>(null);
    let [chartInstance, setChartInstance] = useState<ChartFileType>(null);

    useEffect(() => {
        if (!chartInstance && data !== null) {
            console.log('Bullet:::Create!');
            const chartI = chart.create(
                rootRef.current,
                data,
                getChartConfiguration(props)
            );

            // We cannot save functions using useState directly
            // See https://medium.com/swlh/how-to-store-a-function-with-the-usestate-hook-in-react-8a88dd4eede1
            setChartInstance(() => chartI);
        }

        return function cleanup() {
            console.log('Bullet:::Clean up');
            if (chartInstance && rootRef && rootRef.current) {
                console.log('Bullet:::Destroy!');
                chart.destroy(rootRef.current);
            }
        };
    }, []);

    useEffect(() => {
        if (chartInstance) {
            console.log('Bullet:::Update!');
            chart.update(
                rootRef.current,
                data,
                getChartConfiguration(props),
                chartInstance
            );
        }
    }, [data, rootRef, props]);

    return <div className="bullet-container" ref={rootRef} />;
};

Bullet.defaultProps = {
    chart: bullet,
};

export default Bullet;


Context

Modernizing the library

Create loading states for charts

Expected Behavior

We would like to provide a default loading state for the charts that can be configured.
It will be an svg element with an animation.

Current Behavior

Right now, users will need to specify the loading states for each chart.

Possible Solution

Make the loading state show when the data is empty and render the real chart when it is something other than an empty list.

loading-animation

Update Node

Update node to the last long term supported version

Use 'update' instead of remove and re-create the charts

Expected Behavior

We should be using the chart's file 'update' instead of removing and creating the chart again when new properties are passed in

Possible Solution

Explore the use of update

Context

We should try to update instead of re-create the chart for obvious performance reasons

Improve charts mock data

Current Behavior

I started working in the line chart, and I realised that the testData file is getting quite big, and it will be a pain to work with it pretty soon

Possible Solution

I've thought about having the mock data in the same folder as the chart/component, for example:

charts/
β”œβ”€β”€ line/
|   β”œβ”€β”€ lineChart.js               // chart code
|   β”œβ”€β”€ lineChart.spec.js          // chart-specific unit tests
|   β”œβ”€β”€ lineChart.fixtures.js      // any mock data the chart tests / examples might need
|   β”œβ”€β”€ LineComponent.js           // component-specific code
|   └── LineComponent.spec.js      // component-specific unit tests

What do you think?

Add favicons and more configuration to the docs homepage

Expected Behavior

We want to add the following:

<link rel="apple-touch-icon" sizes="180x180" href="/docs/icons/apple-touch-icon.png">
<link rel="icon" type="image/png" sizes="32x32" href="/docs/icons/favicon-32x32.png">
<link rel="icon" type="image/png" sizes="16x16" href="/docs/icons/favicon-16x16.png">
<link rel="manifest" href="/docs/icons/manifest.json">
<link rel="mask-icon" href="/docs/icons/safari-pinned-tab.svg" color="#5bbad5">
<link rel="shortcut icon" href="/docs/icons/favicon.ico">
<meta name="msapplication-config" content="/docs/icons/browserconfig.xml">
<meta name="theme-color" content="#45494e”>

Along with the project's icons.
favicons.zip

Context

Polishing the docs homepage

Styling ticks to fix offset and overlap

I trying to fix the styling of the ticks and their labels.

The tick labels of my y-axis seem to be offset. This can be fixed with a simple styling overwrite, but how would you guys go about doing this exactly?

The tick labels of my x-axis seem to be overlapping when there are a lot of columns which is very frustrating, since I cannot control the number of ticks in the x domain.

Screenshots (if appropriate):

image

Bug - Sparkline is drawn twice on render

For some reason, the Sparkline chart is being re-rendered on refresh instead of doing it just once. This happens only for animated chart. Look at GIF screenshot

Expected Behavior

Should render animated chart once without re-drawing.

Current Behavior

Draws Sparkline with animation twice

Possible Solution

Something has to do with update and animation. React chart component is probably changing the state when it doesn't need to.

Steps to Reproduce (for bugs)

  1. Go to Sparkline chart section
  2. Refresh the page

Screenshots (if appropriate):

britecharts_sparkline_bug

Your Environment

  • Version used:
  • Browser Name and version: Chrome
  • Operating System and version:
  • Link to your project or codepen:

Bar Chart Y-axis name value getting truncated to '...'

I am trying to create a horizontal bar chart with multiple categories. Upon loading the data in the specified format, I am seeing issues with the name label on my Y-axis being truncated to '...' instead of showing the full name.

Tried setting the width to a large value but too no avail. I also see in the HTML that is generated that it is not a CSS issue, as the values are coded as '...' in the HTML.

Is britecharts-react doing something behind the curtains? Also wanted to know if there are options to pass in to style the y-axis labels.

I tried yAxisLabelOffset={-200} and it gives an error.

Error: Method not supported by Britechart: yAxisLabelOffset

Expected Behavior

Show full name of label value.

Current Behavior

Truncate label as "xxx ..." or the entire name label as "..."

Steps to Reproduce (for bugs)

  1. Data
        "errorBarChart": [
            {
                "value": 0,
                "name": "Undefined"
            },
            {
                "value": 0,
                "name": "AssertionError"
            },
            {
                "value": 14,
                "name": "IllegalArgument"
            },
            {
                "value": 0,
                "name": "SQL Error"
            },
            {
                "value": 1,
                "name": "NoSuchElementException"
            },
            {
                "value": 0,
                "name": "Error - ENV"
            },
            {
                "value": 0,
                "name": "Expected URL"
            },
            {
                "value": 0,
                "name": "Loading"
            },
            {
                "value": 0,
                "name": "Timeout"
            }
        ]
  1. JSX
            <Paper className={classes.paper}>
              <h2>Bar Charts</h2>
              <Bar
                height={300}
                width={900}
                isHorizontal
                isAnimated
                shouldShowLoadingState={false}
                data={errorBarChart}
                colorSchema={colors.colorSchemas.britecharts}
              />
            </Paper>
  1. See screenshot for more info

Screenshots (if appropriate):

image
image

image

Context

Your Environment

  • Version used: ^0.4.1
  • Browser Name and version: Chrome Version 69.0.3497.100 (Official Build) (64-bit)
  • Operating System and version: MacOS
  • Link to your project or codepen:

Support Locale in Bar Chart

The Britecharts library introduced options to set the locale for the bar chart.
This enables overriding the standard number formatting and for example use different decimal separators and/or currency symbols in the axis labels and the bars labels.

Expected Behavior

Being able to change the locale, e.g. allow GBP or EUR sign be used for number formatting.

Difference from Current Behavior

No locale setting(s) available in the bar chart component.

Possible Implementation

Introduce a new property to pass the locale information as an object into Britecharts.

Context

Format monetary values e.g. as "1.3k Euro" or "1325 €" in the bar labels.

Link to relevant commit in Britecharts repo:

Dec 12, 2019 - 96c665753fd31f265f31a095f6fea95200fdaaa2

npm start failed

Failed to compile.

./src/charts/helpers/validation.js

/work/d3/britecharts-react-master/src/charts/helpers/validation.js
24:30 warning 'data' is defined but never used no-unused-vars

βœ– 1 problem (0 errors, 1 warning)

@ ./src/charts/bar/barChart.js 13:18-50
@ ./src/charts/bar/Bar.js
@ multi (webpack)-dev-server/client?http://localhost:8080 ./src/charts/bar/Bar.js

When Tooltip is used with a child chart, and it receives new props, the child chart never updates

Expected Behavior

The child chart should update when props are swapped

Current Behavior

The child chart does not update

Possible Solution

Steps to Reproduce (for bugs)

  1. Create a chart with the Tooltip parent and a child chart (ex. StackedArea), with a valid data prop
  2. Pass a new valid data prop to the child chart
  3. Notice that child chart does not re-render with new data

Context

The reason this happens is because we are rendering the child chart in Tooltip's constructor function, which only gets run on instantiation.

Even passing new props directly to the child chart does not seem to help.

We probably need to refactor the way the Tooltip interacts with its child chart.

Your Environment

  • Version used:
  • Browser Name and version:
  • Operating System and version:
  • Link to your project or codepen:

Recommend Projects

  • React photo React

    A declarative, efficient, and flexible JavaScript library for building user interfaces.

  • Vue.js photo Vue.js

    πŸ–– Vue.js is a progressive, incrementally-adoptable JavaScript framework for building UI on the web.

  • Typescript photo Typescript

    TypeScript is a superset of JavaScript that compiles to clean JavaScript output.

  • TensorFlow photo TensorFlow

    An Open Source Machine Learning Framework for Everyone

  • Django photo Django

    The Web framework for perfectionists with deadlines.

  • D3 photo D3

    Bring data to life with SVG, Canvas and HTML. πŸ“ŠπŸ“ˆπŸŽ‰

Recommend Topics

  • javascript

    JavaScript (JS) is a lightweight interpreted programming language with first-class functions.

  • web

    Some thing interesting about web. New door for the world.

  • server

    A server is a program made to process requests and deliver data to clients.

  • Machine learning

    Machine learning is a way of modeling and interpreting data that allows a piece of software to respond intelligently.

  • Game

    Some thing interesting about game, make everyone happy.

Recommend Org

  • Facebook photo Facebook

    We are working to build community through open source technology. NB: members must have two-factor auth.

  • Microsoft photo Microsoft

    Open source projects and samples from Microsoft.

  • Google photo Google

    Google ❀️ Open Source for everyone.

  • D3 photo D3

    Data-Driven Documents codes.