stackview 🧊👀
Interactive image stack viewing in jupyter notebooks based on ipycanvas and ipywidgets. TL;DR:
stackview.curtain(image, labels, continuous_update=True)
Installation
stackview can be installed using conda or pip.
conda install -c conda-forge stackview
OR
pip install stackview
If you run the installation from within a notebook, you need to restart Jupyter (not just the kernel), before you can use stackview.
Usage
You can use stackview from within jupyter notebooks as shown below.
Also check out the demo in
There is also a notebook demonstrating how to use stackview in Google Colab.
More example notebooks can be found in this folder.
Starting point is a 3D image dataset provided as numpy array.
from skimage.io import imread
image = imread('data/Haase_MRT_tfl3d1.tif', plugin='tifffile')
Slice view
You can then view it slice-by-slice:
import stackview
stackview.slice(image, continuous_update=True)
Static insight views
The insight function turns a numpy-array into a numpy-compatible array that has an image-display in jupyter notebooks.
insight(image[60])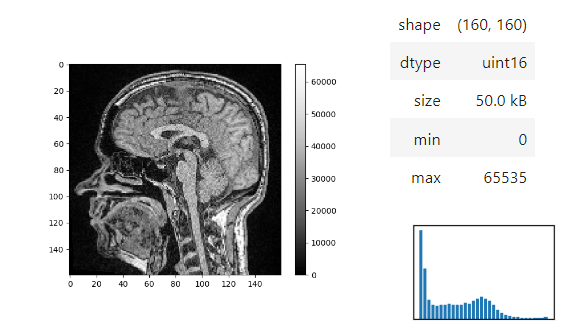
Images of 32-bit and 64-bit type integer are displayed as labels.
blobs = imread('data/blobs.tif')
labels = label(blobs > 120)

insight(labels)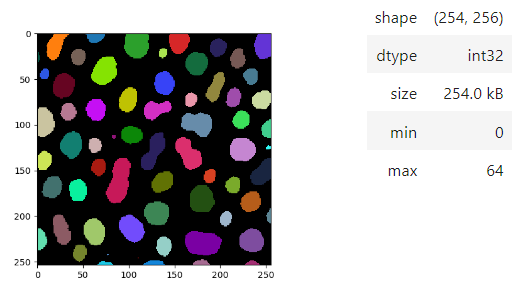
Annotate regions
To create label images interactively, e.g. for machine learning training, the stackview.annotate function offers basic label drawing tools.
Click and drag for drawing. Hold the ALT key for erasing.
Annotations are drawn into a labels image you need to create before drawing.
import numpy as np
labels = np.zeros(image.shape).astype(np.uint32)

stackview.annotate(image, labels)
Note: In case the interface is slow, consider using smaller images, e.g. by cropping or resampling.
Pick intensities
To read the intensity of pixels where the mouse is moving, use the picker.
stackview.picker(image, continuous_update=True)
Orthogonal view
Orthogonal views are also available:
stackview.orthogonal(image, continuous_update=True)
Curtain
Furthermore, to visualize an original image in combination with a processed version, a curtain view may be helpful:
stackview.curtain(image, modified_image * 65537, continuous_update=True)
The curtain also works with 2D data. Btw. to visualize both images properly, you need adjust their grey value range yourself. For example, multiply a binary image with 255 so that it visualizes nicely side-by-side with the original image in 8-bit range:
binary = (slice_image > threshold_otsu(slice_image)) * 255
stackview.curtain(slice_image, binary, continuous_update=True)
The same also works with label images
from skimage.measure import label
labels = label(binary)
stackview.curtain(slice_image, labels, continuous_update=True)
Side-by-side view
A side-by-side view for colocalization visualization is also available. If you're working with time-lapse data, you can also use this view for visualizing differences between timepoints:
stackview.side_by_side(image_stack[1:], image_stack[:-1], continuous_update=True, display_width=300)
Switch
The switch function allows to switch between a list or dictionary of images.
stackview.switch([
    slice_image,
    binary,
    labels
])
Switch toggleable
You can also view multiple channels with different colormaps at the same time using the toggleable parameter of switch.
It is recommended to also pass a list of colormaps. Colormap names can be taken from Matplotlib and stackview aims at compatibility with microfilm.
hela_cells = imread("data/hela-cells.tif")

stackview.switch(
    {"lysosomes":   hela_cells[:,:,0],
     "mitochondria":hela_cells[:,:,1],
     "nuclei":      hela_cells[:,:,2]
    },
    colormap=["pure_magenta", "pure_green", "pure_blue"],
    toggleable=True
)
Crop
You can crop images interactively:
crop_widget = stackview.crop(image_stack, continuous_update=True)
crop_widget
... and retrieve the crop range as a tuple of slice objects:
r = crop_widget.range
r
Output:
(slice(0, 40, 1), slice(40, 80, 1), slice(80, 120, 1))
... or you can crop the image directly:
cropped_image = crop_widget.crop()
cropped_image.shape
Output:
(40, 40, 40)
Interact
Exploration of the parameter space of image processing functions is available using interact:
from skimage.filters.rank import maximum
stackview.interact(maximum, slice_image)
This might be useful for custom functions implementing image processing workflows:
from skimage.filters import gaussian, threshold_otsu, sobel
def my_custom_code(image, sigma:float = 1, show_labels: bool = True):
    sigma = abs(sigma)
    blurred_image = gaussian(image, sigma=sigma)
    binary_image = blurred_image > threshold_otsu(blurred_image)
    edge_image = sobel(binary_image)

    if show_labels:
        return label(binary_image)
    else:
        return edge_image * 255 + image

stackview.interact(my_custom_code, slice_image)
If you want to use a pulldown for selecting input image(s), you need to pass a dictionary of (name, image) pairs as context, e.g. context=globals():
image1 = imread("data/Haase_MRT_tfl3d1.tif")
image2 = image1[:,:,::-1]

stackview.interact(gaussian, context=globals(), continuous_update=True)
To add an insight-view automatically to results of functions, you can add this.
@jupyter_displayable_output
def my_gaussian(image, sigma):
    return gaussian(image, sigma)

my_gaussian(image[60], 2)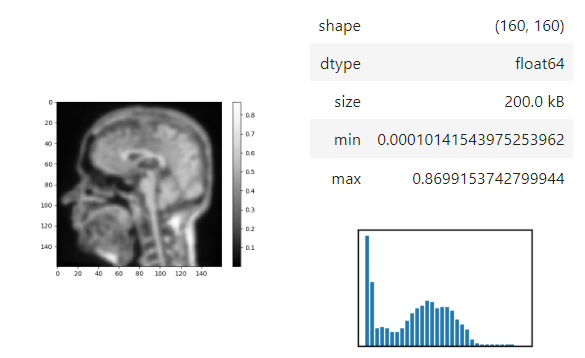
Assist
The stackview.assist() function can guide you through all imported (and supported) image processing functions.
Note: The interface may be slow or crash if you have many functions imported. Consider using it in an empty notebook
with only functions or library imported that might be relevant for the taks.
stackview.assist(context=globals(), continuous_update=True)
Contributing
Contributions, bug-reports and ideas for further development are very welcome.
License
Distributed under the terms of the BSD-3 license, "stackview" is free and open source software
Issues
If you encounter any problems, please create a thread on image.sc along with a detailed description and tag @haesleinhuepf.
See also
There are other libraries doing similar stuff