GithubHelp home page GithubHelp logo

holoviz / holoviews Goto Github PK

View Code? Open in Web Editor NEW
2.7K 59.0 397.0 32.27 MB

With Holoviews, your data visualizes itself.

Home Page: https://holoviews.org

License: BSD 3-Clause "New" or "Revised" License

Python 99.66% HTML 0.30% Jupyter Notebook 0.03% Shell 0.01%
holoviz holoviews plotting

holoviews's Introduction

HoloViews logo HoloViews

Stop plotting your data - annotate your data and let it visualize itself.

Downloads https://pypistats.org/packages/holoviews https://anaconda.org/pyviz/holoviews
Build Status Build Status
Coverage codecov
Latest dev release Github tag dev-site
Latest release Github release PyPI version holoviews version conda-forge version defaults version
Python Python support
Docs DocBuildStatus site
Binder Binder
Support Discourse

HoloViews is an open-source Python library designed to make data analysis and visualization seamless and simple. With HoloViews, you can usually express what you want to do in very few lines of code, letting you focus on what you are trying to explore and convey, not on the process of plotting.

Check out the HoloViews web site for extensive examples and documentation.

Installation

HoloViews works with Python on Linux, Windows, or Mac, and works seamlessly with Jupyter Notebook and JupyterLab.

You can install HoloViews either with conda or pip, for more information see the install guide.

conda install holoviews

pip install holoviews

Developer Guide

If you want to help develop HoloViews, you can checkout the developer guide, this guide will help you get set-up. Making it easy to contribute.

Support & Feedback

If you find any bugs or have any feature suggestions please file a GitHub issue.

If you have any usage questions, please ask them on HoloViz Discourse,

For general discussion, we have a Discord channel.

holoviews's People

Stargazers

 avatar  avatar  avatar  avatar  avatar  avatar  avatar  avatar  avatar  avatar  avatar  avatar  avatar  avatar  avatar  avatar  avatar  avatar  avatar  avatar  avatar  avatar  avatar  avatar  avatar  avatar  avatar  avatar  avatar  avatar  avatar  avatar  avatar  avatar  avatar  avatar  avatar  avatar  avatar  avatar  avatar  avatar  avatar  avatar  avatar  avatar  avatar  avatar  avatar  avatar  avatar  avatar  avatar  avatar  avatar  avatar  avatar  avatar  avatar  avatar  avatar  avatar  avatar  avatar  avatar  avatar  avatar  avatar  avatar  avatar  avatar  avatar  avatar  avatar  avatar  avatar  avatar  avatar  avatar  avatar  avatar  avatar  avatar  avatar  avatar  avatar  avatar  avatar  avatar  avatar  avatar  avatar  avatar  avatar  avatar  avatar  avatar  avatar  avatar  avatar

Watchers

 avatar  avatar  avatar  avatar  avatar  avatar  avatar  avatar  avatar  avatar  avatar  avatar  avatar  avatar  avatar  avatar  avatar  avatar  avatar  avatar  avatar  avatar  avatar  avatar  avatar  avatar  avatar  avatar  avatar  avatar  avatar  avatar  avatar  avatar  avatar  avatar  avatar  avatar  avatar  avatar  avatar  avatar  avatar  avatar  avatar  avatar  avatar  avatar  avatar  avatar  avatar  avatar  avatar  avatar  avatar  avatar  avatar  avatar  avatar

holoviews's Issues

Collector and Collator tutorial

We will want a tutorial on Collector and Collator which are currently undocumented.

In short:

  • Collector lets you collect HoloViews data structures over some dimension that is difficult to traverse using a set of callable objects (functions, callable classes) on each step. For instance, this is useful if you are collecting data in real-time (and need to periodically run a number of measurements) or if you are running a slow simulator, you wish to collect multiple analyses at each simulation time increment (instead of running the simulator N times).
  • Collator lets you collate disparate HoloViews objects that are already available (e.g. in memory or on disk) into a cohesive structure with unified dimension structure. This is useful for collating lots of pickle files that may be generated on a cluster using a batch job system (e.g Sun Grid Engine).

This would be a natural entry point to Lancet where we can discuss how to use HoloViews with external software running either locally or on compute clusters.

Slicing over (hv.Image * hv.VLine)

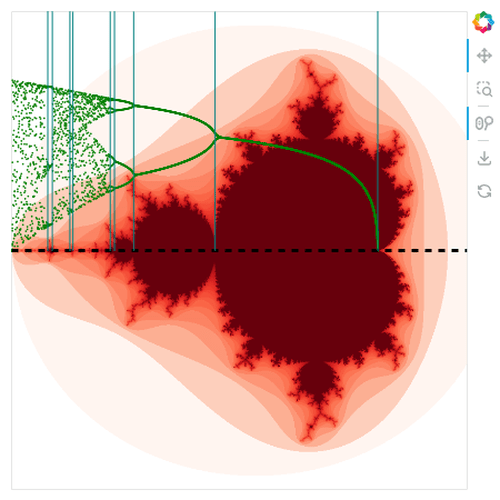
hv.Image and hv.VLine both have x bounds from (0,2).

When I do:

d={x: (fractal * hv.VLine(x)) for x in dots}
hv.HoloMap(d, key_dimensions=['B'])[0:1]

Only the VLine will go to one, but the Image is still from 0 to 2.

holoviews.info

hv.help(object, visualization=True)

Says:

To see the options info for one of these target specifications,
which are of the form {type}[.{group}[.{label}]], do holoviews.info({type}).

But hv.info does not exists

Identifiers starting with underscores don't immediately tab-complete

With our new identifier sanitization system, you can set labels that start with underscores or with special characters not normally allowed in attribute names. The result is a string that starts with a single underscore (never two though!) for use in the tree object (e.g. AttrTree, Layout, `OverlayorOptionTree``).

All this is fairly general but I am worried that this behavior may end up being confusing to users. The issue with attributes starting with a single underscore aren't presented for tab-completion in the notebook - at least not until you know that you have to suggest the initial underscore yourself.

This means that it may appear to users that elements on their Layouts have vanished even though they are actually available (but hidden). I have no way of changing the IPython tab-completion behavior so one suggestion may be to generate a warning to discourage labels/group strings starting with underscores or special characters.

There could be a way to disable this warning but I'm not sure this is necessarily a good idea - the lack of obvious tab-completion when there is a leading underscore is present could be pretty confusing. It is better (in my opinion) to always warn people who are setting unsuitable labels/groups that they are doing something that is allowed but potentially very confusing to other people.

One other idea is that we could implement our own __dir__ method which does give us some control over what IPython presents for tab-completion (still not underscore though). For instance, we could stop showing all the tab-completable attributes once a hidden one has been specified (the dictionary style interface is still available). At least this would help avoid tree where only some of the paths are easily visible while others are hidden.

Thoughts?

Working with IPython.widgets.interact (feature request)

Plotting a HoloMaps for my (big) dataset takes nearly 10 minutes, so I thought I could use IPython.widgets.interact to create the plots on the fly like:

from IPython.html.widgets import interact
import holoviews as hv

def plot_graphs(xsize, ysize):
    return hv.Image(np.random.randn(xsize, ysize))

interact(plot_graphs, xsize=(0, 100, 10), ysize=(0, 100, 10))

Unfortunately this doesn't plot anything. Would it be difficult to support this? Or potentially an option which doesn't pregenerates all plots in one go?

Bug: Translation between coordinates

Code:
XX,YY = np.mgrid[0:60,0:80]
hv.Image(XX+YY).sample(y=-0.4)

Error:

IndexError Traceback (most recent call last)
in ()
1 XX,YY = np.mgrid[0:60,0:80]
----> 2 hv.Image(XX+YY).sample(y=-0.4)

/usr/local/lib/python2.7/dist-packages/holoviews/element/raster.pyc in sample(self, samples, *_sample_values)
111 # Sample data
112 x_vals = sorted(set(self.dimension_values(dimension)))
--> 113 data = list(zip(x_vals, self.data[sample]))
114 params['key_dimensions'] = other_dimension
115 return Curve(data, *_params)

IndexError: index 72 is out of bounds for axis 0 with size 60

ignore nan in hist()

I tried the example

((fractal * HLine(y=0)).hist() + fractal.sample(y=0))

on my own data, but .hist() doesn't handle np.NaN values.

Traceback (most recent call last):
  File "/home/bnijholt/python/env_stable/lib/python2.7/site-packages/holoviews/ipython/display_hooks.py", line 203, in wrapped
    **kwargs)
  File "/home/bnijholt/python/env_stable/lib/python2.7/site-packages/holoviews/ipython/display_hooks.py", line 279, in layout_display
    return display_figure(fig)
  File "/home/bnijholt/python/env_stable/lib/python2.7/site-packages/holoviews/ipython/display_hooks.py", line 168, in display_figure
    figdata = renderer.figure_data(fig, figure_format)
  File "/home/bnijholt/python/env_stable/lib/python2.7/site-packages/holoviews/plotting/__init__.py", line 252, in figure_data
    fig.canvas.print_figure(bytes_io, **kw)
  File "/home/bnijholt/python/env_stable/lib/python2.7/site-packages/matplotlib/backend_bases.py", line 2168, in print_figure
    bbox = a.get_window_extent(renderer)
  File "/home/bnijholt/python/env_stable/lib/python2.7/site-packages/matplotlib/patches.py", line 491, in get_window_extent
    return self.get_path().get_extents(self.get_transform())
  File "/home/bnijholt/python/env_stable/lib/python2.7/site-packages/matplotlib/path.py", line 518, in get_extents
    transform = transform.frozen()
  File "/home/bnijholt/python/env_stable/lib/python2.7/site-packages/matplotlib/transforms.py", line 2067, in frozen
    return blended_transform_factory(self._x.frozen(), self._y.frozen())
  File "/home/bnijholt/python/env_stable/lib/python2.7/site-packages/matplotlib/transforms.py", line 2201, in blended_transform_factory
    return BlendedAffine2D(x_transform, y_transform)
  File "/home/bnijholt/python/env_stable/lib/python2.7/site-packages/matplotlib/transforms.py", line 2148, in __init__
    assert y_transform.is_separable
AssertionError

Is it possible to make it ignore these values?

Dimension range should be ignored when tabulating raster elements

The output of the following snippet is affected by the declared ranges when it shouldn't be (the table should only be affected by the shape of the array and the declared bounds):

import holoviews as hv
import numpy as np

data = np.ones((3,3))
hv.Image(data, bounds=(0,0,100,100), 
         key_dimensions=[hv.Dimension('x', range=(-200,200)), 
                         hv.Dimension('y', range=(-200,200))]).table()

Add explicit documentation for the output magic

We have no real breakdown of the different widget types, backend options, figure types etc.. We should probably add a Tutorial notebook to explain how to select different backends and what trade-offs they have compared to each other.

Ability to define placeholders in Layouts

Currently it isn't as easy as it should be to define placeholders in Layouts. For instance, you may always want a four element Layout but the third item may sometimes be missing.

We have considered introducing the concept of 'empty' elements for this but haven't committed to this approach as we want as few changes to our Element constructors as possible.

Unicode support

I like to use unicode characters in my plots. In order to obtain this:
from __future__ import unicode_literals

However, now the HoloMap doesn't work anymore.

Here an example from the tutorials page. When skipping the first line, this works like a charm, however, the first import breaks it al:

from __future__ import unicode_literals
import numpy as np
import holoviews as hv
%load_ext holoviews.ipython

def sine(x, phase=0, freq=100):
    return np.sin((freq * x + phase))

phases = np.linspace(0,2*np.pi,11) # Explored phases
freqs = np.linspace(50,150,5)      # Explored frequencies
dist = np.linspace(-0.5,0.5,202)   # Linear spatial sampling
x,y = np.meshgrid(dist, dist)
grid = (x**2+y**2)                 # 2D spatial sampling
dimensions = ['Phase', 'Frequency']
keys = [(p,f) for p in phases for f in freqs]
items = [(k, hv.Image(sine(grid, *k), value_dimensions=['Amplitude'])) for k in keys]
circular_wave = hv.HoloMap(items, key_dimensions=dimensions)
circular_wave
---------------------------------------------------------------------------
ValueError                                Traceback (most recent call last)
<ipython-input-1-dc5f36c4abcf> in <module>()
     14 dimensions = ['Phase', 'Frequency']
     15 keys = [(p,f) for p in phases for f in freqs]
---> 16 items = [(k, hv.Image(sine(grid, *k), value_dimensions=['Amplitude'])) for k in keys]
     17 circular_wave = hv.HoloMap(items, key_dimensions=dimensions)
     18 circular_wave

/usr/local/lib/python2.7/dist-packages/holoviews/element/raster.pyc in __init__(self, data, bounds, xdensity, ydensity, **params)
    325 
    326         SheetCoordinateSystem.__init__(self, bounds, xdensity, ydensity)
--> 327         Element2D.__init__(self, data, extents=self.lbrt, bounds=bounds, **params)
    328 
    329         if len(self.data.shape) == 3:

/usr/local/lib/python2.7/dist-packages/holoviews/core/element.pyc in __init__(self, data, extents, **params)
    144         self._xlim = None if extents is None else (extents[0], extents[2])
    145         self._ylim = None if extents is None else (extents[1], extents[3])
--> 146         super(Element2D, self).__init__(data, **params)
    147 
    148     @property

/usr/local/lib/python2.7/dist-packages/holoviews/core/element.pyc in __init__(self, data, **params)
     43 
     44     def __init__(self, data, **params):
---> 45         super(Element, self).__init__(data, **params)
     46 
     47 

/usr/local/lib/python2.7/dist-packages/holoviews/core/dimension.pyc in __init__(self, data, **params)
    432                 else:
    433                     dimensions = [d if isinstance(d, Dimension) else Dimension(d)
--> 434                                   for d in params.pop(group)]
    435                 params[group] = dimensions
    436         super(Dimensioned, self).__init__(data, **params)

/usr/local/lib/python2.7/dist-packages/holoviews/core/dimension.pyc in __init__(self, name, **params)
     85         else:
     86             existing_params = {'name': name}
---> 87         super(Dimension, self).__init__(**dict(existing_params, **params))
     88 
     89 

/usr/local/lib/python2.7/dist-packages/param/parameterized.pyc in __init__(self, **params)
   1002         self.__generate_name()
   1003 
-> 1004         self._setup_params(**params)
   1005         object_count += 1
   1006 

/usr/local/lib/python2.7/dist-packages/param/parameterized.pyc in override_initialization(parameterized_instance, *args, **kw)
    939         original_initialized=parameterized_instance.initialized
    940         parameterized_instance.initialized=False
--> 941         fn(parameterized_instance,*args,**kw)
    942         parameterized_instance.initialized=original_initialized
    943     return override_initialization

/usr/local/lib/python2.7/dist-packages/param/parameterized.pyc in _setup_params(self, **params)
   1383                 self.warning("Setting non-parameter attribute %s=%s using a mechanism intended only for parameters",name,val)
   1384             # i.e. if not desc it's setting an attribute in __dict__, not a Parameter
-> 1385             setattr(self,name,val)
   1386 
   1387 

/usr/local/lib/python2.7/dist-packages/param/parameterized.pyc in __set__(self, obj, val)
    528     def __set__(self,obj,val):
    529         if not isinstance(val,str) and not (self.allow_None and val is None):
--> 530             raise ValueError("String '%s' only takes a string value."%self._attrib_name)
    531 
    532         super(String,self).__set__(obj,val)

ValueError: String 'name' only takes a string value.

Integrating unit support

One of the major benefits of using HoloViews over basic plotting libraries is that it allows the user to optionally provide metadata about their data via Dimension objects. This makes HoloViews job of correctly labeling charts and coordinating different subplots easy. Currently we provide the facility to specify the unit of a Dimension as a string, which is used in the axis labels, title and the widgets. However a proper unit integration would provide a huge number of benefits including unit conversion for display, easily combining different quantities and so on.

What shape this integration would take is still very much an open question but there are a number of promising units libraries already out there. Specifically Pint, a pure Python, dependency free, BSD licensed units library, seems like a good starting point as it provides NumPy integration and seems much less complex than other libraries like Unum or quantities.

We should aim to deliver such an integration for the next major release of HoloViews and use this issue to begin brainstorming how it might work.

Image and key_dimensions

https://ioam.github.io/holoviews/Tutorials/Introduction:

Dimensions of your data. The key_dimensions describe how your data can be indexed. The value_dimensions describe what the resulting indexed data represents. A numerical Dimension can have a name, type, range, and unit. This information allows HoloViews to rescale and label axes and allows HoloViews be smart in how it processes your data.

The syntax to get the right ranges in an image is different however:

  • Does not work:
data = np.mgrid[:100,:100][0]+2*np.mgrid[:100,:100][1]
img = hv.Image(data, key_dimensions=[
               hv.Dimension('xa', range=(0,100)),
               hv.Dimension('ya', range=(0,100))
           ])
  • Works:
data = np.mgrid[:100,:100][0]+2*np.mgrid[:100,:100][1]
hv.Image(data, bounds=(0,0,100,100))

The first one is what I would expect from Holoviews, but the implemented one is shorter, and closer the the matplotlib.imshow implementation. I opt that both work, aka, that bounds is a shortcut for defining the ranges via the dimension function.

Deep indexing and __getitem__ issues with Overlays

Right now, the _getitem__ in Overlay is inherited from layout which is causing various issues:

  • Deep slicing doesn't work for Overlays.
  • Layout supports (column, row) selection which doesn't make sense for Overlays.
  • Overlays should be 'transparent' such that slicing an Overlay is the same as slicing the elements of the Overlay then overlaying them (assuming the key dimensions are consistent).

I think we need to write an appropriate __getitem__ for Overlays. Note that as Overlays are heterogeneous containers there will be cases where slicing won't work:

  • If the key dimensions aren't consistent. May need to think carefully about handling ranges...
  • If the element doesn't support __getitem__ itself.

Aspect ratio of Image and Raster

Currently, the Raster and Image function do not respect the aspect ratio of the data.

Raster should have aspect='equal', such that pixels stay square, because almost everything samples with a square grid.

For Image, the optimal default behaviour is less clear. By default, the coordinates are transformed to continues coordinates. This means that equal and square are the same when no bounds are specified.
I propose that the aspect parameter of Image will be set by default to the aspect of the data.

Errorbars

Is it possible to create plots with errorbars, like plt.errorbar does?

Lists as Bounds

Works:

hv.Image(near), bounds=(-40,-30,40,30))

Does not work:

hv.Image(near), bounds=[-40,-30,40,30])

Allow the bound parameter to be any iterable of lenght > 4.

%%opts for combined hv.Image * hv.Curve doesn't work correctly

When I do

images = {(phi, theta):
                 hv.Image(data[phi, theta])
                 for theta in range(len(thetas)) 
                 for phi in range(len(phis))}

curves = {(phi, theta):
                 hv.Curve(curve_data[phi, theta])
                 for theta in range(len(thetas)) 
                 for phi in range(len(phis))}

total = {(phi, theta): images[phi, theta] * curves[phi, theta]
                 for theta in range(len(thetas)) 
                 for phi in range(len(phis))}

and then:

%%opts Image (cmap='gist_heat_r') style(origin='lower') Curve (linewidth=1)
hv.HoloMap(total, key_dimensions=['phi', 'theta'])

(origin='lower') doesn't work.

however when I first evaluate

%%opts Image (origin='lower')
images[0,0]

then the evaluation of hv.HoloMap(total) does work with the options that I set.

hv.Text color

I want to put a Text object with a different color than black. Is this possible?

hv.help(hv.Text, visualization=True)

Does not give clues

Slicing over hv.Contours.

I tried:

H1 = np.random.randn(4, 4)
H2 = np.random.randn(4, 4)
x = np.linspace(0, 1, 100)
eigenvals = np.array([np.linalg.eigvalsh(H1 * alpha + H2 * (1 - alpha)) for alpha in x])
Conts = hv.NdOverlay({i: hv.Contours([zip(x, eigenvals[:, i])]) for i in range(4)})

Where slicing works like:

Conts + Conts.select(x=(0, 0.5), y=(-1,1)) 

download 15

Although this fails:

Conts[:][0:0.5, -1:1]
---------------------------------------------------------------------------
IndexError                                Traceback (most recent call last)
<ipython-input-187-20fd24baf2a1> in <module>()
----> 1 Conts[:][0:0.5, -1:1]

/home/bnijholt/python/env_stable/lib/python2.7/site-packages/holoviews/core/ndmapping.pyc in __getitem__(self, indexslice)
    528                 items = [(k, v) for k, v in items
    529                          if condition(values.index(k[cidx]) if values else k[cidx])]
--> 530             items = [(k, self._dataslice(v, data_slice)) for k, v in items]
    531             if len(items) == 0:
    532                 raise KeyError('No items within specified slice.')

/home/bnijholt/python/env_stable/lib/python2.7/site-packages/holoviews/core/ndmapping.pyc in _dataslice(self, data, indices)
    208         """
    209         if isinstance(data, Dimensioned) and indices:
--> 210             return data[indices]
    211         elif len(indices) > 0:
    212             self.warning('Cannot index into data element, extra data'

/home/bnijholt/python/env_stable/lib/python2.7/site-packages/holoviews/element/path.pyc in __getitem__(self, key)
     49         if not all(isinstance(k, slice) for k in key):
     50             raise IndexError("%s only support slice indexing" %
---> 51                              self.__class__.__name__)
     52         xkey, ykey = key
     53         xstart, xstop = xkey.start, xkey.stop

IndexError: Contours only support slice indexing

Annotation labels in Overlays

When you overlay annotations, you typically lose the title as the labels of the different layers don't match so no label is set.

Although this behavior is fine for many element types, it doesn't make sense for Annotation elements where you are annotating some data that lies underneath the annotation layers. In this case, the group and labels of the annotation(s) should be ignored so that you can see the title of the data that has been annotated.

BoundingBox's `script_repr` has old signature

For something with a script_repr attribute, param's script_repr expects to be able to call something.script_repr() with certain kw args:

elif hasattr(val,'script_repr'):
    rep=val.script_repr(imports=imports, prefix=prefix+" ",qualify=True, unknown_value=unknown_value)

BoundingBox doesn't support all of those kw args:

https://github.com/ioam/holoviews/blob/master/holoviews/core/boundingregion.py#L106

def script_repr(self, imports=[], prefix="    "):
topo_t000000.00_c1>>> from param.parameterized import script_repr
topo_t000000.00_c2>>> from holoviews.core.boundingregion import BoundingBox
topo_t000000.00_c3>>> script_repr(BoundingBox(),[])
---------------------------------------------------------------------------
TypeError                                 Traceback (most recent call last)
/home/ceball/code/ioam/topographica/topographica in <module>()
----> 1 script_repr(BoundingBox(),[])

/home/ceball/code/ioam/topographica/external/param/param/parameterized.pyc in script_repr(val, imports, prefix, settings, unknown_value, qualify)
    817 
    818         rep=val.script_repr(imports=imports, prefix=prefix+"    ",
--> 819                             qualify=True, unknown_value=unknown_value)
    820 
    821     else:

TypeError: script_repr() got an unexpected keyword argument 'qualify'

Unfortunately I didn't at least say in the param release notes that anything with a script_repr method would need some changes, because I didn't actually notice the interface had changed (although now I look at the PR's diff it is very obvious). (I suppose we could modify param's script_repr to support the old signature of script_repr methods too, but it doesn't seem worth it.)

P. S. While debugging, I was so happy to find that boundingregion and sheetcoords are in holoviews rather than topographica - and hence no longer my problem, so I can throw away my piece of paper with 100 to-do items about Slice on it - that I almost wanted to commit the changes myself ;)

Address the 'long tail of visualization' in the documentation

HoloViews makes common operation and visualizations very easy. That said, HoloViews needs to be flexible enough to scale to finely tweaked or highly customized visualizations.

Here are our current recommendations:

  • First make sure we haven't already exposed the style or plot options you are looking for.
  • If there is some style keyword that needs to be passed to the backend (i.e. matplotlib for now) the allowed keywords can easily be extended as detailed in the FAQ. If you believe it ought to be available for all users, please submit a pull request explaining briefly why it is useful and showing which style_opts should list it, and we'll make it available by default
  • The finalize hooks need to be documented as these hooks are the easiest way for a user to change the behavior of our plotting system with minimal code.
  • Writing a new Plot class and if necessary a new Element type, typically extending from some existing class. Obviously the most work but extremely worthwhile, as your new plot will then compose nicely with the rest of HoloViews (automatic support for layouts, overlays, animation, the options system and more!).
  • Finally you can consider exporting to SVG and tweaking the figure externally e.g. in Inkscape. This is only recommended for very minor changes just before publication as such tweaks are not reproducible!

We should definitely consider authoring a new notebook tutorial on this topic.

Bug in options set with __call__ method

Here is a very simple adaptation of the Histogram example from the Elements tutorial:

import numpy as np
from holoviews import Histogram
np.random.seed(1)
data = [np.random.normal() for i in range(10000)]
frequencies, edges = np.histogram(data, 20)
Histogram(frequencies, edges)(plot={'show_grid':True})

Although only a plot option is set (to show the grid), the color of the Histogram changes to the horrible default blue (instead of our cyan color). Must be a bug in the options system...

Finer granularity for the normalization options

Right now we have the four normalization options +axiswise, -axiswise, +framewise, -framewise. Although these four modes are already quite flexible as they apply by {type}.{group}.{label} there are always more possible ways to normalize things!

The most flexible (but verbose!) approach would be to have the four normalization options specified for each dimension by dimension name. Although flexible, this would require a lot more work in the '%%opts' magic parser and would be quite brittle (e.g if you rename your dimensions!).

Having discussed this with Philipp we think there is a useful middle-ground - use the existing split between key dimensions and value dimensions. This would get rid of the situated parameter for instance, replacing that with the more general notion of normalizing by key dimension.

Here is how it would work in the magic:

+axiswise, -axiswise, +framewise, -framewise # Current semantics (i.e all dimensions)
+axiswise[K], -axiswise[K], +framewise[K], -framewise[K] # Apply to key dimensions only
+axiswise[V], -axiswise[V], +framewise[V], -framewise[V] # Applyi to value dimensions only

Note that there are equivalences e.g -axiswise[K] is equivalent to +axiswise[V] as specifying key 'on' is the same as specifying value 'off'.

This is compatible with the current approach and here is what it would map to as a normalization option as accessed by the plotting code:

axiswise=True|False|'key'|'value'

Looking at this, this might be a good opportunity to have the magic syntax match the option more closely. I.e the + and - prefix are just shortcuts for the boolean options only. I.e the magic would support:

+axiswise, -axiswise, +framewise, -framewise
axiswise='key', axiswise='value', framewise='key', framewise='value'

And if you don't want to use the short syntax:

axiswise=True, axiswise=False, framewise=True, framewise=False

Any thoughts? This shouldn't be too much effort to implement, is compatible with what we already have and would certainly be useful in some cases (as well as getting rid of the situate parameter).

Edit:

Instead of using the dimension names, one day we could support doing it by dimension index instead, e.g:

axiswise=[0,2]

Not very clear what that means but certainly less brittle than using the dimension name!

Overlaying Curve and Scatter, order matters

I try to overlay a cross-section with some points. However, it matters in which order I create the overlay:

Works

fs = Raster(np.array([[1]]))
hv.Overlay([hv.Scatter([[1,1]]),fs.sample(y=0),fs.sample(y=0)])

Does not work

fs = Raster(np.array([[1]]))
hv.Overlay([fs.sample(y=0),hv.Scatter([[1,1]]),fs.sample(y=0)])
Traceback (most recent call last):
  File "/home/xx/src/holoviews/holoviews/ipython/display_hooks.py", line 197, in wrapped
    **kwargs)
  File "/home/xx/src/holoviews/holoviews/ipython/display_hooks.py", line 227, in element_display
    **opts(element, get_plot_size(element, size)))()
  File "/home/xx/src/holoviews/holoviews/plotting/element.py", line 514, in __init__
    self.subplots = self._create_subplots(ranges)
  File "/home/xx/src/holoviews/holoviews/plotting/element.py", line 528, in _create_subplots
    cyclic_index,  _ = next(style_iter[style_key])
StopIteration
:Overlay
   .Curve.I   :Curve   [x]   (z)
   .Scatter.I :Scatter   [x]   (y)
   .Curve.II  :Curve   [x]   (z)

I use master, with the last commit a696bd2

Consider tab completion of plot option values in %opts

There is still more available information to exploit for tab completion!

We can't tab-complete values for style keywords in the %opts magic as those are backend dependent but we do assume that any plotting classes (regardless of the exact backend) will be using param.

At the minimum, tab-completion options for param.ObjectSelector declarations would be quite nice. As for other parameters, you could tab-complete the current value of the parameter (i.e. typically the default unless set by the user).

Better example documentation of using Pandas Dataframes?

The current example shows using Seaborn and Pandas and describes wrapping the Pandas dataframe with the holoviews Dframe. Unfortunately I find it confusing..

I'd appreciate a simple pd.dataframe to Dframe description with plotting example? Where it is clear how to reference the Pandas data as input to plotting methods. I'm currently exploring a horrendous DataFrame but can split it down into manageable pieces.... Maybe it is clear and it is just me,, But I suspect that there will be a lot of us trying to apply pandas data since we already have it ready to go...

Issue for general feedback

I think it may be worth having an Issue kept open where anyone can submit any general comments or feedback without forcing people to open more specific issues. It might also be worth linking to this issue from the homepage...

Labels and group on Overlay

kwargs = {'key_dimensions':[B_dim], 
          'value_dimensions':[E_dim], 
          'extents':bounds}

hv.Overlay.from_values([hv.Curve(zip(x, y[i]), **kwargs) for i in range(10)])

produces:
download 5

kwargs = {'key_dimensions':[B_dim], 
          'value_dimensions':[E_dim], 
          'extents':bounds,
          'label':'Test label'
          'group':'Test group'}

hv.Overlay.from_values([hv.Curve(zip(x, y[i]), **kwargs) for i in range(10)])

produces:
download 4

.sample incorrect key_dimension values

d={x: (z1 * hv.VLine(x) + z1.sample(B=x) )
     for x in np.linspace(0.2, 0.8, 10)}
hv.Overlay.collate(d, key_dimensions=['B']).cols(2)

gives me:
screen shot 2015-05-12 at 17 13 23

In the left graph the ticks on the x-axis are incorrect. These are the values that I gave in with: hv.Dimension('Chemical potential', unit='meV', range=(0, 35)).

Changing cmap for Image with label

Changeing the cmap of an image of a label does not work well:
No error, cmap changed, but label lost:

Image(data)(style={'cmap':'gray'}, label='A')

Error:

Image(data, label='A')(style={'cmap':'gray'})
---------------------------------------------------------------------------
Exception                                 Traceback (most recent call last)
<ipython-input-99-094bbee28a14> in <module>()
      8     else:
      9         return far + near + pump
---> 10 show_images((7,8,10,9))

<ipython-input-99-094bbee28a14> in show_images(index)
      4     pump = Image(read_near(files[index[2]]), label='M'+files[index[2]])
      5     if len(index) > 3:
----> 6         dmk = Image(read_dmk(files[index[3]]), label='M'+files[index[3]])(style={'cmap':'gray'})
      7         return far + near + pump + dmk
      8     else:

/usr/local/lib/python2.7/dist-packages/holoviews/core/element.pyc in __call__(self, **kwargs)
    135         for k,d in kwargs.items():
    136             options[identifier][k] = d
--> 137         return super(Element, self).__call__(options)
    138 
    139 

/usr/local/lib/python2.7/dist-packages/holoviews/core/dimension.pyc in __call__(self, options, **kwargs)
    615         """
    616         deep_clone = self.map(lambda x: x.clone(id=x.id))
--> 617         StoreOptions.set_options(deep_clone, options, **kwargs)
    618         return deep_clone
    619 

/usr/local/lib/python2.7/dist-packages/holoviews/core/options.pyc in set_options(cls, obj, options, **kwargs)
   1068         spec, compositor_applied = StoreOptions.expand_compositor_keys(options)
   1069 
-> 1070         custom_trees = StoreOptions.create_custom_trees(obj, spec)
   1071         Store.custom_options.update(custom_trees)
   1072         for tree_id in custom_trees.keys():

/usr/local/lib/python2.7/dist-packages/holoviews/core/options.pyc in create_custom_trees(cls, obj, options)
    961 
    962         return {k:cls.apply_customizations(options, t) if options else t
--> 963                 for k,t in clones.items()}
    964 
    965 

/usr/local/lib/python2.7/dist-packages/holoviews/core/options.pyc in <dictcomp>((k, t))
    961 
    962         return {k:cls.apply_customizations(options, t) if options else t
--> 963                 for k,t in clones.items()}
    964 
    965 

/usr/local/lib/python2.7/dist-packages/holoviews/core/options.pyc in apply_customizations(cls, spec, options)
    899                 customization = {k:(Options(**v) if isinstance(v, dict) else v)
    900                                  for k,v in spec[key].items()}
--> 901             options[str(key)] = customization
    902         return options
    903 

/usr/local/lib/python2.7/dist-packages/holoviews/core/tree.pyc in __setitem__(self, identifier, val)
    147             self.__setattr__(identifier, val)
    148         elif isinstance(identifier, str) and self.parent is None:
--> 149             self.set_path(tuple(identifier.split('.')), val)
    150         elif isinstance(identifier, tuple) and self.parent is None:
    151             self.set_path(identifier, val)

/usr/local/lib/python2.7/dist-packages/holoviews/core/tree.pyc in set_path(self, path, val)
    100 
    101         if not all(p[0].isupper() for p in path):
--> 102             raise Exception("All paths elements must be capitalized.")
    103 
    104         if len(path) > 1:

Exception: All paths elements must be capitalized.

TkAgg backend issue

This conversation has been moved from the inline comments on commit 5f28a33

chris-english commented on 5f28a33 12 days ago

Very happy to explore your Dataviews Tutorial. Imagining really, really new to, well everything, python, linux, topographica, but a burning desire to get one's head around topographica and its many worthy parts some things can go wrong for the uninitiated (like myself, and soon my students...).

My first issues were with modules not found (dataviews), and fixed through appending sys.path for dataviews and param.
That said, in the section - SheetViews, the default backend selected is backend_tkagg.py, which leads to TclError: couldn't connect to display ":0". The sinusoid data is printed but not visualized. Putting %matplotlib inline, in a cell prior to plotting means all your work can be seen by us nubes.
Thanks for your documenting efforts.
Chris English

Histogram slicing is not implemented

Currently __getitem__ on Histogram is raises a NotImplementedError because the slicing semantics aren't obvious. I think we can do a few useful things though:

  • Slicing within a bin will obviously have to discard that bin entirely.
  • This means that a slice range selects all the bins that are entirely within that range.

What is less obvious is what scalar indexing represents (e.g. hist[0.5]). I can think of two behaviors:

  • Return a histogram with a single bar should the frequency of the bin around that particular point.
  • Return the frequency of the bin containing the indexed value back as a scalar literal.

I think the second behavior is the most logical and consistent. Anyway, if I don't hear any objections in the next day, I'll go ahead and implement these semantics!

Switching to readthedocs Sphinx template

I don't like the default style we use across ioam packages very much and think the readthedocs template would be a much better alternative. I've mocked up what this would look like here. It's pretty trivial to switch over but it requires writing proper toctrees, which has not been consistently across ioam packages. I'd suggest switching over this package now and if Jim finds some time to write toctrees for topographica we can switch all the other packages as well.

histogram disappears in .cols(2) of 2 by 2.

This one is a bit strange, but the histogram disappears

(gaps_bounds2[0,0] + gaps_bounds2[0,0] + gaps_bounds2[0,0].hist() + gaps_bounds2[0,0]).cols(2)

download 1

Just one row works fine:

(gaps_bounds2[0,0].hist() + gaps_bounds2[0,0]).cols(2)

download 2

Missing sublabels

There are some cases where sublabels go missing, such as the missing "B" in:

http://ioam.github.io/holoviews/Tutorials/Containers#Gridspace

and the missing "A" in the first plot of:

http://ioam.github.io/holoviews/Tutorials/Composing_Data.html

Those seem like something to do with GridSpaces of Curve elements.They are also not present in:

http://ioam.github.io/holoviews/Tutorials/Options

but that seems like a different issue, because sublabel_format==None on that page. Maybe that's deliberate, but I don't see why there would be a different default value for output directly to disk than there is in the notebook.

And not sure why they aren't in the "Tipping data" section of:

http://ioam.github.io/holoviews/Tutorials/Pandas_Seaborn.html

Multiple style definitions in the opts magic don't work as expected

To add to the growing list of bugs related to to style system: :-S

%%opts Path {+framewise} Path (color='g' linewidth=1)
from holoviews import Path, HoloMap
hmap = HoloMap()
for i in range(1,8):
    hmap[i] = Path([zip(range(i*5), range(i*5))])
hmap

Obviously not an optimal definition with Path repeated twice but it ought to work. The bug is that currently it acts as if {+framewise} wasn't specified. Probably related to #43

Fix sublabels for massive numbers of figures

For ImaGen, we are demonstrating all of the various pattern types available by dumping them all out:

from imagen import *
from imagen.random import *
from imagen.image import *
np.sum([x()[:] for x in locals().values() if isinstance(x,type)
and issubclass(x,PatternGenerator) and not x.abstract]).cols(5)

But for enough patterns, this fails unless we turn off sublabels:

%opts Layout [sublabel_format=""] Image (cmap='gray') [show_xaxis=None show_yaxis=None show_frame=True]

because the chr() call eventually gets into unicode errors, as it goes away from alphabetic characters. Should use modulo to go A..Z then AA, AB, etc.

Plotting array with multiple curves (request)

It would be nice to plot an 2D array of data as curves.

For example in an eigenvalue problem where I generate multiple y-values at one x-value. This is very easily done with matplotlib:

H1 = np.random.randn(10, 10)
H2 = np.random.randn(10, 10)
x = np.linspace(0, 1, 100)
eigenvals = [np.linalg.eigvalsh(H1 * alpha + H2 * (1 - alpha)) for alpha in x]
plt.plot(x, eigenvals)

download 2

Here eigenvals.shape = (100, 10).

To plot these curves with I need to first transform the data, such that the data is of the shape (N, 2).

With my other scripts the following line does the trick:
hv.Curve([(B, mu) for eig_list in eigenvals.T for B, mu in zip(x, eig_list)])
but for some reason this does something strange...

Another solution that does work is:

from operator import mul
list_curves = [hv.Curve(zip(x,eigenvals[:,i])) for i in range(10)]
reduce(mul, list_curves)

type object 'BlockLexer' has no attribute 'default_rules'

After new install (IPython notebook version 3+) Python 2+ I get the above error (Suspect IPython 3 issue)

from holoviews import *
%load_ext holoviews.ipython

:0: FutureWarning: IPython widgets are experimental and may change in the future.
then
type object 'BlockLexer' has no attribute 'default_rules'

30 @undoc
31 class MathBlockLexer(mistune.BlockLexer):
---> 32 default_rules = ['block_math', 'latex_environment'] + mistune.BlockLexer.default_rules
33
34 def init(self, rules=None, **kwargs):

Image vs Raster, setting style

In the options ipynb is showns how to show the cmap of a single image:

Image(data)(style={'cmap':'Greens'})

This works not for Raster! Then the cmap is not changed:

Raster(data)(style={'cmap':'Greens'})

Minor API tweaks for the next PyPI release

Our core API is now solid (otherwise we wouldn't claim to be version 1.0!) but there are still a few corners of the code where parameter names can be improved and made clearer. We want to fix these names as soon as possible, before too many people (including us!) become reliant on them.

Here is the current list of changes I would personally like to see.

  • Plot.show_xaxis -> Plot.xaxis : Sounds like a boolean when in fact it is a list of options. Also shorter.
  • Plot.show_yaxis -> Plot.yaxis : Same as above.

Please add any other suggestions you may have or entirely new suggestions below! In addition, I have submitted a feature request to param that would help make minor API changes easier: holoviz/param#112

Understanding the semantics of dimensions and normalization

This issue summarizes a fairly long discussion regarding the semantics of normalization. This issue is obviously related to issue #49. As we are all aware, generalizing normalization in an understandable and useful way is rather difficult!

In short, we distilled the concepts relevant to normalization into three stages: element selection, grouping and filtering:

Element selection: The first step is to find all the elements matching the {type}.{group}.{label} specification. At the very minimum an element type will be supplied which means normalization is only ever performed between elements of the same type.

Element grouping: This is the procedure by which a set of elements within the same selection (defined in the first step) are collected into a set which may then be normalized across. We currently have two such options we have called 'axiswise' and 'framewise'.

Note that these two options could be replaced by far more options by container type. E.g 'holomapwise', 'gridwise', 'layoutwise'. My understanding is that 'axiswise' is essentially a way of specifying both 'gridwise' and 'layoutwise' (whereas 'framewise' is essentially 'holomapwise').

You can currently group everything available together (default), group together by frame, group together by axis or do not grouping at all (i.e. each element is normalized without looking at any other element).

Right now, it isn't obvious to me if this relates to the {type}.{group}.{label} selection where the type is a container type.

Dimension Filtering:

This is the granularity we are currently missing. Once we have determined which elements are to be grouped together we need to decide which of the available dimensions on those elements should be normalized together. Right now all the available dimensions are normalized together.

We have suggested two types of filtering 'semantic' and 'visualization'. The former correspond to our existing distinction between key and value dimensions (which does partition all dimensions nicely). The latter corresponds to a distinction between dimensions that only exists once visualized.

Our currently suggested categories are 'spatial' and (for a better suggestion!) 'other' - the former correspond to the dimensions spanned by the (normally!) cartesian axes of the plots whereas the latter corresponds to everything else.

Of course the finest granularity is to specify each dimension to normalize by name but this is verbose and brittle (dimension names are easily changed!).

Initial Summary:

I won't go on - hopefully this is enough to get a useful discussion started! That said, I will share one insight - even though holomaps have key dimensions, you never see them directly which is why these dimensions are never normalized. What may be normalized across is the group of elements contained in a holomap and the thing that is normalized is a dimension that maps to some visualizable quantity on the screen (spatial axis extents, pixel color/luminance etc).

EDIT: I should also mention that we acknowledged that the term 'normalization' is horribly overloaded. One of my tentative suggestions was to call the selection + grouping process 'linking'. As in you specify which elements are to be 'linked' together before normalizing their dimensions as appropriate.

Improvements for next PyPI release

There are a few things we should improve in our next PyPI release:

  • Consider pip install holoviews[core] and holoviews[all].
  • Consider adding requirements.txt at least for holoviews[all]
  • Find a sensible way to include the unit tests.
  • Include a change log file.

Setting figure size doesn't work

I think (hope) I didn't make a mistake, but the next code produces an error:

%%opts Image plot[figure_inches=(7,7)]
data = np.mgrid[:100,:100][0]+2*np.mgrid[:100,:100][1]
hv.Image(data, bounds=(0,0,100,100), 
         key_dimensions=[hv.Dimension('x', range=(-200,200)), 
                         hv.Dimension('y', range=(-200,200))])

Error message:

Traceback (most recent call last):
  File "/home/bnijholt/python/env_stable/lib/python2.7/site-packages/holoviews/ipython/display_hooks.py", line 197, in wrapped
    **kwargs)
  File "/home/bnijholt/python/env_stable/lib/python2.7/site-packages/holoviews/ipython/display_hooks.py", line 227, in element_display
    **opts(element, get_plot_size(element, size)))()
  File "/home/bnijholt/python/env_stable/lib/python2.7/site-packages/holoviews/plotting/__init__.py", line 70, in opts
    return dict(figure_inches=size, **Store.lookup_options(obj, 'plot').options)
TypeError: type object got multiple values for keyword argument 'figure_inches'

Plotting np.nan values broke in master.

The last version at PyPi still works, but I just updated to the version on Github and suddenly plotting my data stopped working.

data_Image = np.random.randn(100,100)
data_Image[0,0] = np.nan
hv.Image(data_Image)

Before update:
screen shot 2015-05-07 at 22 47 50

After (master):
screen shot 2015-05-07 at 22 46 48

Recommend Projects

  • React photo React

    A declarative, efficient, and flexible JavaScript library for building user interfaces.

  • Vue.js photo Vue.js

    ๐Ÿ–– Vue.js is a progressive, incrementally-adoptable JavaScript framework for building UI on the web.

  • Typescript photo Typescript

    TypeScript is a superset of JavaScript that compiles to clean JavaScript output.

  • TensorFlow photo TensorFlow

    An Open Source Machine Learning Framework for Everyone

  • Django photo Django

    The Web framework for perfectionists with deadlines.

  • D3 photo D3

    Bring data to life with SVG, Canvas and HTML. ๐Ÿ“Š๐Ÿ“ˆ๐ŸŽ‰

Recommend Topics

  • javascript

    JavaScript (JS) is a lightweight interpreted programming language with first-class functions.

  • web

    Some thing interesting about web. New door for the world.

  • server

    A server is a program made to process requests and deliver data to clients.

  • Machine learning

    Machine learning is a way of modeling and interpreting data that allows a piece of software to respond intelligently.

  • Game

    Some thing interesting about game, make everyone happy.

Recommend Org

  • Facebook photo Facebook

    We are working to build community through open source technology. NB: members must have two-factor auth.

  • Microsoft photo Microsoft

    Open source projects and samples from Microsoft.

  • Google photo Google

    Google โค๏ธ Open Source for everyone.

  • D3 photo D3

    Data-Driven Documents codes.