GithubHelp home page GithubHelp logo

krishnaswamylab / phate Goto Github PK

View Code? Open in Web Editor NEW
448.0 18.0 70.0 144.99 MB

PHATE (Potential of Heat-diffusion for Affinity-based Transition Embedding) is a tool for visualizing high dimensional data.

Home Page: http://phate.readthedocs.io

License: GNU General Public License v2.0

MATLAB 0.26% Python 99.70% Makefile 0.01% M 0.01% Shell 0.01% R 0.03%
single-cell dimensionality-reduction data-visualization unsupervised-learning manifold-learning

phate's Introduction

PHATE - Visualizing Transitions and Structure for Biological Data Exploration

Latest PyPI version Latest Conda version Latest CRAN version Travis CI Build Read the Docs Nature Biotechnology Publication Twitter

Quick Start

If you would like to get started using PHATE, check out the following tutorials.

Introduction

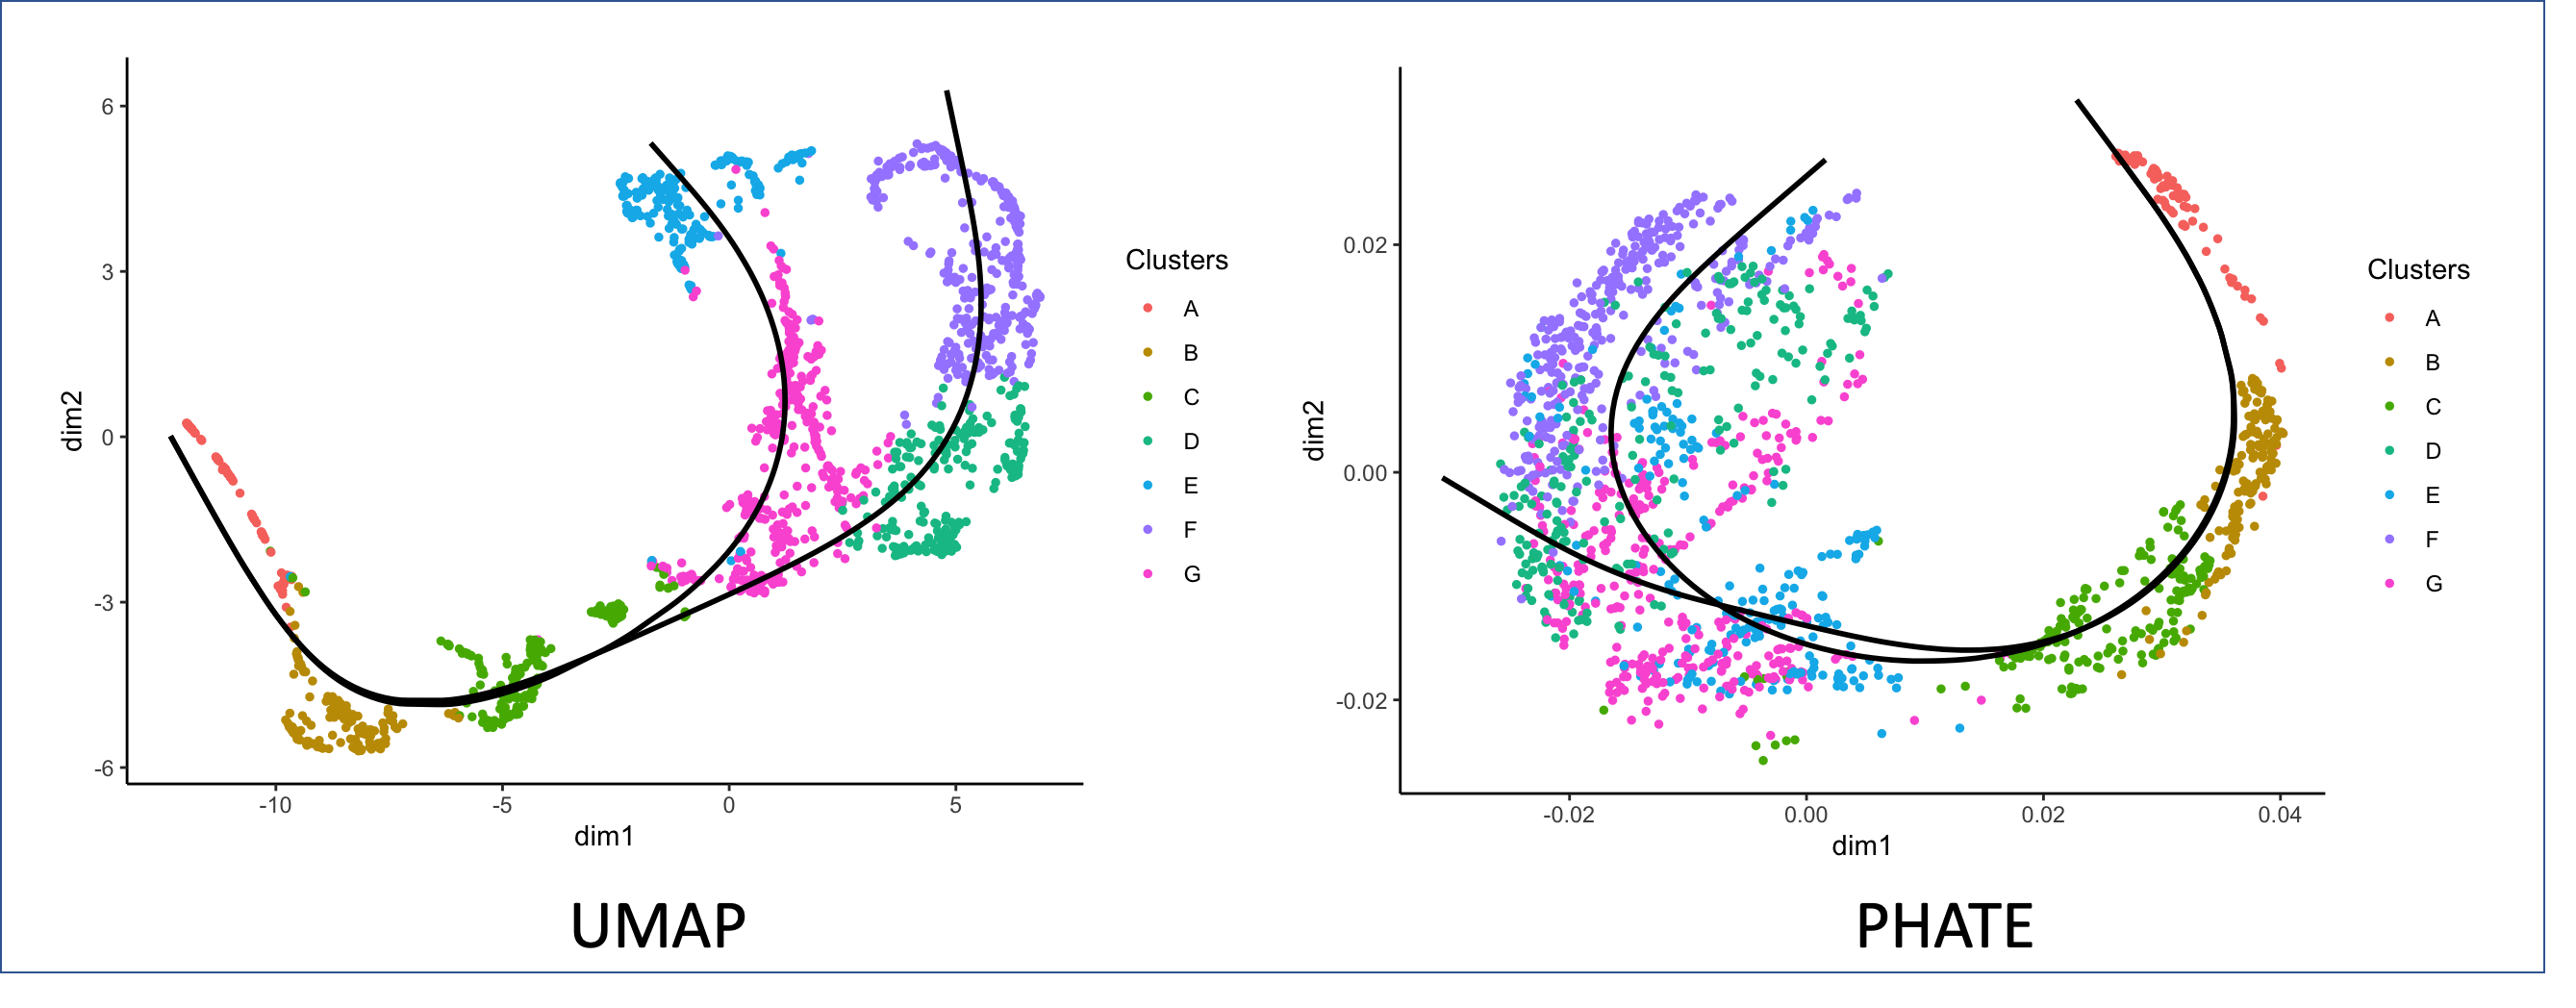
PHATE (Potential of Heat-diffusion for Affinity-based Trajectory Embedding) is a tool for visualizing high dimensional data. PHATE uses a novel conceptual framework for learning and visualizing the manifold to preserve both local and global distances.

To see how PHATE can be applied to datasets such as facial images and single-cell data from human embryonic stem cells, check out our publication in Nature Biotechnology.

Moon, van Dijk, Wang, Gigante et al. Visualizing Transitions and Structure for Biological Data Exploration. 2019. Nature Biotechnology.

PHATE has been implemented in Python >=3.5, MATLAB and R.

Table of Contents

System Requirements

All other software dependencies are installed automatically when installing PHATE.

Python

Installation with pip

The Python version of PHATE can be installed by running the following from a terminal:

pip install --user phate

Installation of PHATE and all dependencies should take no more than five minutes.

Installation from source

The Python version of PHATE can be installed from GitHub by running the following from a terminal:

git clone --recursive git://github.com/KrishnaswamyLab/PHATE.git
cd PHATE/Python
python setup.py install --user

Quick Start

If you have loaded a data matrix data in Python (cells on rows, genes on columns) you can run PHATE as follows:

import phate
phate_op = phate.PHATE()
data_phate = phate_op.fit_transform(data)

PHATE accepts the following data types: numpy.array, scipy.spmatrix, pandas.DataFrame and anndata.AnnData.

Tutorial and Reference

For more information, read the documentation on ReadTheDocs or view our tutorials on GitHub: single-cell RNA-seq, artificial tree. You can also access interactive versions of these tutorials on Google Colaboratory: single-cell RNA-seq, artificial tree.

MATLAB

Installation

The MATLAB version of PHATE can be accessed by running the following from a terminal:

git clone --recursive git://github.com/KrishnaswamyLab/PHATE.git
cd PHATE/Matlab

Then, add the PHATE/Matlab directory to your MATLAB path.

Installation of PHATE should take no more than five minutes.

Tutorial and Reference

Run any of our run_* scripts to get a feel for PHATE. Documentation is available in the MATLAB help viewer.

R

In order to use PHATE in R, you must also install the Python package.

If python or pip are not installed, you will need to install them. We recommend Miniconda3 to install Python and pip together, or otherwise you can install pip from https://pip.pypa.io/en/stable/installing/.

Installation from CRAN and PyPi

First install phate in Python by running the following code from a terminal:

pip install --user phate

Then, install phateR from CRAN by running the following code in R:

install.packages("phateR")

Installation of PHATE and all dependencies should take no more than five minutes.

Installation with devtools and reticulate

The development version of PHATE can be installed directly from R with devtools:

if (!suppressWarnings(require(devtools))) install.packages("devtools")
reticulate::py_install("phate", pip=TRUE)
devtools::install_github("KrishnaswamyLab/phateR")

Installation from source

The latest source version of PHATE can be accessed by running the following in a terminal:

git clone --recursive git://github.com/SmitaKrishnaswamy/PHATE.git
cd PHATE/Python
python setup.py install --user
cd ../phateR
R CMD INSTALL

If the phateR folder is empty, you have may forgotten to use the --recursive option for git clone. You can rectify this by running the following in a terminal:

cd PHATE
git submodule init
git submodule update
cd Python
python setup.py install --user
cd ../phateR
R CMD INSTALL

Quick Start

If you have loaded a data matrix data in R (cells on rows, genes on columns) you can run PHATE as follows:

library(phateR)
data_phate <- phate(data)

phateR accepts R matrices, Matrix sparse matrices, data.frames, and any other data type that can be converted to a matrix with the function as.matrix.

Tutorial and Reference

For more information and a tutorial, read the phateR README. Documentation is available at https://CRAN.R-project.org/package=phateR/phateR.pdf or in the R help viewer with help(phateR::phate). A tutorial notebook running PHATE on a single-cell RNA-seq dataset is available at http://htmlpreview.github.io/?https://github.com/KrishnaswamyLab/phateR/blob/master/inst/examples/bonemarrow_tutorial.html or in phateR/inst/examples.

Help

If you have any questions or require assistance using PHATE, please contact us at https://krishnaswamylab.org/get-help.

phate's People

Contributors

cakiki avatar dburkhardt avatar dvdijk avatar kmoon3 avatar scottgigante avatar smitakrishnaswamy avatar stanleyjs avatar

Stargazers

 avatar  avatar  avatar  avatar  avatar  avatar  avatar  avatar  avatar  avatar  avatar  avatar  avatar  avatar  avatar  avatar  avatar  avatar  avatar  avatar  avatar  avatar  avatar  avatar  avatar  avatar  avatar  avatar  avatar  avatar  avatar  avatar  avatar  avatar  avatar  avatar  avatar  avatar  avatar  avatar  avatar  avatar  avatar  avatar  avatar  avatar  avatar  avatar  avatar  avatar  avatar  avatar  avatar  avatar  avatar  avatar  avatar  avatar  avatar  avatar  avatar  avatar  avatar  avatar  avatar  avatar  avatar  avatar  avatar  avatar  avatar  avatar  avatar  avatar  avatar  avatar  avatar  avatar  avatar  avatar  avatar  avatar  avatar  avatar  avatar  avatar  avatar  avatar  avatar  avatar  avatar  avatar  avatar  avatar  avatar  avatar  avatar  avatar  avatar  avatar

Watchers

 avatar  avatar  avatar  avatar  avatar  avatar  avatar  avatar  avatar  avatar  avatar  avatar  avatar  avatar  avatar  avatar  avatar  avatar

phate's Issues

A doubt in the Proposition 1 from PHATE paper

Hello,

This question may seem odd but I had a doubt in s statement made in Proposition 1 of PHATE paper:
Furthermore, it can be verified that the left and right eigenvectors of Pε are related by ψi(y) = φi(y)ψ0(y),
How can we relate them? I am trying to figure it out but I am not successful yet.

Any help is great!

confront problems in using phateR

Hi, phateR team.

I installed the phateR packge in HPC following 'Installation from CRAN and PyPi' steps as:

pip install --user phate
install.packages("phateR")

There was no error in installation. But when I ran the Tutorial in https://github.com/KrishnaswamyLab/phateR#installation-from-cran-and-pypi, some errors happened.

> tree.phate <- phate(tree.data$data)
Calculating PHATE...
  Running PHATE on 3000 observations and 100 variables.
  Calculating graph and diffusion operator...
    Calculating KNN search...
    Calculated KNN search in 0.92 seconds.
    Calculating affinities...
    Calculated affinities in 0.02 seconds.
  Calculated graph and diffusion operator in 0.94 seconds.
  Calculating landmark operator...
    Calculating SVD...
    Calculated SVD in 0.25 seconds.
    Calculating KMeans...
    Calculated KMeans in 12.63 seconds.
  Calculated landmark operator in 13.93 seconds.
  Calculating optimal t...
/home/.local/lib/python3.7/site-packages/phate/vne.py:46: RuntimeWarning: **overflow** encountered in multiply
  eigenvalues_t = eigenvalues_t * eigenvalues
/home/.local/lib/python3.7/site-packages/phate/vne.py:43: RuntimeWarning: **invalid** value encountered in true_divide
  prob = eigenvalues_t / np.sum(eigenvalues_t)
    Automatically selected t = 1
  Calculated optimal t in 0.60 seconds.
  Calculating diffusion potential...
  Calculated diffusion potential in 0.07 seconds.
  Calculating metric MDS...
  Calculated metric MDS in 1.95 seconds.
Calculated PHATE in 17.49 seconds.

> tree.phate <- phate(tree.data$data, gamma=0, t=120, init=tree.phate)
Calculating PHATE...
  Running PHATE on 3000 observations and 100 variables.
  Calculating graph and diffusion operator...
    Calculating KNN search...
    Calculated KNN search in 0.93 seconds.
    Calculating affinities...
    Calculated affinities in 0.03 seconds.
  Calculated graph and diffusion operator in 0.96 seconds.
  Calculating landmark operator...
    Calculating SVD...
    Calculated SVD in 0.29 seconds.
    Calculating KMeans...
    Calculated KMeans in 26.90 seconds.
  Calculated landmark operator in 28.29 seconds.
  Calculating diffusion potential...
  Calculated diffusion potential in 0.22 seconds.
  Calculating metric MDS...
  Calculated metric MDS in 2.49 seconds.
Calculated PHATE in 31.97 seconds.

> sessionInfo()
R version 3.6.1 (2019-07-05)
Platform: x86_64-pc-linux-gnu (64-bit)
Running under: Red Hat Enterprise Linux Server 7.6 (Maipo)

Matrix products: default
BLAS/LAPACK: /gpfs/ycga/apps/hpc/software/OpenBLAS/0.3.1-GCC-7.3.0-2.30/lib/libopenblas_haswellp-r0.3.1.so

locale:
 [1] LC_CTYPE=en_US.UTF-8       LC_NUMERIC=C
 [3] LC_TIME=en_US.UTF-8        LC_COLLATE=en_US.UTF-8
 [5] LC_MONETARY=en_US.UTF-8    LC_MESSAGES=en_US.UTF-8
 [7] LC_PAPER=en_US.UTF-8       LC_NAME=C
 [9] LC_ADDRESS=C               LC_TELEPHONE=C
[11] LC_MEASUREMENT=en_US.UTF-8 LC_IDENTIFICATION=C

attached base packages:
[1] stats     graphics  grDevices utils     datasets  methods   base

other attached packages:
[1] phateR_1.0.0  Matrix_1.2-18

loaded via a namespace (and not attached):
 [1] Rcpp_1.0.4       lattice_0.20-41  assertthat_0.2.1 dplyr_0.8.5
 [5] crayon_1.3.4     rappdirs_0.3.1   grid_3.6.1       R6_2.4.1
 [9] jsonlite_1.6.1   lifecycle_0.2.0  gtable_0.3.0     magrittr_1.5
[13] scales_1.1.0     ggplot2_3.3.0    pillar_1.4.3     rlang_0.4.5
[17] reticulate_1.15  tools_3.6.1      glue_1.4.0       purrr_0.3.3
[21] munsell_0.5.0    compiler_3.6.1   pkgconfig_2.0.3  colorspace_1.4-1
[25] tidyselect_1.0.0 tibble_2.1.3

So the results were so different from yours.

I do not know how to figure this error out. May you give me a hand?

Best,

How could I optimize lineage separation ?

Hi, I'm currently undertaking an analysis of approx. 1500 embryonic cells at different stage and I was planning to use PHATE to identify lineages.
However, I struggle to find how could I optimize the PHATE parameters so that the lineages are very distinct. In the UMAP plot, the segregation is biologically meaningful according to the phenotype of my cells but not with PHATE. The clusters were identified with FindNeighbors() function from Seurat and I used PHATE with default parameters.

With UMAP I can clearly identify two lineages, but in the PHATE dimensions, this isn't clear to me.
image

Would you have any advice on how would I improve PHATE reduction ? I would be happy to provide additional information. Thanks

PHATE for single cell HiC data?

Hello,
Compared to population based HiC data, single cell HiC data are very sparse and hence good imputation methods are needed to fill in the contact matrix.
In line with that, can I use PHATE directly on a very sparse single cell contact matrix? Or will I need to use MAGIC for imputation and then use PHATE on the imputed contact matrix?
Any suggestions will be great!

Also in the age of single cell HiC, it would be awesome if there were some examples of the same in PHATE and/or MAGIC tutorials.

Thanks.

an error for gene filter

run

batch = scprep.filter.filter_library_size(T1, percentile=20, keep_cells='above')
batch = scprep.filter.filter_library_size(batch, percentile=75, keep_cells='below')

will report an error

TypeError                                 Traceback (most recent call last)
<ipython-input-5-641430854b58> in <module>
      2 for batch in [T1, T2, T3, T4, T5]:
      3     batch = scprep.filter.filter_library_size(batch, percentile=20, keep_cells='above')
----> 4     batch = scprep.filter.filter_library_size(batch, percentile=75, keep_cells='below')
      5     filtered_batches.append(batch)
      6 del T1, T2, T3, T4, T5 # removes objects from memory

D:\Anaconda3\lib\site-packages\scprep\filter.py in filter_library_size(data, cutoff, percentile, keep_cells, return_library_size, sample_labels, filter_per_sample, *extra_data)
    249         Filtered extra data, if passed.
    250     """
--> 251     cell_sums = measure.library_size(data)
    252     return filter_values(
    253         data,

D:\Anaconda3\lib\site-packages\scprep\measure.py in library_size(data)
     22         Sum over all genes for each cell
     23     """
---> 24     library_size = utils.matrix_sum(data, axis=1)
     25     if isinstance(library_size, pd.Series):
     26         library_size.name = "library_size"

D:\Anaconda3\lib\site-packages\scprep\utils.py in matrix_sum(data, axis)
    396                 index = data.index if axis == 1 else data.columns
    397                 sums = pd.Series(
--> 398                     np.array(data.sparse.to_coo().sum(axis)).flatten(), index=index
    399                 )
    400         elif axis is None:

D:\Anaconda3\lib\site-packages\scipy\sparse\base.py in sum(self, axis, dtype, out)
   1016             # sum over rows
   1017             ret = self * np.asmatrix(
-> 1018                 np.ones((n, 1), dtype=res_dtype))
   1019 
   1020         if out is not None and out.shape != ret.shape:

D:\Anaconda3\lib\site-packages\scipy\sparse\base.py in __mul__(self, other)
    500                 raise ValueError('dimension mismatch')
    501 
--> 502             result = self._mul_vector(np.ravel(other))
    503 
    504             if isinstance(other, np.matrix):

D:\Anaconda3\lib\site-packages\scipy\sparse\coo.py in _mul_vector(self, other)
    576         #output array
    577         result = np.zeros(self.shape[0], dtype=upcast_char(self.dtype.char,
--> 578                                                             other.dtype.char))
    579         coo_matvec(self.nnz, self.row, self.col, self.data, other, result)
    580         return result

D:\Anaconda3\lib\site-packages\scipy\sparse\sputils.py in upcast_char(*args)
     58     if t is not None:
     59         return t
---> 60     t = upcast(*map(np.dtype, args))
     61     _upcast_memo[args] = t
     62     return t

D:\Anaconda3\lib\site-packages\scipy\sparse\sputils.py in upcast(*args)
     50             return t
     51 
---> 52     raise TypeError('no supported conversion for types: %r' % (args,))
     53 
     54 

TypeError: no supported conversion for types: (dtype('O'), dtype('O'))

It's a kinda pymagic?

I'm trying to follow your detailed tutorial here but I can't get hate to work after running PCA. The error I am getting is:

> bmmsc_PHATE <- phate(bmmsc)
Error in strsplit(pymagic$`__version__`, "\\.") : 
  object 'pymagic' not found

I tried to figure out what is wrong and I am 99% sure it's something to different versions of python on my Mac but I have no idea how to point phate at the right version.
Python 3.7 is installed and Reticulate know's where it is:

> reticulate::py_config()
python:         /usr/local/bin/python3
libpython:      /usr/local/opt/python/Frameworks/Python.framework/Versions/3.7/lib/python3.7/config-3.7m-darwin/libpython3.7.dylib
pythonhome:     /usr/local/opt/python/Frameworks/Python.framework/Versions/3.7:/usr/local/opt/python/Frameworks/Python.framework/Versions/3.7
version:        3.7.6 (default, Dec 30 2019, 19:38:28)  [Clang 11.0.0 (clang-1100.0.33.16)]
numpy:          /Users/lucasblack/Library/Python/3.7/lib/python/site-packages/numpy
numpy_version:  1.18.1
magic:          /Users/lucasblack/Library/Python/3.7/lib/python/site-packages/magic

python versions found: 
 /Users/lucasblack/.virtualenvs/r-reticulate/bin/python
 /usr/bin/python
 /usr/local/bin/python3
 /Users/lucasblack/.virtualenvs/r-tensorflow/bin/python

BUT when I look for phate it points to version 2.7:

> reticulate::py_discover_config("phateR")
python:         /Users/lucasblack/.virtualenvs/r-reticulate/bin/python
libpython:      /System/Library/Frameworks/Python.framework/Versions/2.7/lib/python2.7/config/libpython2.7.dylib
pythonhome:     /System/Library/Frameworks/Python.framework/Versions/2.7:/System/Library/Frameworks/Python.framework/Versions/2.7
virtualenv:     /Users/lucasblack/.virtualenvs/r-reticulate/bin/activate_this.py
version:        2.7.16 (default, Oct 16 2019, 00:34:56)  [GCC 4.2.1 Compatible Apple LLVM 10.0.1 (clang-1001.0.37.14)]
numpy:          /System/Library/Frameworks/Python.framework/Versions/2.7/Extras/lib/python/numpy
numpy_version:  1.8.0
phateR:         [NOT FOUND]

python versions found: 
 /Users/lucasblack/.virtualenvs/r-reticulate/bin/python
 /usr/bin/python
 /usr/local/bin/python3
 /Users/lucasblack/.virtualenvs/r-tensorflow/bin/python

Any suggestions for a fix or workaround?

Coloring cells by pseudo-time

Hello! I recently started getting in to using PHATE. I am wondering if one can color the cells on PHATE scatter plot by pseudo-time instead of a gene or known time-points across the data. Similarly, how to split the PHATE data into various states across pseudo-time? Thanks!

Output is different when n_samples < 100 in MATLAB and R

HML 9:57 AM
Hello- I first want to say how impressed I am with the PHATE method! I was really excited when I came across the method a few months ago and am currently using PHATE on a microbiome metagenomics dataset. Up until yesterday I was using PHATE in R, but decided to move to Matlab since I will be working with a larger dataset that is too big for R. My initial dataset was 384 samples by 18534 open reading frames and I would subsample this down to look at certain timepoints- this matrix would be 55 samples by 18534 ORFs. I was able to run this and get PHATE images out in R, however when I tried to re-run this same analysis in Matlab yesterday, I kept getting the following error messages: Error using randPCA (line 186)
Input 2 must be <= the smallest dimension of Input 1.
Error in svdpca (line 17)
[U,S,~] = randPCA(X', k);
Error in phate (line 182)
pc = svdpca(data, npca, 'random');
9:59
When I increased the number of samples in the matrix to 110 instead of 55 I was able to get a result out and avoid the error (however I would like to recapitulate the results I have in R with the 55 samples). I tried to go into the code and figure out what was different about the Matlab version vs the R version but was having some difficulty doing so. Is there a way I can get around this in Matlab by potentially changing some of the parameters? Can you also please explain the meaning of this error message? Thank you for your time!
10:01
*I wanted to verify that I get the same results from Matlab as I did in R to make sure I understood how Matlab PHATE was working before running it on my new dataset. The new dataset will be in the range of 384 samples by 110,000 ORFs (rather than 384 samples by 18,000 ORFs)

Scott Gigante 10:02 AM
Hi @HML, this is a bug in the MATLAB code -- we shouldn't be running PCA if n_pca >= n_samples. I've fixed this on dev or alternatively you can just set npca=[] . (edited)
10:02
Thanks for reporting!

HML 10:03 AM
Great- thank you! Just to confirm, would the code line include phate(input_matrix, npca=[])?

Scott Gigante 10:03 AM
I believe so, yes (though I'm not fluent in MATLAB so let me know if that gives you an error!)
10:04
note that this would only be for the case when you have less than 100 data points

HML 10:14 AM
Got it- ok, so it does run now. I created a new function (copied and pasted the original script for phate.m and just manually edited the npca= []), but the image is definitely somewhat different than it was in the R version
10:16
When I ran the matrix with 110 samples in R and Matlab I got the exact same image out
10:18
I have highlighted the points that are the same points- Matlab on the left, R on the right
image

10:19
*The image is for the dataset with the 55 samples

Branch point identification

Hello,
I admire your new method "PHATE" on learning the manifold structure of high dimension data, and I have tried it on our own single-cell RNA-seq dataset. I wonder would you release the code of branch point identification algorithm mentioned in your preprint.
Thanks!

Add `n_clusters = 'auto'` e.g. using silhouette score

Hi,

I am trying to figure out how to decide number of clusters to be produced. I have a data-set where I have used Seurat, and Seurat was able to detect 17 clusters. Is there a way for me to use PHATE in a similar way.

Sameet

Ability to supply custom distance matrix? (not just method)

(working in python version) PHATE currently allows the user to set a distance metric using the knn_dist and mds_dist parameters. Is there a way to supply a pre-computed distance matrix instead, or would this be difficult to implement?

My reasoning is that I work with microbiome data, and I often use the Unifrac distance metrics, which include correction for phylogenetic distance. There's no easy way to integrate these into the current PHATE pipeline, so being able to supply a pre-computed matrix instead of just a method would be beneficial.

Thank you.

Error instantiaiating PHATE

Describe the bug
I tried to instantiate and use PHATE object with:
data_phate = phate.PHATE().fit_transform(bmmsc_data)

To Reproduce
(https://colab.research.google.com/github/KrishnaswamyLab/MAGIC/blob/master/python/tutorial_notebooks/bonemarrow_tutorial.ipynb#scrollTo=398dus7w7tc9)

Expected behavior
Calculating PHATE...
Running PHATE on 2416 cells and 10782 genes.
Calculating graph and diffusion operator...
Calculating PCA...
Calculated PCA in 5.65 seconds.
Calculating KNN search...
Calculated KNN search in 0.81 seconds.
Calculating affinities...
Calculated affinities in 0.03 seconds.
Calculated graph and diffusion operator in 6.66 seconds.
Calculating landmark operator...
Calculating SVD...
Calculated SVD in 0.30 seconds.
Calculating KMeans...
Calculated KMeans in 24.72 seconds.
Calculated landmark operator in 26.40 seconds.
Calculating optimal t...
Calculated optimal t in 6.88 seconds.
Calculating diffusion potential...
Calculated diffusion potential in 2.86 seconds.
Calculating metric MDS...
Calculated metric MDS in 37.48 seconds.
Calculated PHATE in 80.29 seconds.

Actual behavior
Calculating PHATE...
Running PHATE on 2416 observations and 10782 variables.
Calculating graph and diffusion operator...
Calculating PCA...
Calculated PCA in 2.50 seconds.
Calculating KNN search...
Calculated KNN search in 0.50 seconds.
Calculating affinities...
Calculated affinities in 0.11 seconds.
Calculated graph and diffusion operator in 3.17 seconds.
Calculating landmark operator...
Calculating SVD...
Calculated SVD in 0.12 seconds.
Calculating KMeans...
Calculated KMeans in 0.81 seconds.
Calculated landmark operator in 0.93 seconds.
Calculated PHATE in 4.10 seconds.

AttributeError Traceback (most recent call last)
~/miniforge3/lib/python3.9/site-packages/graphtools/graphs.py in landmark_op(self)
590 try:
--> 591 return self._landmark_op
592 except AttributeError:

AttributeError: 'kNNLandmarkGraph' object has no attribute '_landmark_op'

During handling of the above exception, another exception occurred:

AttributeError Traceback (most recent call last)
/var/folders/wp/mg6w1m053n32d4ln0wv61n6w0000gn/T/ipykernel_40966/2632628218.py in
1 phate_op = phate.PHATE()
----> 2 data_phate = phate_op.fit_transform(bmmsc_data)

~/.local/lib/python3.9/site-packages/phate/phate.py in fit_transform(self, X, **kwargs)
959 """
960 with _logger.task("PHATE"):
--> 961 self.fit(X)
962 embedding = self.transform(**kwargs)
963 return embedding

~/.local/lib/python3.9/site-packages/phate/phate.py in fit(self, X)
855
856 # landmark op doesn't build unless forced
--> 857 self.diff_op
858 return self
859

~/.local/lib/python3.9/site-packages/phate/phate.py in diff_op(self)
279 if self.graph is not None:
280 if isinstance(self.graph, graphtools.graphs.LandmarkGraph):
--> 281 diff_op = self.graph.landmark_op
282 else:
283 diff_op = self.graph.diff_op

~/miniforge3/lib/python3.9/site-packages/graphtools/graphs.py in landmark_op(self)
591 return self._landmark_op
592 except AttributeError:
--> 593 self.build_landmark_op()
594 return self._landmark_op
595

~/miniforge3/lib/python3.9/site-packages/graphtools/graphs.py in build_landmark_op(self)
670 random_state=self.random_state,
671 )
--> 672 self._clusters = kmeans.fit_predict(self.diff_op.dot(VT.T))
673
674 # transition matrices

~/miniforge3/lib/python3.9/site-packages/sklearn/cluster/kmeans.py in fit_predict(self, X, y, sample_weight)
1253 Index of the cluster each sample belongs to.
1254 """
-> 1255 return self.fit(X, sample_weight=sample_weight).labels

1256
1257 def fit_transform(self, X, y=None, sample_weight=None):

~/miniforge3/lib/python3.9/site-packages/sklearn/cluster/_kmeans.py in fit(self, X, y, sample_weight)
1940
1941 # Compute inertia on a validation set.
-> 1942 _, inertia = _labels_inertia_threadpool_limit(
1943 X_valid,
1944 sample_weight_valid,

~/miniforge3/lib/python3.9/site-packages/sklearn/cluster/_kmeans.py in _labels_inertia_threadpool_limit(X, sample_weight, x_squared_norms, centers, n_threads)
753 ):
754 """Same as _labels_inertia but in a threadpool_limits context."""
--> 755 with threadpool_limits(limits=1, user_api="blas"):
756 labels, inertia = _labels_inertia(
757 X, sample_weight, x_squared_norms, centers, n_threads

~/miniforge3/lib/python3.9/site-packages/sklearn/utils/fixes.py in threadpool_limits(limits, user_api)
312 return controller.limit(limits=limits, user_api=user_api)
313 else:
--> 314 return threadpoolctl.threadpool_limits(limits=limits, user_api=user_api)
315
316

~/miniforge3/lib/python3.9/site-packages/threadpoolctl.py in init(self, limits, user_api)
169 self._check_params(limits, user_api)
170
--> 171 self._original_info = self._set_threadpool_limits()
172
173 def enter(self):

~/miniforge3/lib/python3.9/site-packages/threadpoolctl.py in _set_threadpool_limits(self)
266 return None
267
--> 268 modules = _ThreadpoolInfo(prefixes=self._prefixes,
269 user_api=self._user_api)
270 for module in modules:

~/miniforge3/lib/python3.9/site-packages/threadpoolctl.py in init(self, user_api, prefixes, modules)
338
339 self.modules = []
--> 340 self._load_modules()
341 self._warn_if_incompatible_openmp()
342 else:

~/miniforge3/lib/python3.9/site-packages/threadpoolctl.py in _load_modules(self)
369 """Loop through loaded libraries and store supported ones"""
370 if sys.platform == "darwin":
--> 371 self._find_modules_with_dyld()
372 elif sys.platform == "win32":
373 self._find_modules_with_enum_process_module_ex()

~/miniforge3/lib/python3.9/site-packages/threadpoolctl.py in _find_modules_with_dyld(self)
426
427 # Store the module if it is supported and selected
--> 428 self._make_module_from_path(filepath)
429
430 def _find_modules_with_enum_process_module_ex(self):

~/miniforge3/lib/python3.9/site-packages/threadpoolctl.py in _make_module_from_path(self, filepath)
513 if prefix in self.prefixes or user_api in self.user_api:
514 module_class = globals()[module_class]
--> 515 module = module_class(filepath, prefix, user_api, internal_api)
516 self.modules.append(module)
517

~/miniforge3/lib/python3.9/site-packages/threadpoolctl.py in init(self, filepath, prefix, user_api, internal_api)
604 self.internal_api = internal_api
605 self._dynlib = ctypes.CDLL(filepath, mode=_RTLD_NOLOAD)
--> 606 self.version = self.get_version()
607 self.num_threads = self.get_num_threads()
608 self._get_extra_info()

~/miniforge3/lib/python3.9/site-packages/threadpoolctl.py in get_version(self)
644 lambda: None)
645 get_config.restype = ctypes.c_char_p
--> 646 config = get_config().split()
647 if config[0] == b"OpenBLAS":
648 return config[1].decode("utf-8")

AttributeError: 'NoneType' object has no attribute 'split'

System information:

Output of phate.__version__: '1.0.7'

Output of pd.show_versions():

INSTALLED VERSIONS

commit : 5f648bf1706dd75a9ca0d29f26eadfbb595fe52b
python : 3.9.7.final.0
python-bits : 64
OS : Darwin
OS-release : 21.2.0
Version : Darwin Kernel Version 21.2.0: Sun Nov 28 20:29:10 PST 2021; root:xnu-8019.61.5~1/RELEASE_ARM64_T8101
machine : arm64
processor : arm
byteorder : little
LC_ALL : None
LANG : en_US.UTF-8
LOCALE : en_US.UTF-8

pandas : 1.3.2
numpy : 1.22.1
pytz : 2021.3
dateutil : 2.8.2
pip : 22.0.3
setuptools : 60.2.0
Cython : None
pytest : None
hypothesis : None
sphinx : 4.4.0
blosc : None
feather : 0.4.1
xlsxwriter : None
lxml.etree : 4.6.5
html5lib : None
pymysql : None
psycopg2 : None
jinja2 : 3.0.2
IPython : 7.29.0
pandas_datareader: None
bs4 : 4.10.0
bottleneck : 1.3.2
fsspec : 2022.01.0
fastparquet : None
gcsfs : None
matplotlib : 3.3.3
numexpr : 2.8.1
odfpy : None
openpyxl : None
pandas_gbq : None
pyarrow : 7.0.0
pyxlsb : None
s3fs : None
scipy : 1.7.1
sqlalchemy : None
tables : 3.6.1
tabulate : None
xarray : None
xlrd : None
xlwt : None
numba : 0.53.0

Additional context
Any help will be greatly appreciated

Documentation for knn_dist

Hi,
Thank you for the great work on usability. One thing that I would improve is to add to the documentation of the knn_dist parameter that the input data X is used as distance if the first element on the diagonal is 0 otherwise as an affinity matrix.

The assumption that the affinity matrix cannot have 0 on the diagonal is not always applicable since in some datasets you might have missing values etc. The problem is that the error message does not necessarily point into the right direction either. You would try to compute the graph and the affinities and would get a Nan or Inf error when you do not have any Nan or Inf in your input X. :)

Cheers,
Cristina

RE: input data for PHATE

Hey guys,

I'm trying to understand how to appropriately use MAGIC and PHATE for my analysis.
When I perform dimensionality reduction with PCA/ UMAP after imputing gene counts, the data representation I get are vastly different. I was thus wondering if it'd be appropriate to run PHATE on the imputed counts data, rather than normalized raw counts. I tried searching the web for answers but haven't been able to find a good explanation.

Thank you

readthedocs not working

Hi,
I am trying to use the phate.readthedocs.io, and the API part has links that I cannot follow.

Sameet

couple of suggestions post-tutorial

  1. Alternative to log or sqrt for "potential_method" - a nice compromise could be the inverse hyperbolic sine function. Continuous from neg. inf. to pos. inf. and exhibits logarithmic properties asymptotically - therefore log-scales values without need for imputation.

    • Others in the bioinformatics field have begun using this transformation, e.g: Michael Hoffman at U. Toronto.
  2. Mysterious cell in the "remove rare cells" cell - probably is just a mistake?

    • genes_keep=sum(data)>10; data=data(:,genes_keep); genes=genes(genes_keep)
  3. Alternative method for getting users introduced to method - have the tutorial be housed in a Google CoLab setting, i.e: https://colab.research.google.com/. This would remove any barrier to installation as a user goes through a first pass. Of course, afterwards, they would still need to install it and all that that entails. Distill.pub uses CoLab notebooks to allow interested readers to do exactly this - https://distill.pub/2018/building-blocks/.

color phate plot by local intrinsic dimension

In the PHATE paper and in Smita's talks, she mentions coloring a phate plot by local intrinsic dimension so as to show branch points. This would be very useful. Is it implemented? It would be great to just make 'lid' an attribute of the phate object, so that after fit_transform() one can plot the data with LID coloring with a command like:

phate.plot.scatter3d(phate_data, c=ph.lid)

I'm actually using PHATE in a chemical application, for data that also shows trajectory structure, and as I think about it, it seems like quite a few fields could benefit from a dimensionality reduction algorithm that does not assume that the data is cleanly separable into discrete clusters. I hope that PHATE will continue to be developed. Best wishes!

Fix tutorial load data

New code is

import os
import zipfile
from urllib import request
download_path = os.path.expanduser("~")
print(download_path)

opener= request.build_opener()
opener.addheaders=[('User-Agent','Mozilla/5.0')]
request.install_opener(opener)

if not os.path.isdir(os.path.join(download_path, "scRNAseq", "T0_1A")):
    if not os.path.isdir(download_path):
        os.mkdir(download_path)
    zip_data = os.path.join(download_path, "scRNAseq.zip")
    if not os.path.isfile(zip_data):
        with request.urlopen("https://data.mendeley.com/datasets/v6n743h5ng"
                     "/1/files/7489a88f-9ef6-4dff-a8f8-1381d046afe3/scRNAseq.zip?dl=1") as url:
            print("Downloading data file...")
            # Open our local file for writing
            with open(zip_data, "wb") as handle:
                handle.write(url.read())
    print("Unzipping...")
    with zipfile.ZipFile(zip_data, 'r') as handle:
        handle.extractall(download_path)
    print("Done.")

Using PHATE with multi-batch single-cell data

Hi there

I was wondering if there had been any developments on how to integrate batch information and correction into PHATE analysis? Specifically, PHATE tutorials import data from multiple batches yet don't quite address data merging/correction of batch effects.

We are working with a single cell data generated in multiple batches which we merge using the fastmnn approach. This produces "batch-corrected" expression values and low-dimensional coordinates for visualisation. Is there a way these tools may be able to be used together?

Thanks for the great work.

conda install phate fails

Describe the bug
Can't install phate from bioconda.

To Reproduce
mamba install -c bioconda phate... mamba and conda are (mostly) interchangeable so this error should occur in conda as well.

Expected behavior
An installed version of phate
Actual behavior

Encountered problems while solving:
  - nothing provides graphtools >=1.3.1 needed by phate-0.4.5-py_0

I assume that graphtools is a pip requirement of phate. It may be a version that got bumped and didn't get updated on pypi, or the pip requirement is specified as a conda requirement in the bioconda repo.

Just figured you guys should know. I can workaround it by building my own graphtools.

run_PHATE_EB fails in Matlab2015a at line 73 in compute_alpha_kernel_sparse

There is a bug on line 73 in computer_alpha_kernel_sparse.m

When I execute "run_phate_EB" it fails because the 2 operands of "./" are different sizes.

I think this could probably be corrected using "repmat", assuming that is what was intended.

I wonder if this line of code depends on a very recent feature in Matlab that does the "repmat" implicitly. Since many research lab run do not run the most up-to-date version of Matlab, it would be better to use repmat explicitly.

Here are more details:

>> run_phate_EB
PCA using random SVD
Elapsed time is 6.751585 seconds.
Doing PCA
PCA using random SVD
PCA took 8.1852 seconds
using alpha decaying kernel
Computing alpha decay kernel:
Number of samples = 16825
First iteration: k = 100
Error using  ./ 
Matrix dimensions must agree.

Error in compute_alpha_kernel_sparse (line 73)
    K=exp(-(kdist(idx_thresh,:)./epsilon(idx_thresh)).^a);

Error in phate (line 196)
        K = compute_alpha_kernel_sparse(pc, 'k', k, 'a', a, 'distfun', distfun);

Error in run_phate_EB (line 35)
Y_PHATE_2D = phate(data, 't', 20);

When I print out the "size" of the 2 operands, ... here is what I get:

>> size( exp( kdist(idx_thresh,:)) )
ans =

        9228         100
>> size( epsilon(idx_thresh) )
ans =

        9228           1

Stuck after Installatation of phateR.

Dear Dr. Smita,

After I installing the phateR by Guided turorial in R and also installing the magic-impute in python=3.6. I encountered the conflict in running R as below, does anyone could give me some guidance how to solve it? Thank you so much.

library(dplyr)
library(ggplot2)
library(Matrix)
library(readr)
library(viridis)
library(Rmagic)
library(phateR)
library(Seurat)
...
> dataPhate=phate(t(data),n.landmark = NULL,n.jobs=-2)
Calculating PHATE...
  Running PHATE on 377 cells and 10806 genes.
  Calculating graph and diffusion operator...
    Calculating PCA...
    Calculated PCA in 0.73 seconds.
    Calculating KNN search...
    Calculated KNN search in 0.16 seconds.
    Calculating affinities...
Error in py_call_impl(callable, dots$args, dots$keywords) : 
  TypeError: __init__() got an unexpected keyword argument 'mds_solver'

Detailed traceback: 
  File "/home/mq2019/.local/lib/python3.7/site-packages/phate/phate.py", line 835, in fit_transform
    self.fit(X)
  File "/home/mq2019/.local/lib/python3.7/site-packages/phate/phate.py", line 740, in fit
    **(self.kwargs))
  File "/home/mq2019/.local/lib/python3.7/site-packages/graphtools/api.py", line 248, in Graph
    return Graph(**params)
  File "/home/mq2019/.local/lib/python3.7/site-packages/graphtools/graphs.py", line 102, in __init__
    super().__init__(data, n_pca=n_pca, **kwargs)
  File "/home/mq2019/.local/lib/python3.7/site-packages/graphtools/base.py", line 750, in __init__
    super().__init__(data, **kwargs)
  File "/home/mq2019/.local/lib/python3.7/site-packages/graphtools/base.py", line 135, in __init__
    super().__init__(**kwargs)
  File "/home/mq2019/.local/lib/python3.7/site-packages/graphtools/base.py", line 373, in __init__
    super().__init__(**kwargs)
In addition: Warning message:
In on_load() :
  Python PHATE version 0.4.4 is out of date (recommended: 1.0). Please update with pip (e.g. pip install --upgrade phate) or phateR::install.phate().

And after I got this messenge, I tried to do "pip install --upgrade phate" and got updated phate as result as below:

(PhateAndMagic) [mq2019@comet-ln2 phateRAnalysis-FC22samples_Oli]$ pip show phate meld magic-impute
Name: phate
Version: 1.0.0
Summary: PHATE
Home-page: https://github.com/KrishnaswamyLab/PHATE
Author: Daniel Burkhardt, Krishnaswamy Lab, Yale University
Author-email: [email protected]
License: GNU General Public License Version 2
Location: /home/mq2019/miniconda2/envs/PhateAndMagic/lib/python3.6/site-packages
Requires: scikit-learn, scprep, Deprecated, tasklogger, sgdpy, numpy, graphtools, matplotlib, scipy, future
Required-by: 
---
Name: meld
Version: 0.2.4
Summary: MELD
Home-page: https://github.com/KrishnaswamyLab/MELD
Author: Daniel Burkhardt, Krishnaswamy Lab, Yale University
Author-email: [email protected]
License: Dual License - See LICENSE file
Location: /home/mq2019/miniconda2/envs/PhateAndMagic/lib/python3.6/site-packages
Requires: numpy, scprep, pygsp, scipy, graphtools, pandas
Required-by: 
---
Name: magic-impute
Version: 2.0.3
Summary: MAGIC
Home-page: https://github.com/KrishnaswamyLab/MAGIC
Author: 
Author-email: 
License: GNU General Public License Version 2
Location: /home/mq2019/.local/lib/python3.6/site-packages
Requires: numpy, matplotlib, scprep, scikit-learn, graphtools, scipy, tasklogger, future, pandas
Required-by: 

And I also run phateR::install.phate() in R, but got stuck as result as below:

  Using cached https://files.pythonhosted.org/packages/e7/f9/f0b53f88060247251bf481fa6ea62cd0d25bf1b11a87888e53ce5b7c8ad2/pytz-2019.3-py2.py3-none-any.whl
ERROR: meld 0.2.3 has requirement pandas<0.24, but you'll have pandas 0.25.3 which is incompatible.
ERROR: magic-impute 1.5.5 has requirement pandas<0.24,>=0.21.0, but you'll have pandas 0.25.3 which is incompatible.
Installing collected packages: numpy, scipy, six, python-dateutil, pyparsing, setuptools, kiwisolver, cycler, matplotlib, pytz, pandas, decorator, joblib, scikit-learn, scprep, sgdpy, future, tasklogger, pygsp, graphtools, wrapt, Deprecated, phate
Successfully installed Deprecated-1.2.7 cycler-0.10.0 decorator-4.4.1 future-0.18.2 graphtools-1.4.1 joblib-0.14.0 kiwisolver-1.1.0 matplotlib-3.0.3 numpy-1.17.4 pandas-0.25.3 phate-1.0.0 pygsp-0.5.1 pyparsing-2.4.5 python-dateutil-2.8.1 pytz-2019.3 scikit-learn-0.22 scipy-1.3.3 scprep-1.0.3 setuptools-42.0.2 sgdpy-1.4.1 six-1.13.0 tasklogger-1.0.0 wrapt-1.11.2
Install complete. Please restart R and try again.

If possible, could you help to give me some tips how to overcome this error? Thank you so much.
Best,
Qi

Reproducing Supplementary Figure 13 in paper and general re-weighting procedure

Hi, first off, great algorithm! I've used PHATE in my own work with very encouraging results and appreciate its clarity in studying continuous biological processes versus the more conventional tools (e.g., tSNE, UMAP). I'm curious as to how to reproduce the supplementary figure 13 from your paper where you re-weight distances to highlight different biological processes (i.e., differentiation, cell cycle, mitosis) in the same data. Specifically, (1) how does this re-weighting process work (both in theory and implementation in PHATE), (2) how do you choose which genes to up-weight for each process, and (3) does this introduce any biases in downstream analyses (e.g., differential expression, RNA velocity)? I couldn't find any code to reproduce them or how to do this re-weighting in general in PHATE, nor a detailed description of the math behind it in neither the main paper nor supplement.

Thanks!!

EBdatamat

Hi, I just have a quick question about the EBdata.mat file in the Data folder. Is this processed the same was as the in the PHATE Jupyter NB? It seems like the genes/cells have been filtered, but not yet normalized or transformed ?
Thanks so much

Purpose of Procrustes Analysis

Hi there,

I am using PHATE on data sets with much success, and I am looking to understand the purpose of the procrustes analysis between the classical MDS embedding and the metric MDS embedding in the embed_mds function. This is not necessarily an issue, but I couldn't find any documentation in the paper "Visualizing structure and transitions in high-dimensional biological data" on the matter.

Thank you!
Josh

Totally different result between phateR and RunPHATE

Hi, I recently tried to run the EB differentiation PHATE tutorial. The tutorial is run in python, but I am more used to R, so I tried to run using RunPHATE() function implemented in seurat ( https://github.com/scottgigante/seurat/tree/patch/add-PHATE-again ). But the resulting plot looks nothing like expected:
2.EB_differentiation_UMAP_tSNE_PHATE_compare.pdf

However, when I tried to run the same tutorial manually (not using seurat), the result is comparable to expected outcome:
3.EB_diff_manually_PHATE.pdf

I think this is caused by scaling in seurat, but I don't how to fix this issue. Any suggestions?

Here is my code using RunPHATE() in seurat (which did not produce correct result):

library(phateR)

library(reticulate)
use_condaenv(condaenv = "for_phate", conda = "/home/qiuhui/.conda/envs/py36/bin/conda",required = T)
reticulate::py_discover_config("phate")
reticulate::import("phate")

library("Seurat", lib.loc="~/R/test_packages_2/")
RunPHATE()
?RunPHATE

library(cowplot)

# perform cell filtering  based on quantile
input_and_filter_cells_by_lib_quantile <- function(file_path,project){
  T1 <- Read10X(file_path,unique.features = T)
  # seurat recommend filter genes while constructing seurat object
  T1.seurat <- CreateSeuratObject(counts = T1, project = project, min.cells = 10)
  ## filter top and bottom 20% of cells
  quantiles <- quantile(T1.seurat@meta.data$nCount_RNA,probs = c(0.2,0.8))
  T1.seurat <- subset(T1.seurat, subset = nCount_RNA > quantiles[1] & nCount_RNA < quantiles[2])
  return(T1.seurat)
}

T1.seurat <- input_and_filter_cells_by_lib_quantile("./EB_differentiation_data/T0_1A/", "T1")
T2.seurat <- input_and_filter_cells_by_lib_quantile("./EB_differentiation_data/T2_3B/", "T2")
T3.seurat <- input_and_filter_cells_by_lib_quantile("./EB_differentiation_data/T4_5C/", "T3")
T4.seurat <- input_and_filter_cells_by_lib_quantile("./EB_differentiation_data/T6_7D/", "T4")
T5.seurat <- input_and_filter_cells_by_lib_quantile("./EB_differentiation_data/T8_9E/", "T5")

all.seurat <- merge(T1.seurat,y = c(T2.seurat,T3.seurat,T4.seurat,T5.seurat),
                    add.cell.ids = c("T1","T2","T3","T4","T5"),project = "EB_diff")
table(all.seurat@meta.data$orig.ident)*100/ncol(all.seurat)

rm(T1.seurat,T2.seurat,T3.seurat,T4.seurat,T5.seurat)
#saveRDS(object = all.seurat, file = "EB_diff.all.seurat.rds")

## filter by MT genes
all.seurat[["percent.mt"]] <- PercentageFeatureSet(all.seurat, pattern = "^MT-")
summary(all.seurat[["percent.mt"]])   # 3rd quantile: 2.425
quantile(all.seurat@meta.data$percent.mt,probs = c(0.9))  # 90% quantile: 3.026
plot(density(all.seurat@meta.data$percent.mt))
VlnPlot(all.seurat,features = c("percent.mt"))

all.seurat <- subset(all.seurat, subset = percent.mt < 3)  # 16740 cells after filtering, 17162 genes

##### start seurat 3 analysis
all.seurat <- NormalizeData(all.seurat, verbose = FALSE)
all.seurat <- FindVariableFeatures(all.seurat, selection.method = "vst", nfeatures = 2000)

# Run the standard workflow for visualization and clustering
all.seurat <- ScaleData(all.seurat, verbose = FALSE)
all.seurat <- RunPCA(all.seurat, npcs = 30, verbose = FALSE)
# UMAP, tSNE and Clustering
all.seurat <- RunUMAP(all.seurat, reduction = "pca", dims = 1:20)
all.seurat <- RunTSNE(all.seurat, reduction = "pca", dims = 1:20)
all.seurat <- FindNeighbors(all.seurat, reduction = "pca", dims = 1:20)  # build SNN graph for cell clustering, not data integration
all.seurat <- FindClusters(all.seurat, resolution = 0.5)

# Visualization
plot_grid(DimPlot(all.seurat, reduction = "umap", label = TRUE),
          DimPlot(all.seurat, reduction = "umap", group.by = "orig.ident", cols = c("#9E0142","#F98E52","#FFFFBE","#86CFA5","#5E4FA2")),
          ncol = 2)
plot_grid(DimPlot(all.seurat, reduction = "tsne", label = TRUE),
          DimPlot(all.seurat, reduction = "tsne", group.by = "orig.ident", cols = c("#9E0142","#F98E52","#FFFFBE","#86CFA5","#5E4FA2")),
          ncol = 2)
# compare UMAP and tSNE
plot_grid(DimPlot(all.seurat, reduction = "umap", group.by = "orig.ident", cols = c("#9E0142","#F98E52","#FFFFBE","#86CFA5","#5E4FA2")),
          DimPlot(all.seurat, reduction = "tsne", group.by = "orig.ident", cols = c("#9E0142","#F98E52","#FFFFBE","#86CFA5","#5E4FA2")),
          ncol = 2)

################################# run PHATE ########################################

all.seurat <- RunPHATE(all.seurat, reduction = "pca", dims = 1:20,
                       knn = 4, decay = 15, t=12)
all.seurat <- RunPHATE(all.seurat)
all.seurat <- RunPHATE(all.seurat, knn = 4, decay = 15, t=12)
plot_grid(DimPlot(all.seurat, reduction = "umap",  group.by = "orig.ident", cols = c("#9E0142","#F98E52","#FFFFBE","#86CFA5","#5E4FA2")),
          DimPlot(all.seurat, reduction = "tsne",  group.by = "orig.ident", cols = c("#9E0142","#F98E52","#FFFFBE","#86CFA5","#5E4FA2")),
          DimPlot(all.seurat, reduction = "phate", group.by = "orig.ident", cols = c("#9E0142","#F98E52","#FFFFBE","#86CFA5","#5E4FA2")),
          ncol = 3)

## the result looks nothing like expected.................

And here is my code to run PHATE manually:

library(phateR)
library(Rmagic)

## phateR need the python package
library(reticulate)
use_condaenv(condaenv = "for_phate", conda = "/home/qiuhui/.conda/envs/py36/bin/conda", required = T)
reticulate::py_discover_config("phate")
reticulate::import("phate")
reticulate::import("magic")

library(ggplot2)
library(readr)
library(viridis)
library(cowplot)

##### still, need seurat to read 10X results ... #####
library("Seurat", lib.loc="~/R/test_packages_2/")

## input 10X results, then filter cells by library size quantile
input_and_filter_lib_quantile <- function(file_path){
  T1 <- Read10X(file_path,unique.features = T)
  lib.size <- colSums(T1)
  quantiles <- quantile(lib.size, probs = c(0.2,0.8))
  lib.size.filtered <- which( lib.size > quantiles[1] & lib.size < quantiles[2] )
  return(T1[,names(lib.size.filtered)])
}

T1 <- input_and_filter_lib_quantile("./EB_differentiation_data/T0_1A/")
T2 <- input_and_filter_lib_quantile("./EB_differentiation_data/T2_3B/")
T3 <- input_and_filter_lib_quantile("./EB_differentiation_data/T4_5C/")
T4 <- input_and_filter_lib_quantile("./EB_differentiation_data/T6_7D/")
T5 <- input_and_filter_lib_quantile("./EB_differentiation_data/T8_9E/")

all(rownames(T1) == rownames(T5))  ## all gene names are the same
sum(duplicated(rownames(T1)))      ## no duplicated gene name


## transpose, rows are cells !!!!
all.matrix <- t(cbind(T1,T2,T3,T4,T5))
dim(all.matrix)  # 18691 cells, 33694 genes

## filter dead cells (high MT gene expression)
mito.genes <- grep(pattern = "^MT", x = colnames(all.matrix), value = T)
cells.percent.mito <- rowSums(all.matrix[,mito.genes])/rowSums(all.matrix)
all.matrix <- all.matrix[which(cells.percent.mito < quantile(cells.percent.mito,0.9)),]
dim(all.matrix)  # 16821 cells, 33694 genes

cell_date <- c(rep("T1",ncol(T1)), rep("T2",ncol(T2)), rep("T3",ncol(T3)), rep("T4",ncol(T4)), rep("T5",ncol(T5)))
names(cell_date) <- c(colnames(T1), colnames(T2), colnames(T3), colnames(T4), colnames(T5))
cell_date <- cell_date[rownames(all.matrix)]

## filter genes
all.matrix <- all.matrix[,colSums( all.matrix > 0 ) >10]
dim(all.matrix)  # 16821 cells, 17409 genes

## sqrt normalize
all.data <- library.size.normalize(all.matrix)
all.data <- sqrt(all.data)


## run PHATE
all.PHATE <- phate(all.data)

ggplot(all.PHATE) + geom_point(aes(PHATE1, PHATE2, color=cell_date),size = 0.1) +
  scale_color_manual(values = c("#9E0142","#F98E52","#FFFFBE","#86CFA5","#5E4FA2"))

################# looks good !!!!!! #################

# rerun PHATE with new parameters
all.PHATE <- phate(all.data, knn=4, decay=15, t=12, init=all.PHATE)

ggplot(all.PHATE) + geom_point(aes(PHATE1, PHATE2, color=cell_date),size = 0.1) +
  scale_color_manual(values = c("#9E0142","#F98E52","#FFFFBE","#86CFA5","#5E4FA2")) + labs(color="diff_day")

phateR: TypeError: __init__() got an unexpected keyword argument 'n_landmark'

Error in py_call_impl(callable, dots$args, dots$keywords) :
TypeError: init() got an unexpected keyword argument 'n_landmark'

Command traceback shows typo? (n_landmark = n.landmark)
pyphate$PHATE(n_components = ndim, k = k, a = alpha, t = t, n_landmark = n.landmark, gamma = gamma, n_pca = npca, mds = mds.method, mds_dist = mds.dist.method, knn_dist = knn.dist.method, n_jobs = n.jobs, random_state = seed, verbose = verbose)

s_gd2 typeerror

TypeError                                 Traceback (most recent call last)
<ipython-input-1-9418f70a3d50> in <module>
      1 import phate
----> 2 Y = phate.PHATE(knn_dist='precomputed').fit_transform(A)

/mnt/eider_environments/EiderPython/local/apollo/env/EiderPython/python3.7/lib/python3.7/site-packages/phate/phate.py in fit_transform(self, X, **kwargs)
    939         with _logger.task("PHATE"):
    940             self.fit(X)
--> 941             embedding = self.transform(**kwargs)
    942         return embedding
    943 

/mnt/eider_environments/EiderPython/local/apollo/env/EiderPython/python3.7/lib/python3.7/site-packages/phate/phate.py in transform(self, X, t_max, plot_optimal_t, ax)
    908                         n_jobs=self.n_jobs,
    909                         seed=self.random_state,
--> 910                         verbose=max(self.verbose - 1, 0),
    911                     )
    912             if isinstance(self.graph, graphtools.graphs.LandmarkGraph):

/mnt/eider_environments/EiderPython/local/apollo/env/EiderPython/python3.7/lib/python3.7/site-packages/phate/mds.py in embed_MDS(X, ndim, how, distance_metric, solver, n_jobs, seed, verbose)
    228         try:
    229             # use sgd2 if it is available
--> 230             Y = sgd(X_dist, n_components=ndim, random_state=seed, init=Y_classic)
    231             if np.any(~np.isfinite(Y)):
    232                 _logger.warning("Using SMACOF because SGD returned NaN")

</mnt/eider_environments/EiderPython/local/apollo/env/EiderPython/lib/python3.7/site-packages/decorator.py:decorator-gen-157> in sgd(D, n_components, random_state, init)

/mnt/eider_environments/EiderPython/local/apollo/env/EiderPython/python3.7/lib/python3.7/site-packages/scprep/utils.py in _with_pkg(fun, pkg, min_version, *args, **kwargs)
     81         check_version(pkg, min_version=min_version)
     82         __imported_pkgs.add((pkg, min_version))
---> 83     return fun(*args, **kwargs)
     84 
     85 

/mnt/eider_environments/EiderPython/local/apollo/env/EiderPython/python3.7/lib/python3.7/site-packages/phate/mds.py in sgd(D, n_components, random_state, init)
     82     D = squareform(D)
     83     # Metric MDS from s_gd2
---> 84     Y = s_gd2.mds_direct(N, D, init=init, random_seed=random_state)
     85     return Y
     86 

/mnt/eider_environments/EiderPython/local/apollo/env/EiderPython/python3.7/lib/python3.7/site-packages/s_gd2/s_gd2.py in mds_direct(n, d, w, etas, num_dimensions, random_seed, init)
     82 
     83     # do mds
---> 84     cpp.mds_direct(X, d, w, etas, random_seed)
     85     return X
     86 

TypeError: Array of type 'double' required.  A 'unknown type' was given

Install "scottgigante/seurat", ref="patch/add-PHATE-again" get error

Dear Dr.Gigante, I get great result from phate.R. However, I can't write the embedding back to Seurat object.
Q1: devtools::install_github("scottgigante/seurat", ref="patch/add-PHATE-again"), error as below:
Error in parse(con, keep.source = FALSE, srcfile = NULL) :
284:1: unexpected input
283: export(RunPCA)
284: <<
^
Calls: ... withCallingHandlers -> loadNamespace -> parseNamespaceFile -> parse
Execution halted
ERROR: lazy loading failed for package ‘Seurat’
─ removing ‘/tmp/RtmpjZATAL/Rinst217acf75462a82/Seurat’
-----------------------------------
ERROR: package installation failed
Error: Failed to install 'Seurat' from GitHub:
System command 'R' failed, exit status: 1, stdout + stderr (last 10 lines):
E> 284:1: unexpected input
E> 283: export(RunPCA)
E> 284: <<
E> ^
E> Calls: ... withCallingHandlers -> loadNamespace -> parseNamespaceFile -> parse
E> Execution halted
E> ERROR: lazy loading failed for package ‘Seurat’
E> * removing ‘/tmp/RtmpjZATAL/Rinst217acf75462a82/Seurat’
E> -----------------------------------
E> ERROR: package installation failed
Q2:If I give up to install this version of Seurat, how to write the Phate result into Seurat object? Or write a .csv file from py.phate result? I notice the there is more than one embedding in phate result.
Thank you for your time. Best!

Add to PyPI

It would be nice to make PHATE installable via a package manager like pip.

SVD computation error message

Describe the bug
With my input data, I get a SVD error computation about "array must not contain infs or NaNs" when I do fit_transform to reduce dimensionality of input data. Note that problem occurs whether I use mds= "classic" or "nonmetric".

I attached a copy of the input data

Thanks for your help,

Ivan

To Reproduce
Please refer to attached zip file, in there you will find Python script and input data

Expected behavior
Be able to reduce dimensionality of input data

Actual behavior
projected_data= embedding.fit_transform(X= input_data)
File "C:\Temp\Python\Python3.6.5\lib\site-packages\phate\phate.py", line 961, in fit_transform
self.fit(X)
File "C:\Temp\Python\Python3.6.5\lib\site-packages\phate\phate.py", line 857, in fit
self.diff_op
File "C:\Temp\Python\Python3.6.5\lib\site-packages\phate\phate.py", line 281, in diff_op
diff_op = self.graph.landmark_op
File "C:\Temp\Python\Python3.6.5\lib\site-packages\graphtools\graphs.py", line 593, in landmark_op
self.build_landmark_op()
File "C:\Temp\Python\Python3.6.5\lib\site-packages\graphtools\graphs.py", line 663, in build_landmark_op
random_state=self.random_state,
File "C:\Temp\Python\Python3.6.5\lib\site-packages\sklearn\utils\extmath.py", line 340, in randomized_svd
Uhat, s, V = linalg.svd(B, full_matrices=False)
File "C:\Temp\Python\Python3.6.5\lib\site-packages\scipy\linalg\decomp_svd.py", line 106, in svd
a1 = _asarray_validated(a, check_finite=check_finite)
File "C:\Temp\Python\Python3.6.5\lib\site-packages\scipy_lib_util.py", line 272, in _asarray_validated
a = toarray(a)
File "C:\Temp\Python\Python3.6.5\lib\site-packages\numpy\lib\function_base.py", line 486, in asarray_chkfinite
"array must not contain infs or NaNs")
ValueError: array must not contain infs or NaNs

System information:

Output of phate.__version__:

Please run phate.__version__ and paste the results here.

You can do this with `python -c 'import phate; print(phate.__version__)'`
phate-1.0.7

Output of pd.show_versions():

Please run pd.show_versions() and paste the results here.

You can do this with `python -c 'import pandas as pd; pd.show_versions()'`

INSTALLED VERSIONS

commit : None
python : 3.6.5.final.0
python-bits : 64
OS : Windows
OS-release : 10
machine : AMD64
processor : Intel64 Family 6 Model 63 Stepping 2, GenuineIntel
byteorder : little
LC_ALL : None
LANG : None
LOCALE : None.None

pandas : 0.25.0
numpy : 1.19.5
pytz : 2018.5
dateutil : 2.7.3
pip : 9.0.3
setuptools : 41.0.1
Cython : 0.29.14
pytest : 6.0.1
hypothesis : None
sphinx : 2.3.1
blosc : None
feather : None
xlsxwriter : None
lxml.etree : None
html5lib : 0.9999999
pymysql : None
psycopg2 : None
jinja2 : 2.11.0
IPython : 7.11.1
pandas_datareader: None
bs4 : None
bottleneck : None
fastparquet : None
gcsfs : None
lxml.etree : None
matplotlib : 3.2.2
numexpr : 2.7.3
odfpy : None
openpyxl : None
pandas_gbq : None
pyarrow : None
pytables : None
s3fs : None
scipy : 1.5.4
sqlalchemy : None
tables : 3.6.1
xarray : None
xlrd : 1.2.0
xlwt : None
xlsxwriter : None

Additional context
Python 3.6.5 with Deprecated-1.2.12 graphtools-1.5.2 phate-1.0.7 pygsp-0.5.1 s-gd2-1.8 scprep-1.1.0 tasklogger-1.1.0

issue_phate.zip

Failed python import after pip install on linux

In [1]: import phate
---------------------------------------------------------------------------
ImportError Traceback (most recent call last)
<ipython-input-1-ffc4c2cce566> in <module>
----> 1 import phate
~/.local/lib/python3.6/site-packages/phate/__init__.py in <module>
3 from .phate import PHATE
4 import phate.tree
----> 5 import phate.io
6 import phate.preprocessing
7 import phate.mds
~/.local/lib/python3.6/site-packages/phate/io.py in <module>
4 from __future__ import print_function, division
5 import warnings
----> 6 import scprep
7
8
~/.local/lib/python3.6/site-packages/scprep/__init__.py in <module>
3
4 from .version import __version__
----> 5 import scprep.io
6 import scprep.io.hdf5
7 import scprep.select
~/.local/lib/python3.6/site-packages/scprep/io/__init__.py in <module>
3
4 from .csv import load_csv, load_tsv
1
----> 5 from .tenx import load_10X, load_10X_zip, load_10X_HDF5
6 from .fcs import load_fcs
7 from .mtx import load_mtx
~/.local/lib/python3.6/site-packages/scprep/io/tenx.py in <module>
14
15 from .utils import _matrix_to_data_frame
---> 16 from . import hdf5
17
18
~/.local/lib/python3.6/site-packages/scprep/io/hdf5.py in <module>
5 from .. import utils
6
----> 7 tables = utils._try_import("tables")
8 h5py = utils._try_import("h5py")
9
~/.local/lib/python3.6/site-packages/scprep/utils.py in _try_import(pkg)
20 def _try_import(pkg):
21 try:
---> 22 return importlib.import_module(pkg)
23 except ModuleNotFoundError:
24 return None
~/.conda/envs/phate/lib/python3.6/importlib/__init__.py in import_module(name, package)
124 break
125 level += 1
--> 126 return _bootstrap._gcd_import(name[level:], package, level)
127
128
~/.conda/envs/phate/lib/python3.6/site-packages/tables/__init__.py in <module>
91
92 # Necessary imports to get versions stored on the cython extension
---> 93 from .utilsextension import (
94 get_pytables_version, get_hdf5_version, blosc_compressor_list,
95 blosc_compcode_to_compname_ as blosc_compcode_to_compname,
ImportError: libhdf5.so.101: cannot open shared object file: No such file or directory

interpreting output

Am looking for ideas on how best to describe output of PHATE as applied to some CAR T-cell 10X genomics scRNAseq data I've got ahold of. Biological context is these cells are CAR T-cells after transfection of construct that allows them to target cancer cells. Hope is that a dimensionality reduction technique could reveal something about relationship between sub-populations in this data. e.g: can I draw conclusions based on distances between semi-distinct sub-clusters? how to interpret the apparent bifurcation in plot below?

Had to come up with ad-hoc coloring scheme because there aren't time points of this data. Maybe a different dim. reduction technique would be more appropriate but plots below, by eye, suggest something?

Coloring scheme is based on three genes of interest and employs RGB combinations to reflect expression of these three genes - low (L), medium (M), or high (H) (categories are arbitrary percentiles). Radius of dots reflects relative expression of all three of the genes - the more expression, the bigger the radius. CTLA4 exists on the "B" axis (z-axis here), CD4 exists on the "R" axis, and CD8A exists on the "G" axis.

3d_color
^ key

My interpretation is there is a definite split in identity of cells that are either expressing high CTLA4 and high CD4 or are expressing high CD8A. This coincidentally splits the color-scheme in two. Any opinions? The horseshoe shape and bifurcation point... it's quite mysterious.

3da
^ view 1

3db
^ same plot, different angle

3dc
^ same plot, rotated again

RuntimeWarning: divide by zero

I'm seeing this warning while running PHATE on 5000 cells, with k=2, a=5, t=5:

Bulding kNN graph and diffusion operator...
/home/scottgigante/.local/lib/python3.6/site-packages/phate-0.1-py3.6.egg/phate/phate.py:92: RuntimeWarning: divide by zero encountered in true_divide
  pdx = (pdx / epsilon).T # autotuning d(x,:) using epsilon(x).
/home/scottgigante/.local/lib/python3.6/site-packages/phate-0.1-py3.6.egg/phate/phate.py:92: RuntimeWarning: invalid value encountered in true_divide
  pdx = (pdx / epsilon).T # autotuning d(x,:) using epsilon(x).
Built graph and diffusion operator in 17.69 seconds.
Calculating diffusion potential...
/home/scottgigante/.local/lib/python3.6/site-packages/phate-0.1-py3.6.egg/phate/phate.py:119: RuntimeWarning: invalid value encountered in less_equal
  X[X <= np.finfo(float).eps] = np.finfo(float).eps #handling small values
Calculated diffusion potential in 11.62 seconds.
Embedding data using classic MDS...

Running PHATE version 0.1. It looks like the warning is due to epsilon being zero, which might be related to my choice of k=2 being too small, or having duplicates in my dataset.

Running PHATE with verbose = False still prints MDS stress

Running PHATE with verbose = False still prints MDS stress

breaking at iteration 103 with stress 1322.9503670967915
breaking at iteration 533 with stress 79.50760126313087
breaking at iteration 217 with stress 54.46123952246649
breaking at iteration 148 with stress 143.56729643278047

How to re-order legends in PHATE when using scprep.plot.rotate_scatter3d

Hello,

I am loving the output of PHATE for my dataset so far - great tool (thanks for your work on this).

Currently, I am trying to visually tweak the output of scprep.plot.rotate_scatter3d, in order that it looks a bit more pleasing. I have altered it as follows, and am very nearly happy with the result:

mpl.rcParams['animation.embed_limit'] = 2**256

scprep.plot.rotate_scatter3d(Y_phate_3d, c=labels, figsize=(15,10), label_prefix="PHATE", cmap=new_colors_3d, 
            legend_title="Fetal BM cell types", 
            title="PHATE visualisation of FBM progenitor differentiation", elev=10, azim=10,
            legend_loc=[0.75,0.55], filename='phate_dpi_v11.mp4', rotation_speed=20, fps=60, dpi=400, ticklabels=False)

where:

labels = adata.obs["cell.labels_comb"].astype("object")
and
new_colors_3d = ['#c37d00', '#009500', '#fba100', '#0754ab', '#ffa0ff', '#a900a9', '#aaffaa', '#9ccbfc', '#e80000']

Good so far, but, the order of the legend labels are coming up in an order that is unintuitive to the biology. I'd like to alter this, and began by first attempting to alter the order of the categories given to "labels", from c=labels. However, this made no difference.

Could you please direct me to the best way to alter the order - or what arg would be responsible for the placement of this?

Would be very useful and improve the output a lot!

Thanks

Simone

*PS: if you have any ideas WRT altering amount of white space to the left and right of the .mp4 output that would also be very much appreciated

An issue with using scHi-C with PHATE

@kmoon3 @scottgigante The problem with using binary contact maps with 1 along the diagonals as input to PHATE(using default parameters) is that a compact(kinda globular) structure is obtained. We do not want that! So I think this points to: first impute the missing values(due to very sparse single cell Hi-C data) by using MAGIC before applying PHATE?

I tried to use PHATE on chromosomes for cell 1 and cell 2 from https://www.ncbi.nlm.nih.gov/geo/query/acc.cgi?acc=GSE80280. At the bottom of that page we use GSE80280_RAW.tar custom file.

In that, the RAW results typically lists a number of observed contacts between specific genome positions. From the raw results, the contacts were aggregated into equally spaced bins along the chromosomes. I worked with a bin size of 50 kbp. Then all observed contacts were assigned to their corresponding bins. In the case that multiple contacts fell into the same bin, the duplicate entries were ignored so that a binary contact matrix C_ij was obtained for each chromosome. Hence, C_ij = 1 represents a Hi-C contact between bins i and j, while C_ij = 0 represents the absence of a contact.

An example file for cell-1 chr1 is below:
The first row list the #bins and #contacts
GSM2219497_cell1_chr1_50kb.txt

After removing bins with no interactions, the binary contact matrix for the same chr1 is:
contact_cell1_chr1.txt.tar.gz

Any help would be greatly appreciated!
Thanks,
-Tarak
@tarak77

Randomization in results generation

Hi,

I applied PHATE on the same dataset twice with the exact same codes and get two different results. Is there any part that include randomization and I need to set seed? Thanks!

Winnie

PHATE with non-PCA dimensionality reduction / denoised counts

Hi,

I've been looking to use this tool to visualise the structure in my dataset a bit better. I was wondering whether PHATE supports non-PCA dimensionality reductions, as my reading of the code and my attempts to use the tool seem to be that it starts with a count matrix after filtering/log (or square root) transformations, followed by PCA and then PHATE.

However, because my samples have batch effects, I've looked to use scVI to learn a latent space that has been batch corrected, and I have been using that latent space for kNN graph building/clustering/UMAP visualisation instead of principal components. Can I use that latent space for PHATE visualisation instead of the count matrix? Alternatively, could I use the denoised/normalised count matrix from scVI to input into PHATE for visualisation as per #105?

Many thanks in advance.

Problems with phate.plot.rotate_scatter3d

Hi,

When trying to plot the 3D embedding giving by PHATE, I am running into an indexing problem. For the sake of reproducibility, here is an example using your example dataset:

import phate
tree_data, tree_clusters = phate.tree.gen_dla()
phate_operator = phate.PHATE(k=15, t=100)
tree_phate = phate_operator.fit_transform(tree_data)
phate.plot.rotate_scatter3d(tree_phate, c=tree_clusters) #BTW, I think this line is wrong on your example... the original shows _**phate.plot.rotate_scatter3d(phate_operator, c=tree_clusters)**_

Result:
phate.plot.rotate_scatter3d(tree_phate, c=tree_clusters)
Traceback (most recent call last):
File "", line 1, in
File "/home/Documents/PHATE/Python/phate/plot.py", line 549, in rotate_scatter3d
**kwargs)
File "</home/.conda/envs/antonio_phate/lib/python3.7/site-packages/decorator.py:decorator-gen-18>", line 2, in rotate_scatter3d
File "/home/.conda/envs/antonio_phate/lib/python3.7/site-packages/scprep/utils.py", line 78, in _with_pkg
return fun(*args, **kwargs)
File "/home/.conda/envs/antonio_phate/lib/python3.7/site-packages/scprep/plot/scatter.py", line 1024, in rotate_scatter3d
scatter3d(data, ax=ax, **kwargs)
File "</home/.conda/envs/antonio_phate/lib/python3.7/site-packages/decorator.py:decorator-gen-17>", line 2, in scatter3d
File "/home/.conda/envs/antonio_phate/lib/python3.7/site-packages/scprep/utils.py", line 78, in _with_pkg
return fun(*args, **kwargs)
File "/home/.conda/envs/antonio_phate/lib/python3.7/site-packages/scprep/plot/scatter.py", line 915, in scatter3d
z=select.select_cols(data, idx=2),
File "/home/.conda/envs/antonio_phate/lib/python3.7/site-packages/scprep/select.py", line 363, in select_cols
data = data[:, idx]
IndexError: index 2 is out of bounds for axis 1 with size 2

Any ideas about what is going wrong here?
Please, let me know if you need any further details.

Thanks

Be able to use minkowski metric with p < 1

Describe the bug
It seems that PHATE supports minkowski metric for both mds and knn computations. So, I would like to use this metric with p= 0.3 for running experiments. The code does not recognize the use of 'p= 0.3' when calling phate.PHATE

Thanks for your help,

Ivan

To Reproduce
embedding= phate.PHATE(n_components= intrinsic_dim, knn= 5, decay= None, n_landmark= 2000, t= 'auto',
gamma= 1.0, n_pca= input_data.shape[1], mds_solver= 'smacof',
knn_dist= 'minkowski', mds_dist= 'minkowski', mds= 'classic', random_state= 1969,
n_jobs= cpu_count, verbose= False, p= 0.3)

Expected behavior
The initialization of phate object should take 'p= 0.3' as part of the parameters to initialize phate object

Actual behavior
Traceback (most recent call last):
File "test_phenograph_clustering.py", line 94, in
projected_data= embedding.fit_transform(X= input_data)
File "C:\Temp\Python\Python3.6.5\lib\site-packages\phate\phate.py", line 961, in fit_transform
self.fit(X)
File "C:\Temp\Python\Python3.6.5\lib\site-packages\phate\phate.py", line 853, in fit
**(self.kwargs)
File "C:\Temp\Python\Python3.6.5\lib\site-packages\graphtools\api.py", line 288, in Graph
return Graph(**params)
File "C:\Temp\Python\Python3.6.5\lib\site-packages\graphtools\graphs.py", line 132, in init
super().init(data, n_pca=n_pca, **kwargs)
File "C:\Temp\Python\Python3.6.5\lib\site-packages\graphtools\graphs.py", line 524, in init
super().init(data, **kwargs)
File "C:\Temp\Python\Python3.6.5\lib\site-packages\graphtools\base.py", line 1019, in init
super().init(data, **kwargs)
File "C:\Temp\Python\Python3.6.5\lib\site-packages\graphtools\base.py", line 135, in init
super().init(**kwargs)
File "C:\Temp\Python\Python3.6.5\lib\site-packages\graphtools\base.py", line 505, in init
super().init(**kwargs)
TypeError: init() got an unexpected keyword argument 'p'

System information:

Output of phate.__version__:

Please run phate.__version__ and paste the results here.

You can do this with `python -c 'import phate; print(phate.__version__)'`
phate-1.0.7

Output of pd.show_versions():

Please run pd.show_versions() and paste the results here.

You can do this with `python -c 'import pandas as pd; pd.show_versions()'`
INSTALLED VERSIONS
------------------
commit           : None
python           : 3.6.5.final.0
python-bits      : 64
OS               : Windows
OS-release       : 10
machine          : AMD64
processor        : Intel64 Family 6 Model 63 Stepping 2, GenuineIntel
byteorder        : little
LC_ALL           : None
LANG             : None
LOCALE           : None.None

pandas           : 0.25.0
numpy            : 1.19.5
pytz             : 2018.5
dateutil         : 2.7.3
pip              : 9.0.3
setuptools       : 41.0.1
Cython           : 0.29.14
pytest           : 6.0.1
hypothesis       : None
sphinx           : 2.3.1
blosc            : None
feather          : None
xlsxwriter       : None
lxml.etree       : None
html5lib         : 0.9999999
pymysql          : None
psycopg2         : None
jinja2           : 2.11.0
IPython          : 7.11.1
pandas_datareader: None
bs4              : None
bottleneck       : None
fastparquet      : None
gcsfs            : None
lxml.etree       : None
matplotlib       : 3.2.2
numexpr          : 2.7.3
odfpy            : None
openpyxl         : None
pandas_gbq       : None
pyarrow          : None
pytables         : None
s3fs             : None
scipy            : 1.5.4
sqlalchemy       : None
tables           : 3.6.1
xarray           : None
xlrd             : 1.2.0
xlwt             : None
xlsxwriter       : None

Additional context
Python 3.6.5 with Deprecated-1.2.12 graphtools-1.5.2 phate-1.0.7 pygsp-0.5.1 s-gd2-1.8 scprep-1.1.0 tasklogger-1.1.0

2.7 vs 3.5 difference for testing w/ DLA fractal tree

Heads up: I copied code block on README.md for running the test script on the DLA fractal tree and got the following error...

~/p36/lib/python3.6/site-packages/phate/phate.py in calculate_kernel(data, k, a, alpha_decay,
knn_dist, verbose, ndim, random_state, n_jobs)

ValueError: Unknown format code 'd' for object of type 'float'

Not a big deal and seems easily resolvable. Likely the case that bugs w.r.t. different python versioning could affect user experience.

Was installed via:

pip3.6 install phate

Recommend Projects

  • React photo React

    A declarative, efficient, and flexible JavaScript library for building user interfaces.

  • Vue.js photo Vue.js

    🖖 Vue.js is a progressive, incrementally-adoptable JavaScript framework for building UI on the web.

  • Typescript photo Typescript

    TypeScript is a superset of JavaScript that compiles to clean JavaScript output.

  • TensorFlow photo TensorFlow

    An Open Source Machine Learning Framework for Everyone

  • Django photo Django

    The Web framework for perfectionists with deadlines.

  • D3 photo D3

    Bring data to life with SVG, Canvas and HTML. 📊📈🎉

Recommend Topics

  • javascript

    JavaScript (JS) is a lightweight interpreted programming language with first-class functions.

  • web

    Some thing interesting about web. New door for the world.

  • server

    A server is a program made to process requests and deliver data to clients.

  • Machine learning

    Machine learning is a way of modeling and interpreting data that allows a piece of software to respond intelligently.

  • Game

    Some thing interesting about game, make everyone happy.

Recommend Org

  • Facebook photo Facebook

    We are working to build community through open source technology. NB: members must have two-factor auth.

  • Microsoft photo Microsoft

    Open source projects and samples from Microsoft.

  • Google photo Google

    Google ❤️ Open Source for everyone.

  • D3 photo D3

    Data-Driven Documents codes.