GithubHelp home page GithubHelp logo

lazappi / clustree Goto Github PK

View Code? Open in Web Editor NEW
192.0 6.0 16.0 37.75 MB

Visualise Clusterings at Different Resolutions

Home Page: https://lazappi.github.io/clustree/

License: GNU General Public License v3.0

R 96.37% TeX 3.63%
visualization visualisation clustering clustering-trees cran

clustree's Introduction

clustree

Project Status Lifecycle: stable R-CMD-check Coverage Status CodeFactor CRAN Status CRAN Monthly Downloads CRAN Downloads

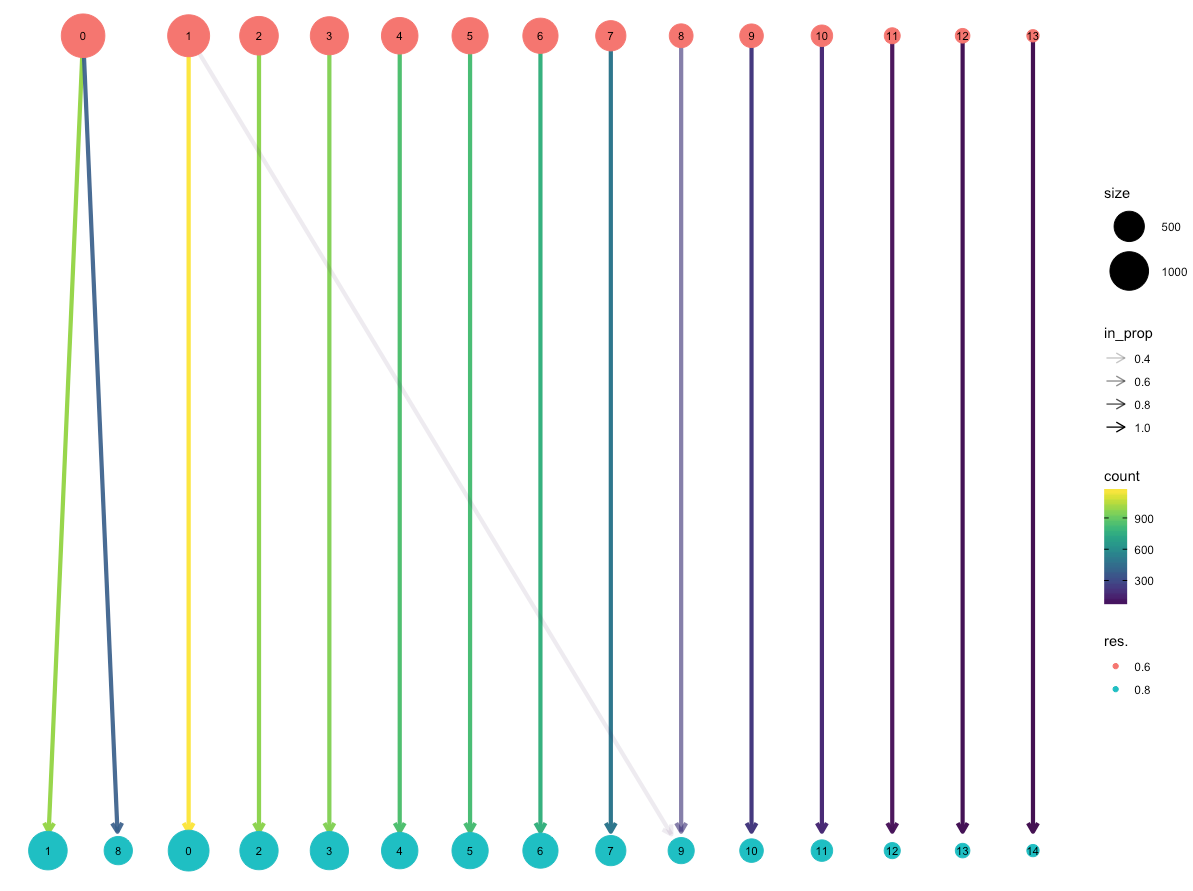
Deciding what resolution to use can be a difficult question when approaching a clustering analysis. One way to approach this problem is to look at how samples move as the number of clusters increases. This package allows you to produce clustering trees, a visualisation for interrogating clusterings as resolution increases.

Installation

You can install the release version of clustree from CRAN with:

install.packages("clustree")

If you want to use the development version that can be installed from GitHub using the remotes package:

# install.packages("remotes")
remotes::install_github("lazappi/clustree@develop")

To also build the vignettes use:

# install.packages("remotes")
remotes::install_github("lazappi/clustree@develop", dependencies = TRUE,
                         build_vignettes = TRUE)

NOTE: Building the vignettes requires the installation of additional packages.

Documentation

The documentation for clustree is available from CRAN at https://cran.r-project.org/package=clustree.

To view the vignette and all the package documentation for the development version visit http://lazappi.github.io/clustree.

Citing clustree

If you use clustree or the clustering trees approach in your work please cite our publication "Zappia L, Oshlack A. Clustering trees: a visualization for evaluating clusterings at multiple resolutions. Gigascience. 2018;7. DOI:gigascience/giy083.

citation("clustree")
 
   Zappia L, Oshlack A. Clustering trees: a visualization for
   evaluating clusterings at multiple resolutions. GigaScience.
   2018;7. DOI:gigascience/giy083
 
A BibTeX entry for LaTeX users is
 
   @Article{,
     author = {Luke Zappia and Alicia Oshlack},
     title = {Clustering trees: a visualization for evaluating clusterings at
              multiple resolutions},
     journal = {GigaScience},
     volume = {7},
     number = {7},
     month = {jul},
     year = {2018},
     url = {http://dx.doi.org/10.1093/gigascience/giy083},
     doi = {10.1093/gigascience/giy083},
   }

Contributors

Thank you to everyone who has contributed code to the clustree package:

clustree's People

Contributors

andreamrau avatar lazappi avatar mllg avatar mojaveazure avatar

Stargazers

 avatar  avatar  avatar  avatar  avatar  avatar  avatar  avatar  avatar  avatar  avatar  avatar  avatar  avatar  avatar  avatar  avatar  avatar  avatar  avatar  avatar  avatar  avatar  avatar  avatar  avatar  avatar  avatar  avatar  avatar  avatar  avatar  avatar  avatar  avatar  avatar  avatar  avatar  avatar  avatar  avatar  avatar  avatar  avatar  avatar  avatar  avatar  avatar  avatar  avatar  avatar  avatar  avatar  avatar  avatar  avatar  avatar  avatar  avatar  avatar  avatar  avatar  avatar  avatar  avatar  avatar  avatar  avatar  avatar  avatar  avatar  avatar  avatar  avatar  avatar  avatar  avatar  avatar  avatar  avatar  avatar  avatar  avatar  avatar  avatar  avatar  avatar  avatar  avatar  avatar  avatar  avatar  avatar  avatar  avatar  avatar  avatar  avatar  avatar  avatar

Watchers

 avatar  avatar  avatar  avatar  avatar  avatar

clustree's Issues

clustree_overlay creates missing values (geom_point).

Hi, Thanks for clustree!
I am trying to plot the overlay with pca/umap but it is not working when doing this command, it runs normally but all points are missing.

clustree_overlay(SeuratV.3.1.5Obj, assay = "SCT", prefix = "SCT_snn_res.", x_value = "pcaPC_1", y_value = "pcaPC_2", label_nodes = FALSE, red_dim = "pca")

output:

NAs introduced by coercionNAs introduced by coercion
Removed 732 rows containing missing values (geom_point).
Removed 11 rows containing missing values (geom_point).
Removed 18 rows containing missing values (geom_segment).
Removed 8 rows containing missing values (geom_point).
Removed 11 rows containing missing values (geom_segment).
Removed 8 rows containing missing values (geom_point).
Removed 10 rows containing missing values (geom_segment).
Removed 7 rows containing missing values (geom_point).
Removed 9 rows containing missing values (geom_segment).
Removed 6 rows containing missing values (geom_point).
Removed 7 rows containing missing values (geom_segment).
Removed 4 rows containing missing values (geom_point).
Removed 4 rows containing missing values (geom_segment).
Removed 3 rows containing missing values (geom_point).
Removed 3 rows containing missing values (geom_segment).
Removed 3 rows containing missing values (geom_point).
Removed 3 rows containing missing values (geom_segment).
Removed 3 rows containing missing values (geom_point).
Removed 3 rows containing missing values (geom_segment).
Removed 1 rows containing missing values (geom_point).
Removed 54 rows containing missing values (geom_label_repel).

And creates empty plot, Clustree function works normally.

Would this be something easier to figure out?

Compatibility with Seurat 3.0 release ?

Hello,

seurat package made a number of updates including changing class names and slots. I was wondering if there's any plan on updating clustree to be compatible the new seurat release

installation error

Hi,
I tried to install clustree, but failed. It is great if you have some tips.
I tried both install.packages and devtools.

Message
installation of package ‘clustree’ had non-zero exit status”Updating HTML index of packages in '.Library'
Making 'packages.html' ... done

sessionInfo()
R version 3.5.1 (2018-07-02)
Platform: x86_64-conda_cos6-linux-gnu (64-bit)
Running under: Ubuntu 18.04.1 LTS

Matrix products: default
BLAS/LAPACK: /home/garret/anaconda3/lib/R/lib/libRblas.so

locale:
[1] LC_CTYPE=en_US.UTF-8 LC_NUMERIC=C
[3] LC_TIME=en_US.UTF-8 LC_COLLATE=en_US.UTF-8
[5] LC_MONETARY=en_US.UTF-8 LC_MESSAGES=en_US.UTF-8
[7] LC_PAPER=en_US.UTF-8 LC_NAME=C
[9] LC_ADDRESS=C LC_TELEPHONE=C
[11] LC_MEASUREMENT=en_US.UTF-8 LC_IDENTIFICATION=C

attached base packages:
[1] stats graphics grDevices utils datasets methods base

loaded via a namespace (and not attached):
[1] Rcpp_1.0.0 digest_0.6.18 crayon_1.3.4 withr_2.1.2
[5] IRdisplay_0.7.0 R6_2.3.0 repr_0.19.1 jsonlite_1.6
[9] git2r_0.24.0.9001 evaluate_0.12 httr_1.4.0 curl_3.2
[13] uuid_0.1-2 IRkernel_0.8.14 devtools_1.13.6 tools_3.5.1
[17] xfun_0.4 compiler_3.5.1 base64enc_0.1-3 memoise_1.1.0
[21] htmltools_0.3.6 pbdZMQ_0.3-3 knitr_1.21

Add argument to reverse tree

Currently clustree() and clustree_overlay() assume that higher values of the resolution variable will result in more clusters but this is not always the case and sometimes the reverse is true. For example:

image

We can reverse the appearance of the arrows by setting the edge_arrow_ends argument but this only changes the plot, not how things like the in proportion are calculated. The new argument should completely reverse the order of resolutions. This should be relatively simple to do by making sure sorting in done in the opposite order when required.

Showing sample percentage

Originally from blog comment: http://disq.us/p/1rqks3t

Hi,

If the clusters are originating from two different samples, is there a way to integrate the percentage of cells in each cluster at each resolution in this tree?

Thanks,

Bibaswan

Pass information about current cluster to aggregation functions

The node aes aggregation functions currently have no information about the cluster they are working on. This makes it impossible to perform some useful aggregations such as proportions (raised in #54).

One possible solution is to check if the aggregation function has a ... argument. If yes this could be used to pass arguments (or a list) with details of the cluster. Something like:

if ("..." in names(as.list(args(col_aggr_fun)))) {
    cluster_info = list(res = res, cluster = cluster, size = size)
    node_data[aggr_col_name] <- col_aggr_fun(clust_meta, CLUSTER = cluster_info)
}

Using pre-existing seurat object.

Dear Luke Zappia/Alicia Oshlack,
I am using Seurat V3. I have done some analysis with it. All is set up in the seurat object. There are the pca + tsne cell coordinates on a slot in the object.
I have had a tough time to take that information and copy into the meta.data. I know this is not 100% an issue with the clustree package. I am just wondering if you ever have some parts of a script that I can use where you took a pre-existing seurat object and organised the meta.data in this way?
I am very eager to use clustree to add to data I have already.
The tutorial works. I seem to be unable to expand on the meta.data for running clustree.
Many thanks
Kaz

Bioconductor support

Hi, this package is great, and especially for SingleCellExperiment objects, this is a wonderful tool to evaluate the performance of various clustering resolutions. I wanted to ask if you have any plans to submit to Bioconductor, as I'm sure the community would be very thrilled to have this within the repository, especially as it plays nicely with existing clustering approaches such as SC3. Thanks!

Labelling nodes with size

Received via email:

i´d like to use your package to visualize clusters results.

I have a question: how to visualize the size of each node?
My data are not labeled, so I can´t use something like:

countrow <- function(labels) {
   length(labels)
   return(length(labels))
}


clustree(iris_clusts, prefix = "K", node_label = "Species",
    node_label_aggr = "countrow")

sc3_stability yields very low stability indices

Dear all,

I wanted to apply the sc3_stability calculation to clusters that I have annotated in a Seurat object. Since I could not figure out how to apply the formula by myself I wanted to make use of the implementation in the clustree function.
I calculated clusterings in Seurat (louvain algorithm) where I kept the resolution constant but varied the k.param value in FindNeighbors. The respective results I provided to clustree as follows:

clustree.plot <- clustree(SO, prefix = "k.param.", suffix = "_integrated_snn_res.1.5", node_colour = "sc3_stability")

Between prefix and suffix is a number which indicates the k.param value used. When projecting the clusterings for k.params from 20 to 22 onto a tSNE embedding some clusters (e.g. cluster 0) actually appear stable (see the image below) but the sc3 stability is quite low.

Why is this the case? Did I get the concept of cluster stability wrong? Even if there are a few cells changing their identity on the edges of clusters the penalty for that would be very high.
It may be that sc3 is not suitable for such adjacent clusters but rather for clearly separated ones? If this is a the case then this issue may better be raised at the sc3 repository.

20200429_plot

clustree_overlay on UMAP from a seurat object

Dear developers,
I just came across your package and wanted to create an clustree_overlay with my existing seurat object. Unfortunately I can not figure out how to set the parameters correctly. I have tried:

clustree_overlay(seurat_object, red_dim = "umap", x_value = "UMAP_1", y_value = "UMAP_2")
which results in
Error: No data identified for x_value or y_value. Check that red_dim is set correctly.

I checked that there is a umap reduction and
colnames(seurat_object@reductions$umap)
tells me that the column names of my reduction are
[1] "UMAP_1" "UMAP_2"

Can you tell me what I am doing wrong?

Also for the PCA, the overlay is not working for me. I have a pca in my seurat object$reductions, but the clustree_overlay is not working .

I am using Seurat version 3.1.5.

Thanks ans best,
Laura

Node aesthetics using independently computed data for each node

I compute some statistics from predicting models for each cluster and save them in a separate data.frame. But I cannot figure out how to color the clustree nodes by these values. I've tried to directly modify data for returned ggplot object, but with this operation the data is converted to pure data.frame loosing all information on edges.

ct = clustree(sobj, prefix = "K", node_colour="sig", node_colour_aggr = "mean")
class(ct$data)
[1] "layout_igraph" "layout_ggraph" "data.frame"
ct$data = ct$data %>% left_join(df.nodes, by="node")
class(ct$data)
[1] "data.frame"
ct
Error: edges must contain the columns from, to, x, y, xend, yend and circular

Any ideas or a workaround?

Thanks for the great package!

Error if clustree not loaded

data("iris_clusts")
clustree::clustree(iris_clusts, prefix = "K")
Error in get(as.character(FUN), mode = "function", envir = envir) : 
  object 'guide_edge_colourbar' of mode 'function' was not found

mapping cluster nodes to cells

Hello

I was wondering, after I run clustree on a single cell dataset, for a given cluster node, how would one map the cluster back to the cells ?

Datasets requiring other packages

Below email received from CRAN

This concerns packages

DDPNA GCD GPoM Guerry HydroCode NMF NatureSounds RgoogleMaps
SpatialAcc TSP ade4 bamlss belg clustree datos dnet dsm gibble
glcm hypergate lctools link2GI nutshell.audioscrobbler ocedata palr
primerTree ragt2ridges rangemodelR rdwd serrsBayes smoothr spBayes
spData spaMM spatstat.data streamDepletr structSSI survivALL wpp2017 wpp2019

See the logs (and README.txt) at
https://www.stats.ox.ac.uk/pub/bdr/noSuggests/ .

At least one of the datasets cannot be loaded without a package declared
in Suggests: -- typically this is because it loads a namespace defining
S4 classes, and such imports should be declared in Imports or (as Matrix
does) use a .R wrapper. For example if I do

data('Sample_ID_data', package = 'DDPNA')
str(Sample_ID_data)

namespaces

BiocGenerics Biostrings IRanges S4Vectors XVector crayon zlibbioc

get loaded, pulled in by Biostrings so the latter has to be available.

Please correct ASAP and before Feb 20 to safely retain the package on CRAN.

Error: Less than two column names matched the prefix: .res but I have ran a few clusters

Hi Developers of Clustree

I have ran find clusters with a few resolutions
obj <- FindClusters(object = obj, resolution = seq(0.5,0.6,0.7))
this works ok
and then ran clustree

clustree(obj,prefix = "res.")

but I got the error
Error: Less than two column names matched the prefix: res.

Could you kindly share with me what am I missing out?
I am running Seurat_3.1.5

Producing clustering trees from seurat

Hello,

Well done on the release of your package!
I am using it to produce a clustering tree from a Seurat object. However, the tree I produce is quite simple as there seems to only be 2 resolutions. I was looking at your example for Seurat here (https://lazappi.github.io/clustree/articles/clustree.html) and your metadata contains clustering for a variety of resolutions. Do you know how I go about fixing this? I realize this isn't an issue directly associated with clustree & perhaps more so Seurat. I was just wondering if you knew how I could visualize the clustering at more resolutions than just 0.6 and 0.8.

Cheers in advance,
Lucy

pbmc <- FindClusters(object = pbmc, reduction.type = "pca", dims.use = 1:10, print.output = 0, save.SNN = TRUE)
PrintFindClustersParams(object = pbmc)
Parameters used in latest FindClusters calculation run on: 2018-07-20 23:27:12
=============================================================================
Resolution: 0.6
-----------------------------------------------------------------------------
Modularity Function    Algorithm         n.start         n.iter
     1                   1                 100             10
-----------------------------------------------------------------------------
Reduction used          k.param          prune.SNN
     pca                 30                0.0667
-----------------------------------------------------------------------------
Dims used in calculation
=============================================================================
1 2 3 4 5 6 7 8 9 10
head([email protected])
                 nGene nUMI  orig.ident percent.mito res.0.6 res.0.8
AAACCTGAGCATCATC   871 2394 10X_PBMC_8k   0.03844547       6       6
AAACCTGAGCTAACTC   806 1694 10X_PBMC_8k   0.05726092       5       5
AAACCTGAGCTAGTGG  1316 4520 10X_PBMC_8k   0.01946903       3       3
AAACCTGCACATTAGC   898 2788 10X_PBMC_8k   0.01398852       0       1
AAACCTGCACTGTTAG  1526 4667 10X_PBMC_8k   0.03622722       4       4
AAACCTGCATAGTAAG  1495 4440 10X_PBMC_8k   0.03806306       4       4
clustree(pbmc)

screen shot 2018-07-21 at 15 22 48

Side plots break when resolution is rounded

The side plots in clustree_overlay() when use_colour = "points" break if the resolution value is rounded. For example for a resolution column called res_1.0. plot_overlay_side() should use the column name directly instead of the levels of the resolution factor. The main overlay plot doesn't do this so it still works.

Release clustree 0.4.3

Prepare for release:

  • Check current CRAN check results
  • devtools::check(remote = TRUE, manual = TRUE)
  • devtools::check_win_devel()
  • rhub::check_for_cran()
  • revdepcheck::revdep_check(num_workers = 4)
  • Update cran-comments.md
  • Polish NEWS
  • Review pkgdown reference index for, e.g., missing topics

Submit to CRAN:

  • usethis::use_version('patch')
  • devtools::submit_cran()
  • Approve email

Wait for CRAN...

  • Accepted 🎉
  • Remove devel tags from issues
  • Delete CRAN-RELEASE
  • Merge develop into master
  • usethis::use_github_release()
  • usethis::use_dev_version()

Pattern matching in clustree.data.frame

grepl is used to match data.frame columns with clustering information. If the prefix contains a wildcard character (e.g. ".") that can lead to matching incorrect columns.

A simple solution would be to add fixed = TRUE.

grepl(prefix, colnames(x), fixed = TRUE)

Metadata columns not extracted from tibbles

Tibbles don't like to stop being tibbles. This means that the following line in aggr_metadata() returns a tibble rather than a vector 😿:

clust_meta <- metadata[is_cluster, col_name]

Use something like this instead:

clust_meta <- metadata[[col_name]][is_cluster]

Resolution axis

Add an axis to the standard clustering tree plot to show the resolution dimension.

Separate shared code

The clustree() and clustree_overlay() functions have a lot of code in common (especially checks). It would be good to abstract this into separate functions so it only needs to be updated and tested in one place.

ERROR in examples

running:

library(clustree)
data("iris_clusts")
clustree(iris_clusts, prefix = "K")

gives me an error:

Error in guide_train.edge_colourbar(guide, scale, output) : 
  unused argument (output)

Is it due to incompatible versions?

this is my session info:

attached base packages:
[1] stats graphics grDevices utils datasets methods base

other attached packages:
[1] bindrcpp_0.2 clustree_0.1.2 ggraph_1.0.1 ggplot2_2.2.1.9000

loaded via a namespace (and not attached):
[1] Rcpp_0.12.16 pillar_1.1.0 compiler_3.4.3 git2r_0.21.0 plyr_1.8.4 bindr_0.1 viridis_0.5.1
[8] tools_3.4.3 digest_0.6.15 checkmate_1.8.5 viridisLite_0.3.0 memoise_1.1.0 tibble_1.4.2 gtable_0.2.0
[15] pkgconfig_2.0.1 rlang_0.2.0 igraph_1.2.1 curl_3.2 ggrepel_0.8.0.9000 yaml_2.1.16 gridExtra_2.3
[22] withr_2.1.2 dplyr_0.7.4 httr_1.3.1 knitr_1.19 devtools_1.13.5 grid_3.4.3 glue_1.2.0
[29] R6_2.2.2 tweenr_0.1.5 udunits2_0.13 magrittr_1.5 backports_1.1.2 scales_0.5.0 MASS_7.3-48
[36] units_0.5-1 assertthat_0.2.0 ggforce_0.1.1 colorspace_1.3-2 labeling_0.3 lazyeval_0.2.1 munsell_0.4.3

Select adjoining resolutions based on ARI

Currently {clustree} assumes the user knows the order of resolutions but this might not always be the case (if a clustering parameter doesn't have a natural order or has a non-linear effect) or it might just be interesting to see a "data-driven" order of resolutions.

One way to come up with an ordering would be to calculate the Adjusted Rand Index between pairs of clustering. Potentially starting with the clustering with most clusters and greedily adding those with highest ARI to build up the tree.

Idea originally from Aaron Lun.

Default colour ordering

By default colours are assigned to resolutions alphabetically so you get 1, 10, 2, 3, ... instead of 1, 2, 3, ... , 10

Customising arrow colour

Hi,

It doesn't seem like it is possible to customise the colour-coding used for the arrows between nodes, is that correct? I tried clustree(x) + scale_colour_brewer("Blues"), but this changed the node colour.

I find the mapping of brighter/lighter colours to higher numbers unintuitive, especially when combined with transparency that is typically higher for darker colours. It would be nice to have the option of a colour scheme that maps darker colours to higher numbers, and perhaps also the option to turn off this colour mapping.

Thanks for the nice package!

Error if options(stringsAsFactors = FALSE)

Using the common option,

options(stringsAsFactors = FALSE)

causes an error:

Error in pathAttr(data, length(unique(data$group))) :
Not compatible with requested type: [type=character; target=integer].

# Works:
library(clustree)
data("iris_clusts")
clustree(iris_clusts, prefix = "K")

# Won't work:
options(stringsAsFactors = FALSE)
clustree(iris_clusts, prefix = "K")

Two-argument feature and classic clustree labels

Hi,
Great work on the package! I was wondering whether the following two features are available for the clusstree visualisation:

  1. Attach a two-argument function to a node characteristic. E.g. use node_alpha + node_alpha_aggr to have the transparency represent something like percentage of patients(one of the columns) in a cluster. This would need both cluster size and number of patients of the cluster.

  2. Can there be labels on the nodes on the classic visusalization (not the overlays)?

Thanks a lot in advance, once again the package is awesome.

strange export of clustree

Hello developer, I met a strange result of clustree(dataset), which dataset is a seurat object

cluster_res_evaluate

So,as you can see many clusters can't traceback.By the way,this is the first time I get this trouble,
any suggestions will be welcome,thanks

Color reflecting cluster size/number instead of level

Hi, congrats on the excellent package,

I was wondering if it is possible to color the cluster nodes reflecting the size in the same way Seurat does. I did by hand in Illustrator to make my point more clear.

rplot01

Thank you!

How to find raw data in the object to plot in_prop

Hi
Not sure if this has been posted before, I am trying to access the data that used to plot in_prop. Can you direct me where to find it? This is the first layer of list titles that I have
test <- clustree(X)
names(test)
[1] "data" "layers" "scales" "mapping" "theme"
[6] "coordinates" "facet" "plot_env" "labels"

Thanks!

Axis labels don't match axis value

Hi,
This is a nice package!

I noticed that when using show_axis = TRUE, the axis labels don't match the resolutions used / the node colours. For reference, this is using a Seurat object.

clustree_example

Here for example, the top row has the axis label 0.2 but the node is labelled 0 (which seems to be correct!).

In this case I first ran clustering with resolutions 0.2-1.4, and added clustering with resolution = 0 later, so the "0" column comes after the other columns in the [email protected] data frame. I wonder if the order of column names is used to set the axis labels?

Edit: this does seem to depend on the order of the column names. I removed the columns and re-ran the clustering providing resolution = c(0.2, 0, 1.1, 0.8), and both the columns and axis labels are also in that order.

Seurat3 reduced dims

Hi,
would you mind sharing a practical example on how to access the pca or umap reduction of a Seurat3 object in order to use the cluster_overlay function?
I'm having an hard time implementing what suggested in your documentation:
".. red_dim must be set to the name of a dimensionality reduction in reducedDimNames(x) (for a SingleCellExperiment) or x@dr (for a Seurat object). x_value and y_value can then be set to red_dimX when red_dim matches the red_dim argument and X is the column of the dimensionality reduction to use"
I tried
clustree_overlay(seurat.object, "PC_1", "PC_2", prefix = "RNA_snn_res.", red_dim = "pca" , assay = "RNA")
The dimensionality reductions are stored in the seuratobject@reductions and they can be seuratobject@reductions$pca seuratobject@reductions$umap
Thanks in advance

How to pick the best resolution option for Seurat clustering

Hi,

I currently has a big data set. Pre-process and clustering was done using Seurat. Now I am trying to use this very cool package to help me pick a better resolution for clustering (actually a bit over-clustering).

Here I tried 10 different resolutions from 1 to 10, and plotted clustree (using sc3_stability). The tree has ten layers representing res=1 to 10 from top to bottom.

Would like to pick ur minds for better interpretation and resolution options.

clustree_stability.singlet.pc50.pdf

Have a good weekend and take care.

bless~

Error when loading clustree

Hi Luke,

I am having this error when loading clustree. Any idea why this is happening?

> require(clustree)
Loading required package: clustree
Error: package or namespace load failed for 'clustree' in get(Info[i, 1], envir = env):
 lazy-load database '/Library/Frameworks/R.framework/Versions/3.4/Resources/library/ggplot2/R/ggplot2.rdb' is corrupt
Warning message:
In get(Info[i, 1], envir = env) : internal error -3 in R_decompress1

Best,
Leon

> devtools::session_info()
Session info -------------------------------------------------------------------------------------------------------------------------
 setting  value                       
 version  R version 3.4.3 (2017-11-30)
 system   x86_64, darwin15.6.0        
 ui       RStudio (1.1.423)           
 language (EN)                        
 collate  C                           
 tz       Europe/Zurich               
 date     2018-07-04                  

Packages -----------------------------------------------------------------------------------------------------------------------------
 package       * version    date       source                               
 abind           1.4-5      2016-07-21 CRAN (R 3.4.0)                       
 acepack         1.4.1      2016-10-29 cran (@1.4.1)                        
 ape             5.1        2018-04-04 CRAN (R 3.4.4)                       
 assertthat      0.2.0      2017-04-11 CRAN (R 3.4.0)                       
 backports       1.1.2      2017-12-13 cran (@1.1.2)                        
 base          * 3.4.3      2017-12-07 local                                
 base64enc       0.1-3      2015-07-28 cran (@0.1-3)                        
 bbmle           1.0.20     2017-10-30 cran (@1.0.20)                       
 bindr           0.1.1      2018-03-13 CRAN (R 3.4.4)                       
 bindrcpp      * 0.2.2      2018-03-29 CRAN (R 3.4.4)                       
 bitops          1.0-6      2013-08-17 cran (@1.0-6)                        
 broom           0.4.4      2018-03-29 CRAN (R 3.4.4)                       
 caret           6.0-79     2018-03-29 CRAN (R 3.4.4)                       
 caTools         1.17.1     2014-09-10 cran (@1.17.1)                       
 checkmate       1.8.5      2017-10-24 CRAN (R 3.4.2)                       
 class           7.3-14     2015-08-30 CRAN (R 3.4.3)                       
 cluster         2.0.7-1    2018-04-09 CRAN (R 3.4.4)                       
 codetools       0.2-15     2016-10-05 CRAN (R 3.4.3)                       
 colorspace      1.3-2      2016-12-14 CRAN (R 3.4.0)                       
 compiler        3.4.3      2017-12-07 local                                
 cowplot       * 0.9.2      2017-12-17 CRAN (R 3.4.3)                       
 curl            3.2        2018-03-28 CRAN (R 3.4.3)                       
 CVST            0.2-1      2013-12-10 CRAN (R 3.4.0)                       
 data.table      1.10.4-3   2017-10-27 CRAN (R 3.4.2)                       
 datasets      * 3.4.3      2017-12-07 local                                
 ddalpha         1.3.2      2018-04-08 CRAN (R 3.4.4)                       
 DEoptimR        1.0-8      2016-11-19 cran (@1.0-8)                        
 devtools      * 1.13.5     2018-02-18 CRAN (R 3.4.3)                       
 diffusionMap    1.1-0      2014-02-20 cran (@1.1-0)                        
 digest          0.6.15     2018-01-28 CRAN (R 3.4.3)                       
 dimRed          0.1.0      2017-05-04 CRAN (R 3.4.0)                       
 diptest         0.75-7     2016-12-05 cran (@0.75-7)                       
 doSNOW          1.0.16     2017-12-13 CRAN (R 3.4.3)                       
 dplyr           0.7.6      2018-06-29 cran (@0.7.6)                        
 DRR             0.0.3      2018-01-06 CRAN (R 3.4.3)                       
 dtw             1.20-1     2018-05-18 CRAN (R 3.4.3)                       
 fitdistrplus    1.0-9      2017-03-24 CRAN (R 3.4.0)                       
 flexmix         2.3-14     2017-04-28 CRAN (R 3.4.0)                       
 FNN             1.1        2013-07-31 cran (@1.1)                          
 foreach         1.4.4      2017-12-12 CRAN (R 3.4.3)                       
 foreign         0.8-70     2018-04-23 CRAN (R 3.4.3)                       
 Formula         1.2-3      2018-05-03 CRAN (R 3.4.3)                       
 fpc             2.1-11     2018-01-13 CRAN (R 3.4.3)                       
 gdata           2.18.0     2017-06-06 cran (@2.18.0)                       
 geometry        0.3-6      2015-09-09 CRAN (R 3.4.0)                       
 ggforce         0.1.1      2016-11-28 CRAN (R 3.4.0)                       
 ggraph        * 1.0.1      2018-01-29 cran (@1.0.1)                        
 ggrepel         0.8.0      2018-05-09 CRAN (R 3.4.3)                       
 ggridges        0.5.0      2018-04-05 CRAN (R 3.4.4)                       
 git2r           0.21.0     2018-01-04 CRAN (R 3.4.3)                       
 glue            1.2.0      2017-10-29 CRAN (R 3.4.2)                       
 gower           0.1.2      2017-02-23 CRAN (R 3.4.0)                       
 gplots          3.0.1      2016-03-30 cran (@3.0.1)                        
 graphics      * 3.4.3      2017-12-07 local                                
 grDevices     * 3.4.3      2017-12-07 local                                
 grid            3.4.3      2017-12-07 local                                
 gridExtra       2.3        2017-09-09 CRAN (R 3.4.1)                       
 gtable          0.2.0      2016-02-26 CRAN (R 3.4.0)                       
 gtools          3.5.0      2015-05-29 cran (@3.5.0)                        
 Hmisc           4.1-1      2018-01-03 CRAN (R 3.4.3)                       
 htmlTable       1.11.2     2018-01-20 CRAN (R 3.4.3)                       
 htmltools       0.3.6      2017-04-28 cran (@0.3.6)                        
 htmlwidgets     1.2        2018-04-19 CRAN (R 3.4.3)                       
 httr            1.3.1      2017-08-20 CRAN (R 3.4.1)                       
 ica             1.0-1      2015-08-25 cran (@1.0-1)                        
 igraph          1.2.1      2018-03-10 CRAN (R 3.4.4)                       
 ipred           0.9-6      2017-03-01 CRAN (R 3.4.0)                       
 irlba           2.3.2      2018-01-11 CRAN (R 3.4.3)                       
 iterators       1.0.9      2017-12-12 CRAN (R 3.4.3)                       
 jsonlite        1.5        2017-06-01 CRAN (R 3.4.0)                       
 kernlab         0.9-26     2018-04-30 CRAN (R 3.4.3)                       
 KernSmooth      2.23-15    2015-06-29 CRAN (R 3.4.3)                       
 knitr           1.20       2018-02-20 CRAN (R 3.4.3)                       
 labeling        0.3        2014-08-23 CRAN (R 3.4.0)                       
 lars            1.2        2013-04-24 cran (@1.2)                          
 lattice         0.20-35    2017-03-25 CRAN (R 3.4.3)                       
 latticeExtra    0.6-28     2016-02-09 cran (@0.6-28)                       
 lava            1.6.1      2018-03-28 CRAN (R 3.4.3)                       
 lazyeval        0.2.1      2017-10-29 CRAN (R 3.4.2)                       
 lmtest          0.9-36     2018-04-04 CRAN (R 3.4.4)                       
 lubridate       1.7.4      2018-04-11 CRAN (R 3.4.4)                       
 M3Drop        * 3.09.00    2018-05-17 Github (tallulandrews/M3Drop@1007941)
 magic           1.5-8      2018-01-26 CRAN (R 3.4.3)                       
 magrittr      * 1.5        2014-11-22 CRAN (R 3.4.0)                       
 MASS            7.3-50     2018-04-30 CRAN (R 3.4.3)                       
 Matrix        * 1.2-14     2018-04-09 CRAN (R 3.4.4)                       
 matrixStats     0.53.1     2018-02-11 CRAN (R 3.4.3)                       
 mclust          5.4        2017-11-22 CRAN (R 3.4.3)                       
 memoise         1.1.0      2017-04-21 CRAN (R 3.4.0)                       
 metap           0.9        2018-04-25 CRAN (R 3.4.3)                       
 methods       * 3.4.3      2017-12-07 local                                
 mgcv            1.8-23     2018-01-15 CRAN (R 3.4.3)                       
 mixtools        1.1.0      2017-03-10 cran (@1.1.0)                        
 mnormt          1.5-5      2016-10-15 cran (@1.5-5)                        
 ModelMetrics    1.1.0      2016-08-26 cran (@1.1.0)                        
 modeltools      0.2-21     2013-09-02 cran (@0.2-21)                       
 munsell         0.5.0      2018-06-12 cran (@0.5.0)                        
 mvtnorm         1.0-7      2018-01-25 CRAN (R 3.4.3)                       
 nlme            3.1-137    2018-04-07 CRAN (R 3.4.4)                       
 nnet            7.3-12     2016-02-02 CRAN (R 3.4.3)                       
 numDeriv      * 2016.8-1   2016-08-27 cran (@2016.8-)                      
 parallel        3.4.3      2017-12-07 local                                
 pbapply         1.3-4      2018-01-10 CRAN (R 3.4.3)                       
 pillar          1.2.2      2018-04-26 CRAN (R 3.4.3)                       
 pkgconfig       2.0.1      2017-03-21 CRAN (R 3.4.0)                       
 plyr            1.8.4      2016-06-08 CRAN (R 3.4.0)                       
 png             0.1-7      2013-12-03 CRAN (R 3.4.0)                       
 prabclus        2.2-6      2015-01-14 cran (@2.2-6)                        
 prodlim         2018.04.18 2018-04-18 CRAN (R 3.4.4)                       
 proxy           0.4-22     2018-04-08 CRAN (R 3.4.4)                       
 psych           1.8.4      2018-05-06 CRAN (R 3.4.3)                       
 purrr           0.2.5      2018-05-29 cran (@0.2.5)                        
 R.methodsS3     1.7.1      2016-02-16 cran (@1.7.1)                        
 R.oo            1.22.0     2018-04-22 CRAN (R 3.4.3)                       
 R.utils         2.6.0      2017-11-05 CRAN (R 3.4.2)                       
 R6              2.2.2      2017-06-17 CRAN (R 3.4.0)                       
 ranger          0.9.0      2018-01-09 CRAN (R 3.4.3)                       
 RANN          * 2.5.1      2017-05-21 CRAN (R 3.4.0)                       
 RColorBrewer    1.1-2      2014-12-07 CRAN (R 3.4.0)                       
 Rcpp            0.12.17    2018-05-18 cran (@0.12.17)                      
 RcppRoll        0.2.2      2015-04-05 CRAN (R 3.4.0)                       
 recipes         0.1.2      2018-01-11 CRAN (R 3.4.1)                       
 reldist         1.6-6      2016-10-09 cran (@1.6-6)                        
 reshape2        1.4.3      2017-12-11 cran (@1.4.3)                        
 reticulate      1.7        2018-04-28 CRAN (R 3.4.3)                       
 rlang           0.2.0.9001 2018-07-04 Github (tidyverse/rlang@0178fc9)     
 robustbase      0.92-8     2017-11-01 CRAN (R 3.4.2)                       
 ROCR            1.0-7      2015-03-26 cran (@1.0-7)                        
 rpart           4.1-13     2018-02-23 CRAN (R 3.4.3)                       
 rstudioapi      0.7        2017-09-07 CRAN (R 3.4.1)                       
 Rtsne         * 0.13       2017-04-14 cran (@0.13)                         
 scales          0.5.0.9000 2018-07-04 Github (hadley/scales@f36fd36)       
 scatterplot3d   0.3-41     2018-03-14 CRAN (R 3.4.4)                       
 SDMTools        1.1-221    2014-08-05 cran (@1.1-221)                      
 segmented       0.5-3.0    2017-11-30 CRAN (R 3.4.3)                       
 Seurat        * 2.3.1      2018-05-05 CRAN (R 3.4.3)                       
 sfsmisc         1.1-2      2018-03-05 CRAN (R 3.4.4)                       
 sn              1.5-2      2018-04-24 CRAN (R 3.4.3)                       
 snow            0.4-2      2016-10-14 cran (@0.4-2)                        
 splines         3.4.3      2017-12-07 local                                
 statmod         1.4.30     2017-06-18 CRAN (R 3.4.0)                       
 stats         * 3.4.3      2017-12-07 local                                
 stats4          3.4.3      2017-12-07 local                                
 stringi         1.2.3      2018-06-12 cran (@1.2.3)                        
 stringr         1.3.1      2018-05-10 CRAN (R 3.4.3)                       
 survival        2.42-3     2018-04-16 CRAN (R 3.4.4)                       
 tclust          1.3-1      2017-08-24 CRAN (R 3.4.1)                       
 tibble          1.4.2      2018-01-22 CRAN (R 3.4.3)                       
 tidyr           0.8.1      2018-05-18 cran (@0.8.1)                        
 tidyselect      0.2.4      2018-02-26 CRAN (R 3.4.3)                       
 timeDate        3043.102   2018-02-21 CRAN (R 3.4.3)                       
 tools           3.4.3      2017-12-07 local                                
 trimcluster     0.1-2      2012-10-29 cran (@0.1-2)                        
 tsne            0.1-3      2016-07-15 cran (@0.1-3)                        
 tweenr          0.1.5      2016-10-10 CRAN (R 3.4.0)                       
 udunits2        0.13       2016-11-17 CRAN (R 3.4.0)                       
 units           0.5-1      2018-01-08 CRAN (R 3.4.3)                       
 utils         * 3.4.3      2017-12-07 local                                
 VGAM            1.0-5      2018-02-07 CRAN (R 3.4.3)                       
 viridis       * 0.5.1      2018-03-29 CRAN (R 3.4.4)                       
 viridisLite   * 0.3.0      2018-02-01 CRAN (R 3.4.1)                       
 withr           2.1.2      2018-07-04 Github (jimhester/withr@fe56f20)     
 yaml            2.1.19     2018-05-01 CRAN (R 3.4.3)                       
 zoo             1.8-1      2018-01-08 CRAN (R 3.4.3)  

Redesign aesthetics interface (possibly tidyeval)

The current interface for defining aesthetics using metadata columns requires a string giving the name of the column (e.g. node_AES) and a string giving the name of a function to summarise samples in each cluster (e.g. node_AES_aggr). This approach has the following limitations:

  • Can't use anonymous functions (e.g. node_colour_aggr = function(x) {...}) (doing this has other issues around naming)
  • Only one column can be used for each aesthetic
  • Can't set other arguments in functions
  • Many function arguments, need (at least) two for each aesthetic

How could we address some of these issues?

  • Use tidyeval
    • Use non-standard evaluation, e.g. names instead of strings
  • Specify aesthetics using a list
    • aes = list(node_colour = list(func = mean, x = colA), ...)
  • Directly pass ggplot aes

Possible issues to consider:

  • Allowing static aesthetics (e.g. `node_colour = "red")
  • Checking function arguments exist
  • Summarise columns
  • Naming

non-numeric cluster names

If I would like to use custom cluster labels, is there a way to do that?

Currently, the clusterings have to be numeric. There are a few places in the code where that is explicitly enforced. Since the clusters are discrete values, is it necessary to do that?

Recommend Projects

  • React photo React

    A declarative, efficient, and flexible JavaScript library for building user interfaces.

  • Vue.js photo Vue.js

    🖖 Vue.js is a progressive, incrementally-adoptable JavaScript framework for building UI on the web.

  • Typescript photo Typescript

    TypeScript is a superset of JavaScript that compiles to clean JavaScript output.

  • TensorFlow photo TensorFlow

    An Open Source Machine Learning Framework for Everyone

  • Django photo Django

    The Web framework for perfectionists with deadlines.

  • D3 photo D3

    Bring data to life with SVG, Canvas and HTML. 📊📈🎉

Recommend Topics

  • javascript

    JavaScript (JS) is a lightweight interpreted programming language with first-class functions.

  • web

    Some thing interesting about web. New door for the world.

  • server

    A server is a program made to process requests and deliver data to clients.

  • Machine learning

    Machine learning is a way of modeling and interpreting data that allows a piece of software to respond intelligently.

  • Game

    Some thing interesting about game, make everyone happy.

Recommend Org

  • Facebook photo Facebook

    We are working to build community through open source technology. NB: members must have two-factor auth.

  • Microsoft photo Microsoft

    Open source projects and samples from Microsoft.

  • Google photo Google

    Google ❤️ Open Source for everyone.

  • D3 photo D3

    Data-Driven Documents codes.