GithubHelp home page GithubHelp logo

plotters-rs / plotters Goto Github PK

View Code? Open in Web Editor NEW
3.7K 41.0 270.0 7.68 MB

A rust drawing library for high quality data plotting for both WASM and native, statically and realtimely ๐Ÿฆ€ ๐Ÿ“ˆ๐Ÿš€

Home Page: https://plotters-rs.github.io/home/

License: MIT License

Rust 99.81% Shell 0.19%
rust visualization plotting webassembly science graphing data-plotting rust-crate plot

plotters's Introduction

Plotters - A Rust drawing library focusing on data plotting for both WASM and native applications ๐Ÿฆ€๐Ÿ“ˆ๐Ÿš€

Plotters is a drawing library designed for rendering figures, plots, and charts, in pure Rust. Plotters supports various types of back-ends, including bitmap, vector graph, piston window, GTK/Cairo and WebAssembly.

  • A new Plotters Developer's Guide is a work in progress. The preview version is available here.
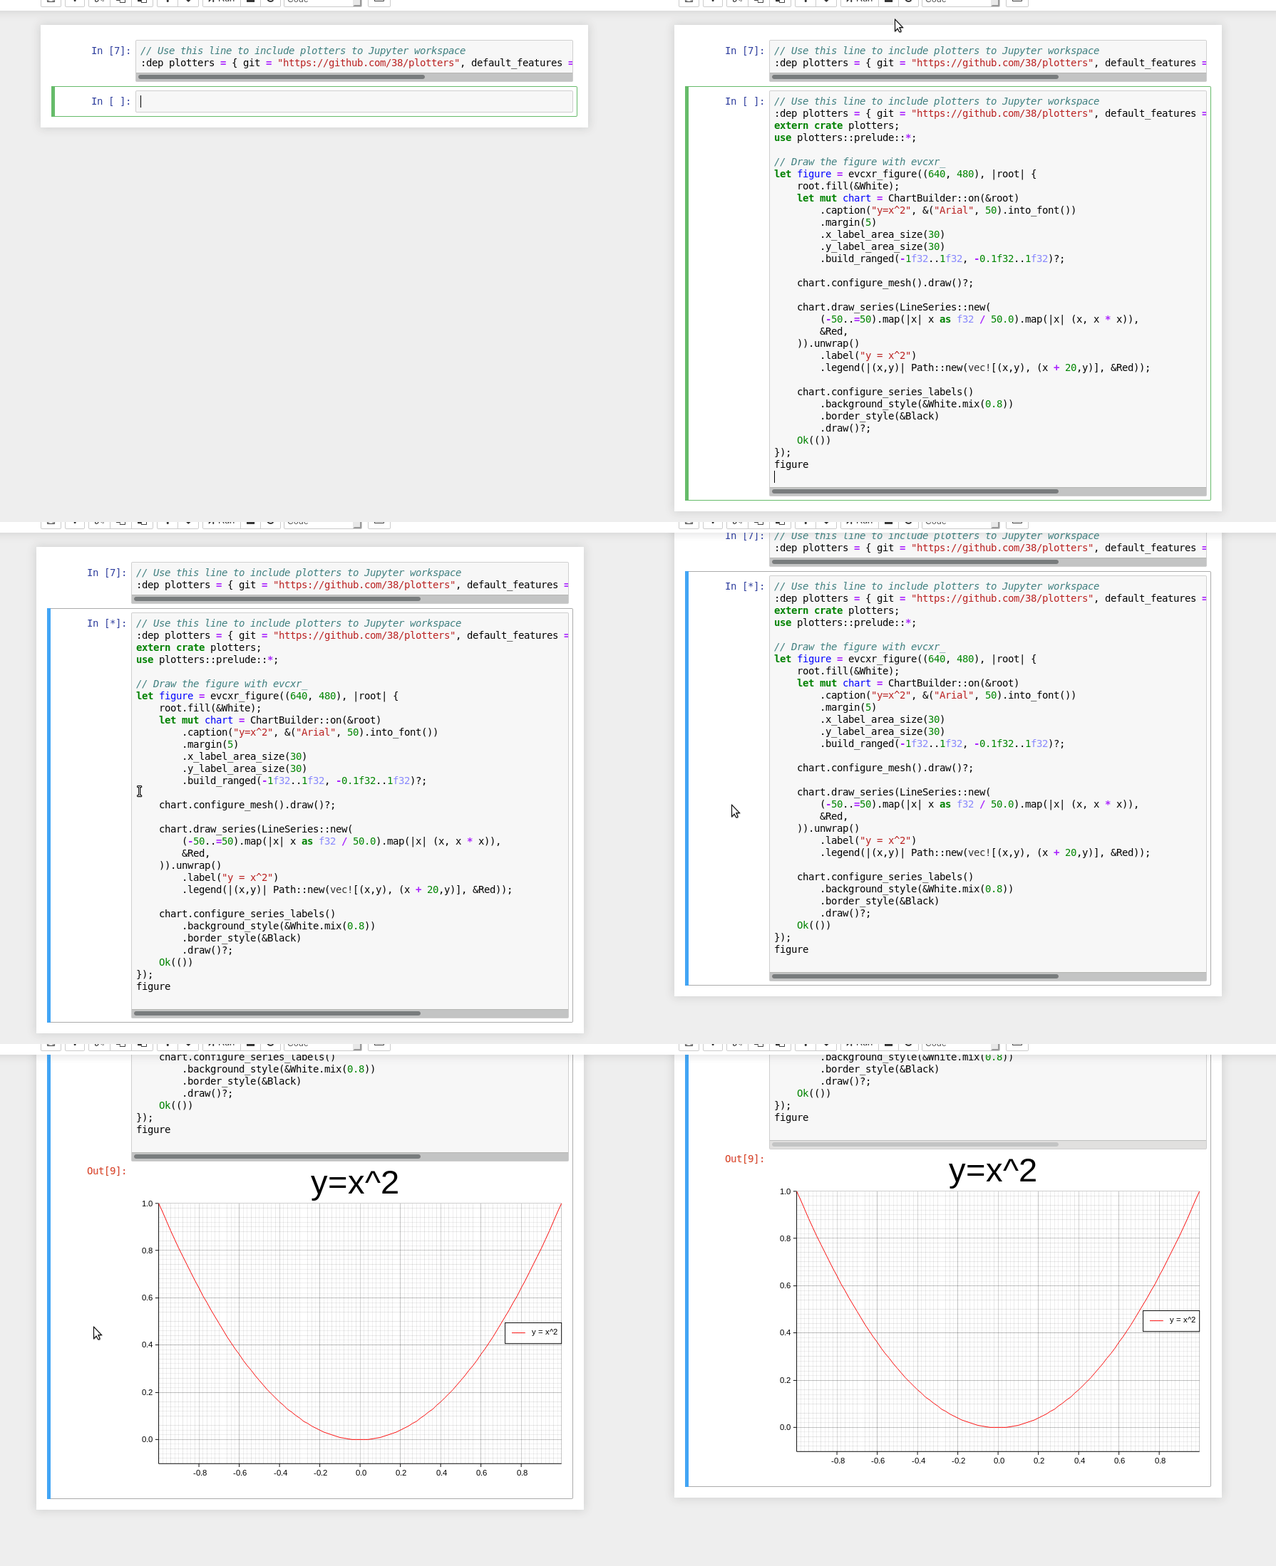
  • Try Plotters with an interactive Jupyter notebook, or view here for the static HTML version.
  • To view the WASM example, go to this link
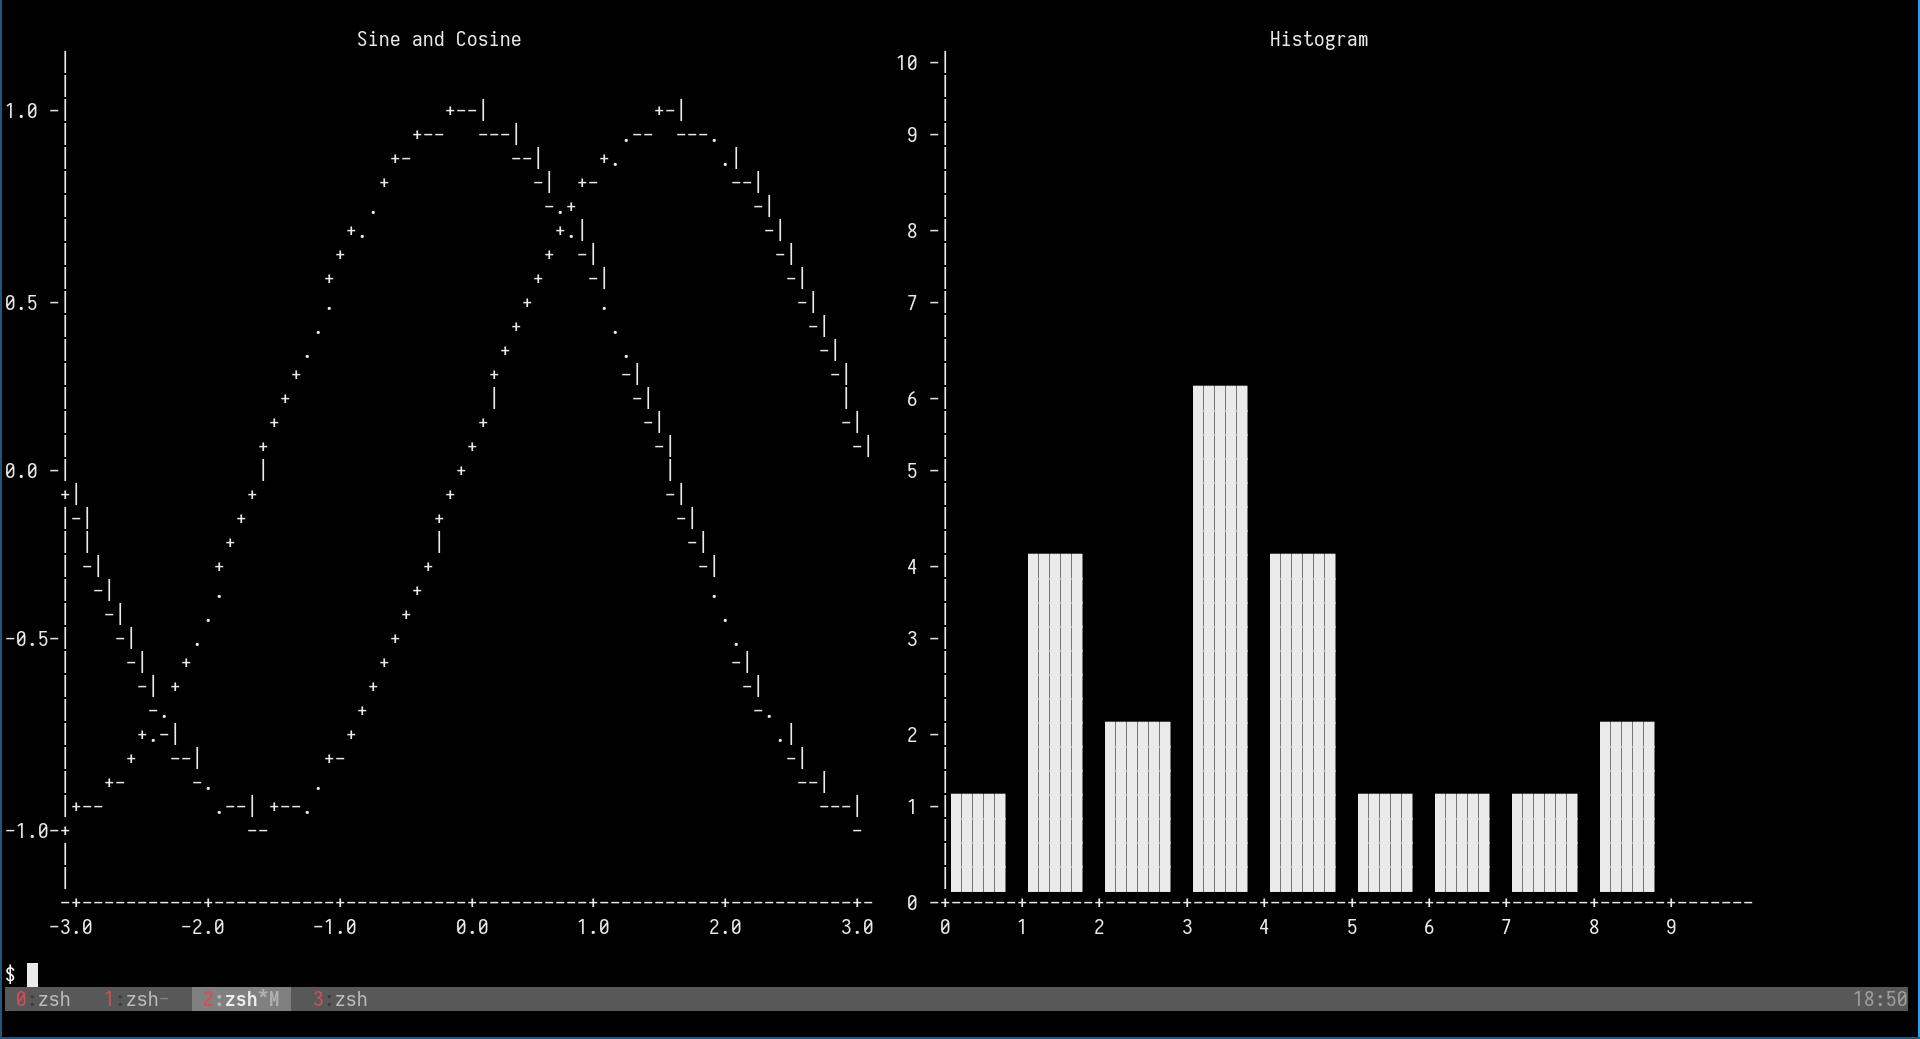
  • Currently we have all the internal code ready for console plotting, but a console based backend is still not ready. See this example for how to plot on console with a customized backend.
  • Plotters has moved some backend code to separate repositories, check FAQ list for details
  • Some interesting demo projects are available, feel free to try them out.

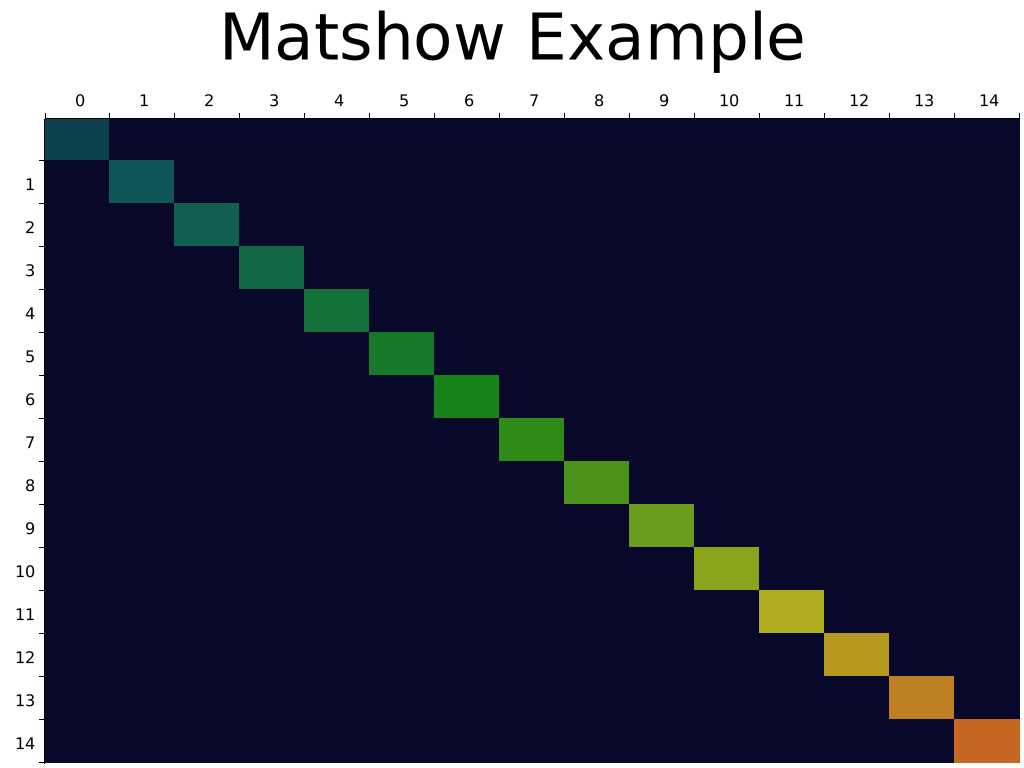
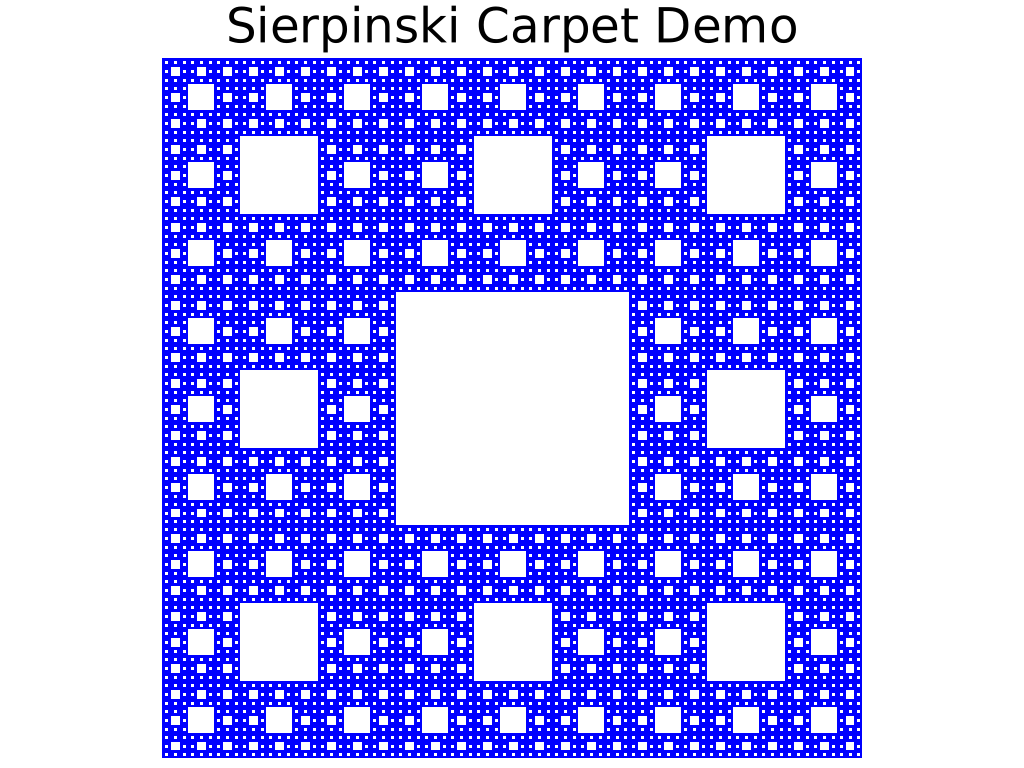
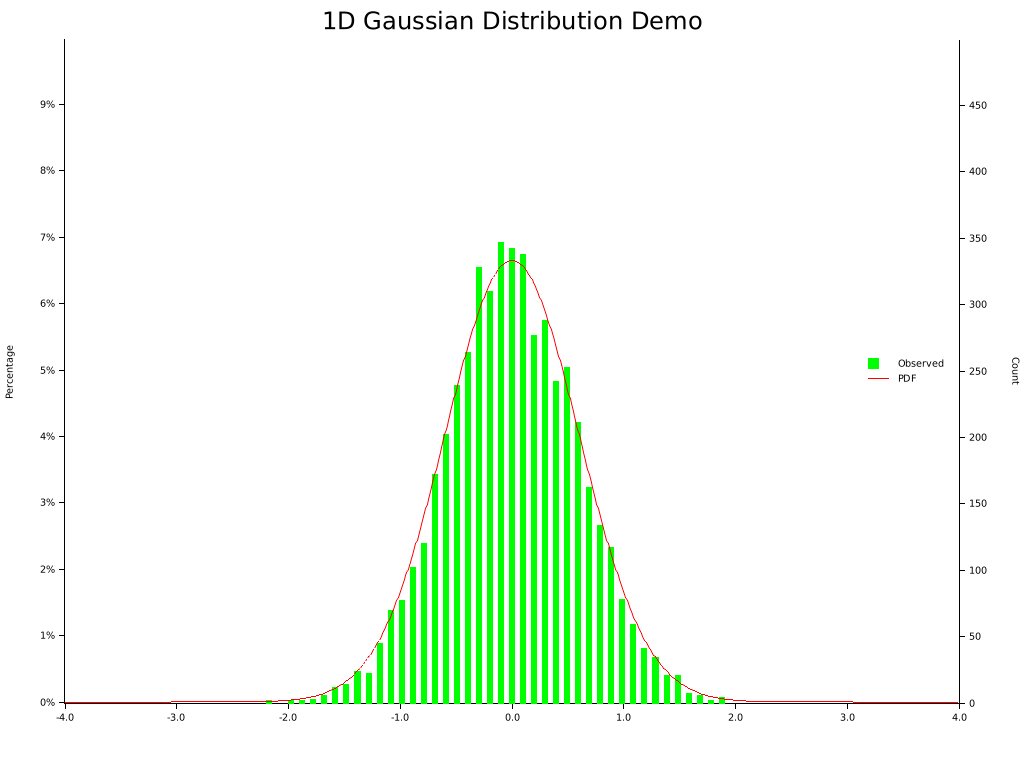
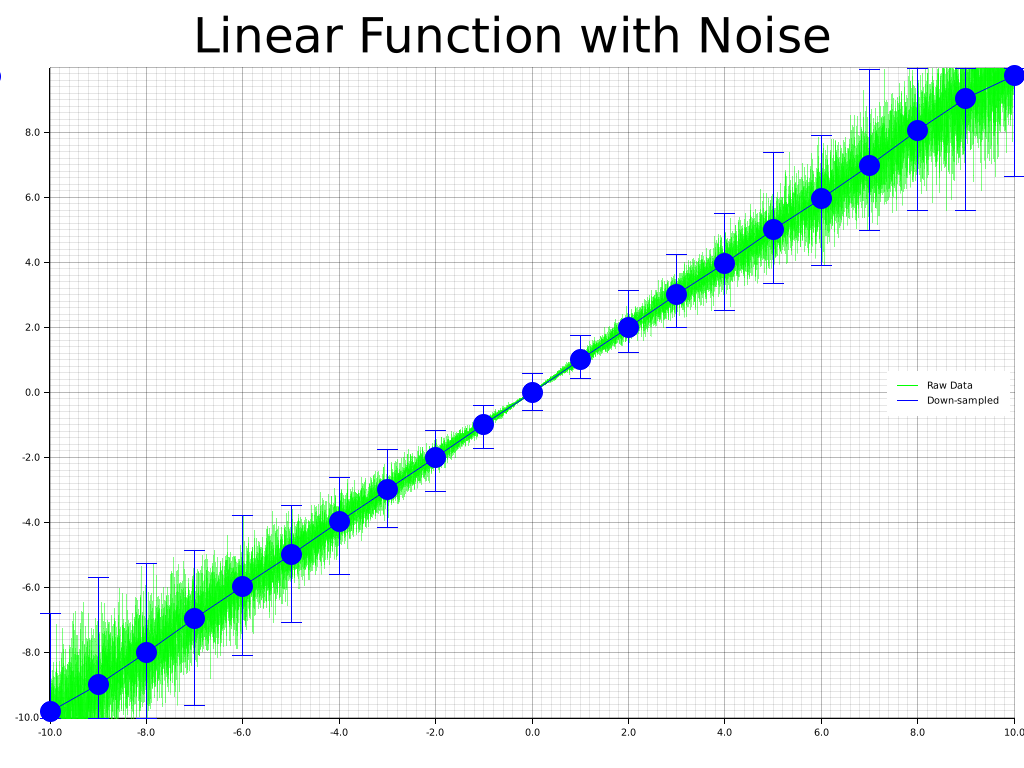
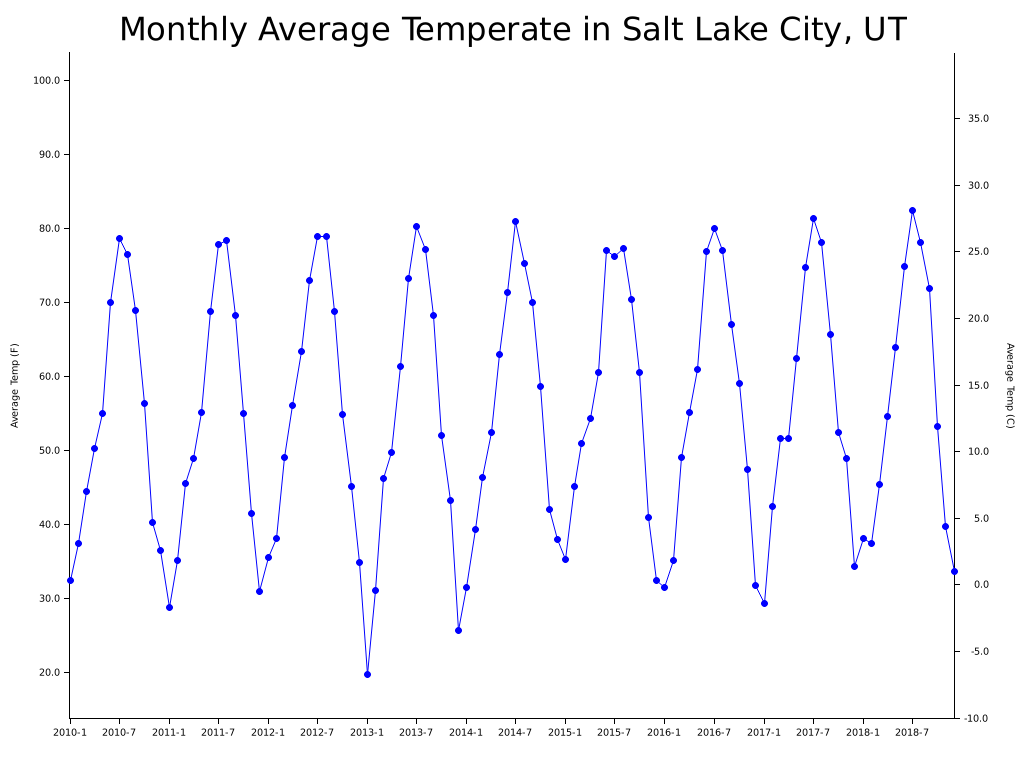
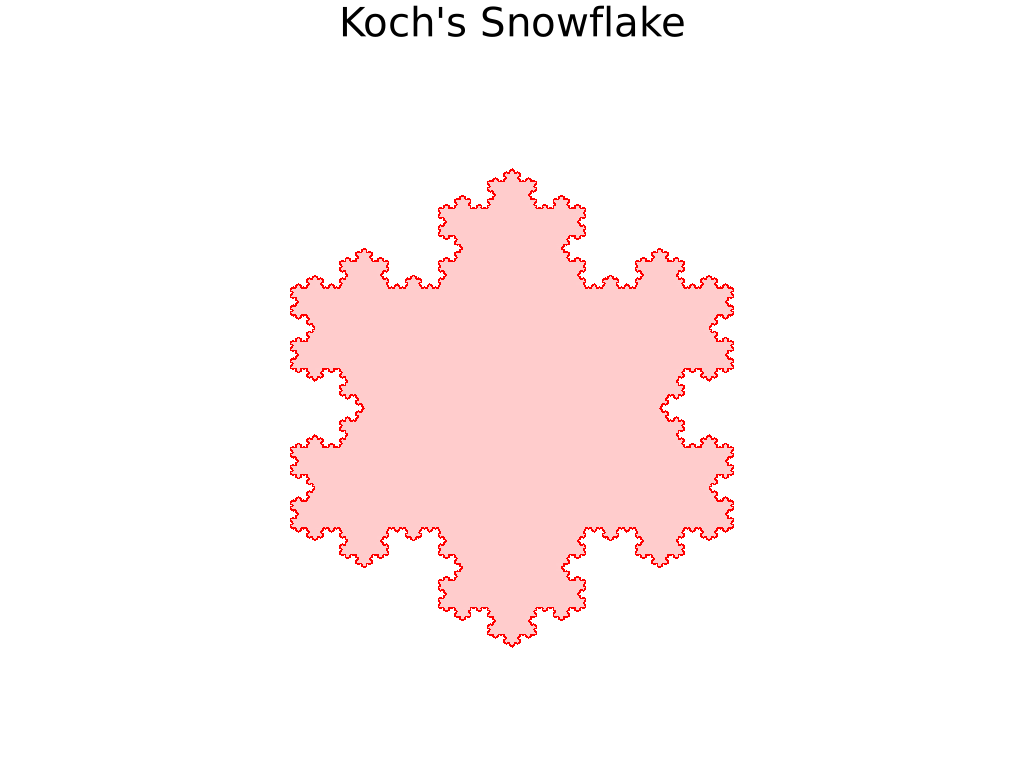
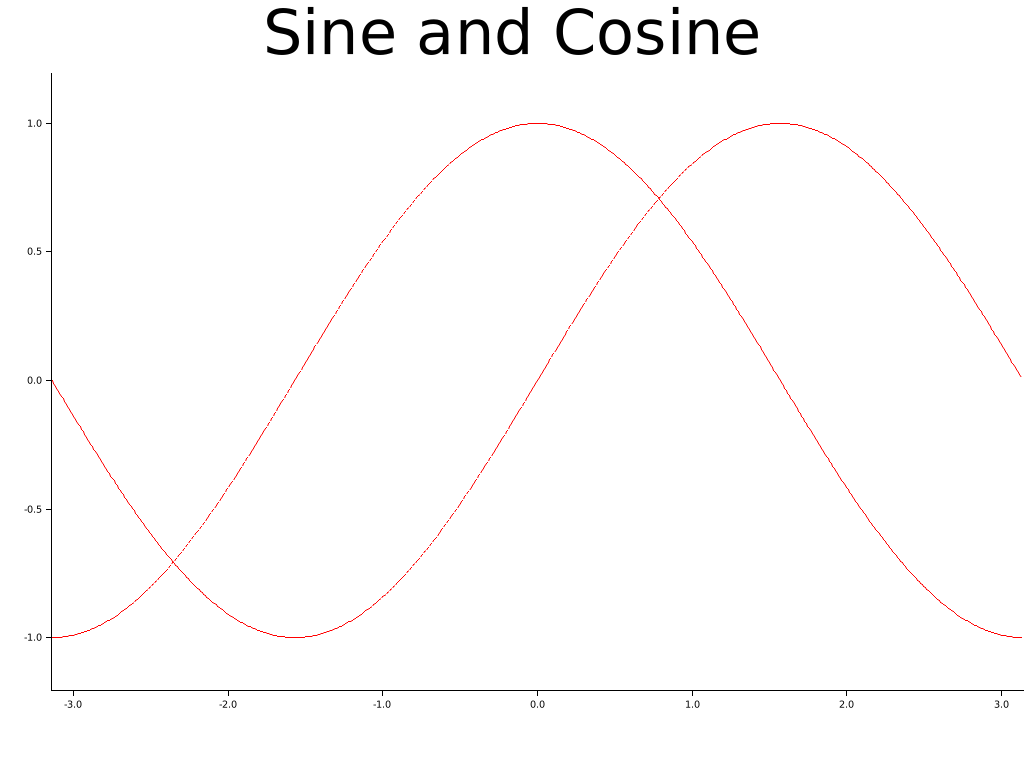
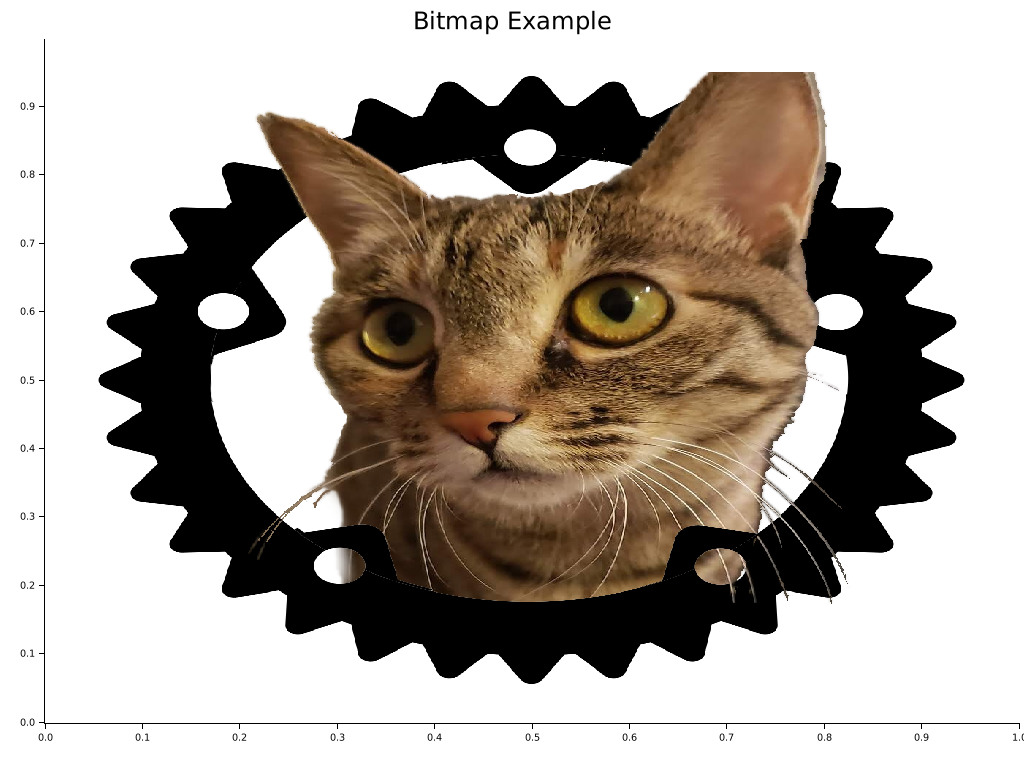
Gallery

To view the source code for each example, please click on the example image.

Table of Contents

Dependencies

Ubuntu Linux

sudo apt install pkg-config libfreetype6-dev libfontconfig1-dev

Fedora Linux

sudo dnf install pkgconf freetype-devel fontconfig-devel

Quick Start

To use Plotters, you can simply add Plotters into your Cargo.toml

[dependencies]
plotters = "0.3.3"

Create the subdirectory <Cargo project dir>/plotters-doc-data

And the following code draws a quadratic function. src/main.rs writes the chart to plotters-doc-data/0.png

use plotters::prelude::*;
fn main() -> Result<(), Box<dyn std::error::Error>> {
    let root = BitMapBackend::new("plotters-doc-data/0.png", (640, 480)).into_drawing_area();
    root.fill(&WHITE)?;
    let mut chart = ChartBuilder::on(&root)
        .caption("y=x^2", ("sans-serif", 50).into_font())
        .margin(5)
        .x_label_area_size(30)
        .y_label_area_size(30)
        .build_cartesian_2d(-1f32..1f32, -0.1f32..1f32)?;

    chart.configure_mesh().draw()?;

    chart
        .draw_series(LineSeries::new(
            (-50..=50).map(|x| x as f32 / 50.0).map(|x| (x, x * x)),
            &RED,
        ))?
        .label("y = x^2")
        .legend(|(x, y)| PathElement::new(vec![(x, y), (x + 20, y)], &RED));

    chart
        .configure_series_labels()
        .background_style(&WHITE.mix(0.8))
        .border_style(&BLACK)
        .draw()?;

    root.present()?;

    Ok(())
}

Demo Projects

To learn how to use Plotters in different scenarios, check out the following demo projects:

Trying with Jupyter evcxr Kernel Interactively

Plotters now supports integration with evcxr and is able to interactively draw plots in Jupyter Notebook. The feature evcxr should be enabled when including Plotters to Jupyter Notebook.

The following code shows a minimal example of this.

:dep plotters = { version = "^0.3.6", default-features = false, features = ["evcxr", "all_series", "all_elements"] }
extern crate plotters;
use plotters::prelude::*;

let figure = evcxr_figure((640, 480), |root| {
    root.fill(&WHITE)?;
    let mut chart = ChartBuilder::on(&root)
        .caption("y=x^2", ("Arial", 50).into_font())
        .margin(5)
        .x_label_area_size(30)
        .y_label_area_size(30)
        .build_cartesian_2d(-1f32..1f32, -0.1f32..1f32)?;

    chart.configure_mesh().draw()?;

    chart.draw_series(LineSeries::new(
        (-50..=50).map(|x| x as f32 / 50.0).map(|x| (x, x * x)),
        &RED,
    )).unwrap()
        .label("y = x^2")
        .legend(|(x,y)| PathElement::new(vec![(x,y), (x + 20,y)], &RED));

    chart.configure_series_labels()
        .background_style(&WHITE.mix(0.8))
        .border_style(&BLACK)
        .draw()?;
    Ok(())
});
figure

Interactive Tutorial with Jupyter Notebook

This tutorial is a work in progress and isn't complete

Thanks to the evcxr, now we have an interactive tutorial for Plotters! To use the interactive notebook, you must have Jupyter and evcxr installed on your computer. Follow the instruction on this page below to install it.

After that, you should be able to start your Jupyter server locally and load the tutorial!

git clone https://github.com/38/plotters-doc-data
cd plotters-doc-data
jupyter notebook

And select the notebook called evcxr-jupyter-integration.ipynb.

Also, there's a static HTML version of this notebook available at this location

Plotting in Rust

Rust is a perfect language for data visualization. Although there are many mature visualization libraries in many different languages, Rust is one of the best languages that fits the need.

  • Easy to use Rust has a very good iterator system built into the standard library. With the help of iterators, plotting in Rust can be as easy as most of the high-level programming languages. The Rust based plotting library can be very easy to use.

  • Fast If you need to render a figure with trillions of data points, Rust is a good choice. Rust's performance allows you to combine the data processing step and rendering step into a single application. When plotting in high-level programming languages, e.g. Javascript or Python, data points must be down-sampled before feeding into the plotting program because of the performance considerations. Rust is fast enough to do the data processing and visualization within a single program. You can also integrate the figure rendering code into your application to handle a huge amount of data and visualize it in real-time.

  • WebAssembly Support Rust is one of the languages with the best WASM support. Plotting in Rust could be very useful for visualization on a web page and would have a huge performance improvement comparing to Javascript.

Plotting on HTML5 canvas with WASM Backend

Plotters currently supports a backend that uses the HTML5 canvas. To use WASM, you can simply use CanvasBackend instead of other backend and all other API remains the same!

There's a small demo for Plotters + WASM available at here. To play with the deployed version, follow this link.

What types of figure are supported?

Plotters is not limited to any specific type of figure. You can create your own types of figures easily with the Plotters API.

Plotters does provide some built-in figure types for convenience. Currently, we support line series, point series, candlestick series, and histogram. And the library is designed to be able to render multiple figure into a single image. But Plotter is aimed to be a platform that is fully extendable to support any other types of figure.

Concepts by example

Drawing Backends

Plotters can use different drawing backends, including SVG, BitMap, and even real-time rendering. For example, a bitmap drawing backend.

use plotters::prelude::*;
fn main() -> Result<(), Box<dyn std::error::Error>> {
    // Create a 800*600 bitmap and start drawing
    let mut backend = BitMapBackend::new("plotters-doc-data/1.png", (300, 200));
    // And if we want SVG backend
    // let backend = SVGBackend::new("output.svg", (800, 600));
    backend.draw_rect((50, 50), (200, 150), &RED, true)?;
    backend.present()?;
    Ok(())
}

Drawing Area

Plotters uses a concept called drawing area for layout purpose. Plotters supports integrating multiple figures into a single image. This is done by creating sub-drawing-areas.

Besides that, the drawing area also allows for a customized coordinate system, by doing so, the coordinate mapping is done by the drawing area automatically.

use plotters::prelude::*;
fn main() -> Result<(), Box<dyn std::error::Error>> {
    let root_drawing_area =
        BitMapBackend::new("plotters-doc-data/2.png", (300, 200)).into_drawing_area();
    // And we can split the drawing area into 3x3 grid
    let child_drawing_areas = root_drawing_area.split_evenly((3, 3));
    // Then we fill the drawing area with different color
    for (area, color) in child_drawing_areas.into_iter().zip(0..) {
        area.fill(&Palette99::pick(color))?;
    }
    root_drawing_area.present()?;
    Ok(())
}

Elements

In Plotters, elements are the building blocks of figures. All elements are able to be drawn on a drawing area. There are different types of built-in elements, like lines, texts, circles, etc. You can also define your own element in the application code.

You may also combine existing elements to build a complex element.

To learn more about the element system, please read the element module documentation.

use plotters::prelude::*;
fn main() -> Result<(), Box<dyn std::error::Error>> {
    let root = BitMapBackend::new("plotters-doc-data/3.png", (300, 200)).into_drawing_area();
    root.fill(&WHITE)?;
    // Draw an circle on the drawing area
    root.draw(&Circle::new(
        (100, 100),
        50,
        Into::<ShapeStyle>::into(&GREEN).filled(),
    ))?;
    root.present()?;
    Ok(())
}

Composable Elements

Besides the built-in elements, elements can be composed into a logical group we called composed elements. When composing new elements, the upper-left corner is given in the target coordinate, and a new pixel-based coordinate which has the upper-left corner defined as (0,0) is used for further element composition.

For example, we can have an element which includes a dot and its coordinate.

use plotters::prelude::*;
use plotters::coord::types::RangedCoordf32;

fn main() -> Result<(), Box<dyn std::error::Error>> {
    let root = BitMapBackend::new("plotters-doc-data/4.png", (640, 480)).into_drawing_area();

    root.fill(&RGBColor(240, 200, 200))?;

    let root = root.apply_coord_spec(Cartesian2d::<RangedCoordf32, RangedCoordf32>::new(
        0f32..1f32,
        0f32..1f32,
        (0..640, 0..480),
    ));

    let dot_and_label = |x: f32, y: f32| {
        return EmptyElement::at((x, y))
            + Circle::new((0, 0), 3, ShapeStyle::from(&BLACK).filled())
            + Text::new(
                format!("({:.2},{:.2})", x, y),
                (10, 0),
                ("sans-serif", 15.0).into_font(),
            );
    };

    root.draw(&dot_and_label(0.5, 0.6))?;
    root.draw(&dot_and_label(0.25, 0.33))?;
    root.draw(&dot_and_label(0.8, 0.8))?;
    root.present()?;
    Ok(())
}

Chart Context

In order to draw a chart, Plotters needs a data object built on top of the drawing area called ChartContext. The chart context defines even higher level constructs compare to the drawing area. For example, you can define the label areas, meshes, and put a data series onto the drawing area with the help of the chart context object.

use plotters::prelude::*;
fn main() -> Result<(), Box<dyn std::error::Error>> {
    let root = BitMapBackend::new("plotters-doc-data/5.png", (640, 480)).into_drawing_area();
    root.fill(&WHITE);
    let root = root.margin(10, 10, 10, 10);
    // After this point, we should be able to construct a chart context
    let mut chart = ChartBuilder::on(&root)
        // Set the caption of the chart
        .caption("This is our first plot", ("sans-serif", 40).into_font())
        // Set the size of the label region
        .x_label_area_size(20)
        .y_label_area_size(40)
        // Finally attach a coordinate on the drawing area and make a chart context
        .build_cartesian_2d(0f32..10f32, 0f32..10f32)?;

    // Then we can draw a mesh
    chart
        .configure_mesh()
        // We can customize the maximum number of labels allowed for each axis
        .x_labels(5)
        .y_labels(5)
        // We can also change the format of the label text
        .y_label_formatter(&|x| format!("{:.3}", x))
        .draw()?;

    // And we can draw something in the drawing area
    chart.draw_series(LineSeries::new(
        vec![(0.0, 0.0), (5.0, 5.0), (8.0, 7.0)],
        &RED,
    ))?;
    // Similarly, we can draw point series
    chart.draw_series(PointSeries::of_element(
        vec![(0.0, 0.0), (5.0, 5.0), (8.0, 7.0)],
        5,
        &RED,
        &|c, s, st| {
            return EmptyElement::at(c)    // We want to construct a composed element on-the-fly
            + Circle::new((0,0),s,st.filled()) // At this point, the new pixel coordinate is established
            + Text::new(format!("{:?}", c), (10, 0), ("sans-serif", 10).into_font());
        },
    ))?;
    root.present()?;
    Ok(())
}

Misc

Development Version

Find the latest development version of Plotters on GitHub. Clone the repository and learn more about the Plotters API and ways to contribute. Your help is needed!

If you want to add the development version of Plotters to your project, add the following to your Cargo.toml:

[dependencies]
plotters = { git = "https://github.com/plotters-rs/plotters.git" }

Reducing Depending Libraries && Turning Off Backends

Plotters now supports use features to control the backend dependencies. By default, BitMapBackend and SVGBackend are supported, use default-features = false in the dependency description in Cargo.toml and you can cherry-pick the backend implementations.

  • svg Enable the SVGBackend
  • bitmap Enable the BitMapBackend

For example, the following dependency description would avoid compiling with bitmap support:

[dependencies]
plotters = { git = "https://github.com/plotters-rs/plotters.git", default-features = false, features = ["svg"] }

The library also allows consumers to make use of the Palette crate's color types by default. This behavior can also be turned off by setting default-features = false.

List of Features

This is the full list of features that is defined by Plotters crate. Use default-features = false to disable those default enabled features, and then you should be able to cherry-pick what features you want to include into Plotters crate. By doing so, you can minimize the number of dependencies down to only itertools and compile time is less than 6s.

The following list is a complete list of features that can be opted in or out.

  • Tier 1 drawing backends
Name Description Additional Dependency Default?
bitmap_encoder Allow BitMapBackend to save the result to bitmap files image, rusttype, font-kit Yes
svg_backend Enable SVGBackend Support None Yes
bitmap_gif Opt-in GIF animation Rendering support for BitMapBackend, implies bitmap enabled gif Yes
  • Font manipulation features
Name Description Additional Dependency Default?
ttf Allows TrueType font support font-kit Yes
ab_glyph Skips loading system fonts, unlike ttf ab_glyph No

ab_glyph supports TrueType and OpenType fonts, but does not attempt to load fonts provided by the system on which it is running. It is pure Rust, and easier to cross compile. To use this, you must call plotters::style::register_font before using any plotters functions which require the ability to render text. This function only exists when the ab_glyph feature is enabled.

/// Register a font in the fonts table.
///
/// The `name` parameter gives the name this font shall be referred to
/// in the other APIs, like `"sans-serif"`.
///
/// Unprovided font styles for a given name will fallback to `FontStyle::Normal`
/// if that is available for that name, when other functions lookup fonts which
/// are registered with this function.
///
/// The `bytes` parameter should be the complete contents
/// of an OpenType font file, like:
/// ```ignore
/// include_bytes!("FiraGO-Regular.otf")
/// ```
pub fn register_font(
    name: &str,
    style: FontStyle,
    bytes: &'static [u8],
) -> Result<(), InvalidFont>
  • Coordinate features
Name Description Additional Dependency Default?
datetime Enable the date and time coordinate support chrono Yes
  • Element, series and util functions
Name Description Additional Dependency Default?
errorbar The errorbar element support None Yes
candlestick The candlestick element support None Yes
boxplot The boxplot element support None Yes
area_series The area series support None Yes
line_series The line series support None Yes
histogram The histogram series support None Yes
point_series The point series support None Yes
  • Misc
Name Description Additional Dependency Default?
deprecated_items This feature allows use of deprecated items which is going to be removed in the future None Yes
debug Enable the code used for debugging None No

FAQ List

  • Why does the WASM example break on my machine ?

    The WASM example requires using wasm32 target to build. Using cargo build is likely to use the default target which in most of the case is any of the x86 target. Thus you need add --target=wasm32-unknown-unknown in the cargo parameter list to build it.

  • How to draw text/circle/point/rectangle/... on the top of chart ?

    As you may have realized, Plotters is a drawing library rather than a traditional data plotting library, you have the freedom to draw anything you want on the drawing area. Use DrawingArea::draw to draw any element on the drawing area.

  • Where can I find the backend code ?

    Since Plotters 0.3, all drawing backends are independent crate from the main Plotters crate. Use the following link to find the backend code:

  • How to check if a backend writes to a file successfully ?

    The behavior of Plotters backend is consistent with the standard library. When the backend instance is dropped, [crate::drawing::DrawingArea::present()] or Backend::present() is called automatically whenever is needed. When the present() method is called from drop, any error will be silently ignored.

    In the case that error handling is important, you need manually call the present() method before the backend gets dropped. For more information, please see the examples.

plotters's People

Contributors

38 avatar aaronerhardt avatar be-ing avatar berrysoft avatar chrisduerr avatar darakian avatar dependabot-preview[bot] avatar dependabot[bot] avatar el-hult avatar elpiel avatar elwerene avatar facorread avatar feng23 avatar gyulyvgc avatar ijackson avatar jonaspleyer avatar kmolyuan avatar lisanhu avatar martinfrances107 avatar monadic-cat avatar novedevo avatar nuald avatar oswald2 avatar ralfbiedert avatar serzhiio avatar shinmili avatar siefkenj avatar tatrix avatar veykril avatar xemwebe avatar

Stargazers

 avatar  avatar  avatar  avatar  avatar  avatar  avatar  avatar  avatar  avatar  avatar  avatar  avatar  avatar  avatar  avatar  avatar  avatar  avatar  avatar  avatar  avatar  avatar  avatar  avatar  avatar  avatar  avatar  avatar  avatar  avatar  avatar  avatar  avatar  avatar  avatar  avatar  avatar  avatar  avatar  avatar  avatar  avatar  avatar  avatar  avatar  avatar  avatar  avatar  avatar  avatar  avatar  avatar  avatar  avatar  avatar  avatar  avatar  avatar  avatar  avatar  avatar  avatar  avatar  avatar  avatar  avatar  avatar  avatar  avatar  avatar  avatar  avatar  avatar  avatar  avatar  avatar  avatar  avatar  avatar  avatar  avatar  avatar  avatar  avatar  avatar  avatar  avatar  avatar  avatar  avatar  avatar  avatar  avatar  avatar  avatar  avatar  avatar  avatar  avatar

Watchers

 avatar  avatar  avatar  avatar  avatar  avatar  avatar  avatar  avatar  avatar  avatar  avatar  avatar  avatar  avatar  avatar  avatar  avatar  avatar  avatar  avatar  avatar  avatar  avatar  avatar  avatar  avatar  avatar  avatar  avatar  avatar  avatar  avatar  avatar  avatar  avatar  avatar  avatar  avatar  avatar

plotters's Issues

[Feature Request] Different styles for x/y labels

We have one method
pub fn label_style<T: Into<TextStyle<'b>>>(&mut self, style: T) -> &mut Self
to change styles of both x/y labels.

Would be nice to have ability to change styles independently.

[Cargo] error: failed to run custom build command for `servo-fontconfig-sys v4.0.7`

Can't build the example, as following:

zmant@zmant-PC:~/Projects/rust_demo$ cargo build 
   Compiling servo-fontconfig-sys v4.0.7
error: failed to run custom build command for `servo-fontconfig-sys v4.0.7`
process didn't exit successfully: `/home/zmant/Projects/rust_demo/target/debug/build/servo-fontconfig-sys-ab35303d25e9c957/build-script-build` (exit code: 101)
--- stdout
cd /home/zmant/Projects/rust_demo/target/debug/build/servo-fontconfig-sys-d6a6c48eec147b8b/out && \
	CC="gcc" \
	AR="ar" \
	FREETYPE_CFLAGS="" \
	FREETYPE_LIBS="" \
	CFLAGS=""" -fPIC" \
	/home/zmant/.cargo/registry/src/code.aliyun.com-738b7dba08a2a41e/servo-fontconfig-sys-4.0.7/configure \
	--disable-docs \
	--disable-shared \
	 \
	--host=x86_64-unknown-linux-gnu --sysconfdir=/etc --localstatedir=/var
.........
checking for FT_Bitmap_Size.y_ppem... yes
checking for EXPAT... no
checking expat.h usability... no
checking expat.h presence... no
checking for expat.h... no
checking xmlparse.h usability... no
checking xmlparse.h presence... no
checking for xmlparse.h... no
makefile.cargo:83: recipe for target '/home/zmant/Projects/rust_demo/target/debug/build/servo-fontconfig-sys-d6a6c48eec147b8b/out/Makefile' failed

--- stderr
configure: error: 
*** expat is required. or try to use --enable-libxml2
make: *** [/home/zmant/Projects/rust_demo/target/debug/build/servo-fontconfig-sys-d6a6c48eec147b8b/out/Makefile] Error 1
thread 'main' panicked at 'assertion failed: Command::new("make").env("MAKEFLAGS",
                         env::var("CARGO_MAKEFLAGS").unwrap_or_default()).args(&["-R",
                                                                                 "-f",
                                                                                 "makefile.cargo"]).status().unwrap().success()', /home/zmant/.cargo/registry/src/code.aliyun.com-738b7dba08a2a41e/servo-fontconfig-sys-4.0.7/build.rs:20:5
note: Run with `RUST_BACKTRACE=1` environment variable to display a backtrace.

The dependencies:

zmant@zmant-PC:~/Projects/rust_demo$ cat Cargo.toml 
[package]
name = "rust_demo"
version = "0.1.0"
authors = ["zmant"]
edition = "2018"

[dependencies]
plotters =  "0.2"

Did I miss something๏ผŸ

Play nicely with Seed framework

Hello, I'm using seed for a frontend project, and want to use plotters to render graphs.
Seed doesn't allow direct access to the elements that it creates, so drawing to a canvas through seed doesn't work.

Right now I'm using plotlib for generating graphs. I render an svg to a buffer and convert it into a blob. Then I create an <image> that points to the blob. This doesn't work in plotters because the svg and bitmap backends are completely disabled for wasm.

The easiest fix is to simply allow the in memory targets for the svg and bitmap backends in wasm and only disable the file target.

Another fix might be too create a backend specific to seed, or to have some way of accepting a canvas from seed. I think this might be a better route in the long term, but I'm not exactly sure how it would work.

[Feature Request] DrawingAreas should be threadsafe.

Background

Similar to #55. In addition, it would be nice to make use of multiple cores when rendering real time sub-graphs.

  • What is the feature ?

When doing:

let root = BitMapBackend::with_buffer(&mut texture.data, texture.dimension).into_drawing_area();
let (upper, lower) = root.split_vertically(300);

It would be nice if upper and lower could be used from separate threads to render both sub-graphs in parallel, since they should not share any overlapping area.

  • Why do you need the feature ?
  • What is the use case ?

See above, to improve multi-core utilization when doing software rendering of real time graphs.

Addition Information

Plotters should not do the multithreading itself and should remain lightweight. Instead, I as the API user want to be in charge which threading library I use, e.g., when rendering sub-graphs.

[Feature Request] Drawing area split with relative value

Ive faced with neccesity to divide drawing area using relative value to canvas size.
Lets say i want to split canvas vertically in proportion 70%/30%.
Or i want lower drawing area to be of a fixed height(200px) but canvas size is dynamically adjusted.
Any advice?

Error?

I'm having error on this:

        price_chart
            .draw_series(PointSeries::new(
                (0..self.timecache.len()).map(|x| (x, self.timecache[x].2)),
                1,
                &RED,
            )).unwrap();

What coudl it be?

error[E0282]: type annotations needed
   --> src\scenes\instances\components\chart\mod.rs:108:14
    |
108 |             .draw_series(PointSeries::new(
    |              ^^^^^^^^^^^ cannot infer type for `E`

X Labels do not appear for large time ranges

I can't get plotters to render the x_labels for large timespans, no matter how I tweak the parameters. For short timespans it seems fine:
Screen Shot 2019-09-04 at 20 19 01

Longer timespans don't show anything:

Screen Shot 2019-09-04 at 20 20 56

The code I use for generating the graphs:

fn part_graph_view(part: &Part) -> Result<Node<Msg>, Box<dyn std::error::Error>> {
    use plotters::prelude::*;

    let mut buffer = Vec::new();
    {
        let svg = SVGBackend::with_buffer(&mut buffer, (480, 320));
        let root = svg.into_drawing_area();
        root.fill(&WHITE).unwrap();

        let beginning = Utc.from_utc_date(&part.defined);
        let today = Utc::today();
        let (_qty, max_qty, quantities, counts) = part.entries.iter().fold(
            (0_u64, 0_u64, Vec::new(), Vec::new()),
            |(qty, max_qty, mut quantities, mut counts), entry| {
                let qty = match &entry.directive {
                    Directive::Add(d) => {
                        let qty = qty.saturating_add(d.amount);
                        quantities.push((Utc.from_utc_date(&entry.date), qty));
                        qty
                    }
                    Directive::Take(d) => {
                        let qty = qty.saturating_sub(d.amount);
                        quantities.push((Utc.from_utc_date(&entry.date), qty));
                        qty
                    }
                    Directive::Count(d) => {
                        counts.push((Utc.from_utc_date(&entry.date), d.amount));
                        qty
                    }
                    _ => qty,
                };
                (qty, max_qty.max(qty), quantities, counts)
            },
        );

        let mut chart = ChartBuilder::on(&root)
            .caption(part.part_number, ("Arial", 20).into_font())
            .margin(30)
            .x_label_area_size(20)
            .y_label_area_size(20)
            .build_ranged(beginning..today, 0..max_qty)?;

        // TODO: report errors
        chart
            .configure_mesh()
            .label_style(("Arial", 5).into_font())
            .x_label_formatter(&|date| date.format("--%m-%d").to_string())
            .draw()?;

        chart.draw_series(LineSeries::new(quantities, &RED))?;
        chart.draw_series(PointSeries::of_element(
            counts,
            1,
            ShapeStyle::from(&GREEN).filled(),
            &|coord, size, style| {
                EmptyElement::at(coord)
                    + Circle::new((0, 0), size, style)
                    + Text::new(
                        format!("{}, {}", coord.0.naive_utc(), coord.1),
                        (0, -5),
                        ("Arial", 5).into_font(),
                    )
            },
        ))?;
    }

    let svg_text = std::str::from_utf8(&buffer)?;
    Ok(div![El::from_html(svg_text)])
}

This code sample isn't really a minimum code sample reproducing the error. I plan on making one soon.

[BUG] 'static lifetime requirement for AreaSeries

Describe the bug
When using AreaSeries the backend is required to be 'static, e.g. BitmapBackend<'static>. This has a number of limitations, the simplest of which is that a filename passed to the backend must have a static lifetime. This is not the case with other series such as LineSeries. It seems AreaSeries takes a reference to the backend while others do not.

To Reproduce
I modified the area chart example from:

let root = BitMapBackend::new("plotters-doc-data/area-chart.png", (1024, 768)).into_drawing_area();

to:

let filename = "plotters-doc-data/area-chart.png".to_string();
let root = BitMapBackend::new(&filename, (1024, 768)).into_drawing_area();

After doing this the example would no longer compile. This reproduces my problem exactly.

Version Information
Both master and 0.2.9.

x_labels(0) creates one point

In this example, if I change x_labels(5) to x_labels(0), the labels don't go away. The latter is basically equivalent to x_labels(1). I want to be able to remove the labels to achieve something like this and this.

wasm-demo is broken

The wasm-demo does not currently build.

error[E0433]: failed to resolve: use of undeclared type or module `CanvasBackend`
 --> src/func_plot.rs:8:19
  |
8 |     let backend = CanvasBackend::new(element).unwrap();
  |                   ^^^^^^^^^^^^^ use of undeclared type or module `CanvasBackend`

error[E0433]: failed to resolve: use of undeclared type or module `CanvasBackend`
  --> src/mandelbrot.rs:33:19
   |
33 |     let backend = CanvasBackend::new(element).unwrap();
   |                   ^^^^^^^^^^^^^ use of undeclared type or module `CanvasBackend`

error: aborting due to 2 previous errors

For more information about this error, try `rustc --explain E0433`.
error: Could not compile `wasm-demo`.

To learn more, run the command again with --verbose.

[Feature Request] Should have benchmarks

  • What is the feature ?

After working on #56 and #54 I think it would be nice to have some some reference benchmarks to measure if certain changes actually improve or degrade performance, esp. when iterating the CPU-only BitMapBackend.

  • Why do you need the feature ?
  • What is the use case ?

See above.

[Feature Request] Formalize the Console Backend

  • What is the feature ?

Now we just demonstrated it's possible draw plots on console without actually changing the API in this example.

But it seems we still needs to tweak something and make it a built-in backend.

  • Why do you need the feature ?

Plotting in console may be very interesting for someone who use SSH which doesn't have a easy to access the image.

  • What is the use case ? See above

[BUG] Investigate the performance overhead of result types

See discussion under #56 for detials

Just realized a different thing, I tried your benchmark with a CPU profiler.
The result is so shocking: 25% of the time is spend to handle the Result types.
I try to remove one question mark from the rasterizer, it turns out a 10% speed up.

--

Local repo:

test sine_640_480                                  ... bench:   4,188,667 ns/iter (+/- 338,945)
test sine_640_480_2_horizontal_subgraphs_draw_both ... bench:   4,609,418 ns/iter (+/- 407,366)
test sine_640_480_2_horizontal_subgraphs_draw_one  ... bench:   2,298,113 ns/iter (+/- 461,527)
test sine_640_480_2_horizontal_subgraphs_fake_blit ... bench:     270,355 ns/iter (+/- 53,794)

0.2.8:

test sine_640_480                                  ... bench:   7,277,665 ns/iter (+/- 3,636,985)
test sine_640_480_2_horizontal_subgraphs_draw_both ... bench:   8,129,140 ns/iter (+/- 937,515)
test sine_640_480_2_horizontal_subgraphs_draw_one  ... bench:   4,303,821 ns/iter (+/- 255,423)
test sine_640_480_2_horizontal_subgraphs_fake_blit ... bench:     288,119 ns/iter (+/- 102,912)

--

Update, I refactored two question mark to is_err it turns out 50% speed up.

image

Not stable axis labels amount

I noticed that in some cases (when chart is pretty small), lets say secondary coord with relative height 0.15 of main area height, there is situation when no labels are showing up even if there is range of only 0.0...0.1 and we have only 2 (and more) different values (0.05, 0.1). When we have only 1 value its showing correctly, if more nothing...
.y_labels(5/10)

How to get pixel coord from Guest coordinate?

Lets say i have chart with given coordinate system.
I need to draw a dotted (horizontal) line through whole chart using one y-coord.
And i want every dot to be 5px length.
What is most efficient way?

Request for one or two more examples of how to use in jupyter

This is a great resource. Thank you. Being new to Rust, I was looking forward to playing with the language in jupyter. This lib provides a key ingredient. This said, I was trying to parse through the example code to draw different charts to no avail. Do you think you could provide another example or two for me to use to figure out how to use the lib in jupyter? To be clear, the example you provide, works as promised. Thank you in advance. - E

Add palette color support

I just thought it might be of interest to start a discussion about this. I noticed this crate uses it's own simplistic color definitions, so to my mind came the possibility of using the palette crate which would allow users to define and use colors in a very great spectrum.

[Feature Request] Improve wasm demo

I'd like to improve wasm demo a bit. In particular I'd like to move all inline styles to already existing css file, extract js code to a separate file, use es6+ in js code, replace setTimeout with requestAnimationFrame and thus remove double buffering example.

Also I'd like to make a realtime rendered demo.
If you think this sounds good, I can start working on that ;)

[BUG] OSX doesn't support generic font family

Describe the bug
On OSX, using generic font family settings such as "serif" will result an error FontNotFound

To Reproduce

   area.draw_text("Hello",  "serif".into_font())

Version Information
Latest master

Font style?

How to set:

  1. General font style and font-size?
  2. Custom font-size for axis labels?

[Feature Request] Different Pixel Format for BitMapBackend?

  • What is the feature ?
    We should support different pixel format for bitmap backend.

  • Why do you need the feature ?

If we want to use Plotters to manipulate a framebuffer, the most commonly used frame buffer pixel format is BGRX. Currently we have to draw the RGB buffer and convert the pixel format.

  • What is the use case ?

See above

  • Additional Information

#66 This PR is actually trying to address this. But we definitely should have some more clean and nice way to do this inplace

Running examples on Windows

Great work with the library. I was trying to run the examples on my Windows machine.
chart.exe is generated by running cargo run --example chart but I get the following error on running that exe:
Error: BackendError(DrawingError(IoError(Os { code: 3, kind: NotFound, message: "The system cannot find the path specified." })))

Also, running the webassembly demo locally does not work. It is not able to load pkg/wasm-demo.js.

[Feature Request] Add more control to histograms

What is the feature ?

Ability to control color of individual bars in the histogram.

Why do you need the feature / What is the use case ?

Take a look at this plot:
2019-10-30-154312_1228x626_scrot
It shows daily data. I'd like to color 6th and 7th bars with different color, so it would be easy to see weekends.

Then it would be also nice to have a better control over ticks placement. For instance I'd like to put ticks every 7 bars to highlight full weeks.

Drawing very big vectors

Lets say i have one very big data vector with stable items array:
[[datetime, price1, price2, price3],[...][...],...]
To draw 3 lines with prices:1,2,3 i should iterate over vector 3 times to crate 3 vectors with [datetime,price1],[datetime,price2],[datetime,price3]
Would it be more efficient to give a ref on a main vector to plotters and then set 3 accessors funcs to let plotters now how to pull out particular [x;y] for specified chart type;

It could looks like:

type DataVectorItem = (datetime_type,price_type,price_type,price_type);
ChartBuilder::on(root)
    .data(&vector)
    .build_ranged(time_start..time_end, min..max).unwrap();
        chart
            .draw_series(LineSeries::new(
                |data_item:&DataVectorItem| => (x,y) { (data_item.0,data_item.3) }, // accessor func
                &RGBColor(45,140,220).mix(0.9),
            )).unwrap();

What you say?

Stroke Width Support for circle

Now the default rasterizer supports stroke width for almost all the operations.

But circle is the last one that ignores the stroke width property.

We should resolve this.

Support linspace and interval wrapper for datetime and float

Noticed that i cant draw Histogram with timeseries.

error[E0277]: the trait bound `plotters::coord::datetime::RangedDateTime<chrono::offset::utc::Utc>: plotters::coord::ranged::DescreteRanged` is not satisfied
   --> src\common\chart\mod.rs:189:24
    |
189 |         let buy_vols = Histogram::vertical(&vols_chart)
    |                        ^^^^^^^^^^^^^^^^^^^ the trait `plotters::coord::ranged::DescreteRanged` is not implemented for `plotters::coord::datetime::RangedDateTime<chrono::offset::utc::Utc>`

Logarithmic scale for axis

First of all, I would like to say thank you for such an amazing library! I really like your approach. Hope it will evolve to be a de-facto standard for Rust graphics.

The question is: how am I supposed to configure plotter to draw in an logarithmic scale? I am particularly interested in a logarithmic histograms.

Make canvas backend accept the canvas object directly

Currently canvas backend only supports taking canvas by Id.

But for both seed support described in issue #16 and dual buffer rendering, it should be better to have canavs backend taking the canvas javascript object directly.

Refactor the DiscreteRanged trait

Background

Now the discrete range trait doesn't seem clean because of the following issue:

  • No bound check, the next_value and previous_value requires always returns a value
  • Unknown number of distinct values
  • Linspace coord should be a discrete range, however this can't be used in Histogram since the hash table requires Equal trait but f64 doesn't impl the trait.

However, all the discrete range is equivalent to a integer range, thus we doesn't actually need put any restriction on the traits for the actual values. (Later we may use an array as an discrete coordinate and lifting the trait bound will make this possible)

Drawbacks

In order to know the number of values and handle the bound correctly, we have to make most of the RangeParam not an unit type, and this will makes Histogram::new unsable to applied to most of the coord types. Thus this should be considered as an breaking change.

[Feature Request] Nested coordinate

What is the feature ?

Nested coordinate, which means it's a discrete coordinate but for each value, it attached another nested coordinate system on that.

(Optional) Why this feature is useful and how people would use the feature ?

While I make the PR for criterion, this idea comes out. Check out the following example for details:

image

Each of the tick mark has a nested coordinate system ranged from -1.0 to +1.0

(Optional) Additional Information

Blockers: This would be blocked by this issue #80 . Unless we have a reasonable abstraction on discrete coordinate, this is tricky to accomplish.

Compilation error in wasm demo code

Hi, Thanks for updating the example. I tried it on my PC and get the following compilation error:

error[E0277]: `*mut u8` cannot be shared between threads safely
  --> c:\Localdata\extra\rust\38_plotters\src\drawing\backend_impl\canvas.rs:62:6
   |
62 | impl DrawingBackend for CanvasBackend {
   |      ^^^^^^^^^^^^^^ `*mut u8` cannot be shared between threads safely

Add support for setting stroke width

Hello! This is a fantastic crate.

Currently, it seems like it's not possible to configure the stroke width in plotters (this comment suggests as much).

This is a fairly straightforward feature to add to the vector back-ends and I'd be happy to submit a pull request implementing it for piston, svg, and canvas once the API is figured out.

[Feature Request] AreaSeries with different styles for above baseline and below baseline

  • What is the feature ?

Currently, AreaSeries colors the area from Path/LineSeries to baseline. This is done with Polygon. It would be nice to have two different colors for areas above and below.

  • Why do you need the feature ?

This makes some graphs much nicer to read.

  • What is the use case ?

Market microstructure visualization

Screenshot from 2019-10-29 15-55-25

  • Additional Information

Color buy volume GREEN.mix(0.1) and sell volume RED.mix(0.1)

piston-demo is broken

The piston demo builds, but panics immediately

aaron-mini:piston-demo aholtzma$ RUST_BACKTRACE=1 ./target/release/piston-demo
thread 'main' panicked at 'called `Result::unwrap()` on an `Err` value: Custom { kind: Other, error: StringError("Not supported") }', src/libcore/result.rs:999:5
stack backtrace:
   0: std::sys::unix::backtrace::tracing::imp::unwind_backtrace
   1: std::sys_common::backtrace::_print
   2: std::panicking::default_hook::{{closure}}
   3: std::panicking::default_hook
   4: std::panicking::rust_panic_with_hook
   5: std::panicking::continue_panic_fmt
   6: rust_begin_unwind
   7: core::panicking::panic_fmt
   8: core::result::unwrap_failed
   9: <alloc::vec::Vec<T> as alloc::vec::SpecExtend<T,I>>::from_iter
  10: piston_demo::main
  11: std::rt::lang_start::{{closure}}
  12: std::panicking::try::do_call
  13: __rust_maybe_catch_panic
  14: std::rt::lang_start_internal
  15: main

This is running on MacOS Mojave.

Make font loading more robust

When building the font name database, plotters is extremely sensitive to fonts that it cannot load. Plotters bails with "Error: BackendError(FontError(FontLoadError(UnrecognizedFormat)))" even if the font that I'm actually requesting is already loaded.

In my current case and on a system I don't control, there's an OTF formatted font installed in a system directory that breaks plotters for me. If I run it at my local system and temporarily remove the font in question, plotters works fine.

I was expecting that plotters would just skip loading "unloadable" fonts in the look-up table, instead it panics with the above error. Skipping would at least allow plotters to work with the fonts that are actually loadable.

wasm-example sample code doesn't work

This looks like an awesome crate, thanks for creating it! I've copied the wasm-example code verbatim into a repository of my own but am getting a module error in the start_plotting method.

failed to resolve: use of undeclared type or module `CanvasBackend`

use of undeclared type or module `CanvasBackend`rustc(E0433)
lib.rs(8, 17): use of undeclared type or module `CanvasBackend

image

Any ideas what to do here? I'm pretty new to Rust so sorry if I'm missing something obvious.

[Feature Request] Reduce allocation, reuse backbuffer, improve speed

Background

I am using plotters together with minifb to visualize real time sensor data. The combination is awesome, since both libraries are very lightweight, and it's easy to do portable, real-time UIs.

One implication is that all rendering is purely SW; plotters writes into a byte array, which minifb uses to update the frame buffer.

Unfortunately, in that process as of today, data has to be copied around multiple times for no reason other than plumbing, which costs precious CPU cycles.

Feature Request

  • What is the feature ?

Plotters' BitMapBackend should accept a user-provided byte buffer to render into; instead of allocating its own.

  • Why do you need the feature ?
  • What is the use case ?

See above; to reduce allocation, improve performance.

Recommend Projects

  • React photo React

    A declarative, efficient, and flexible JavaScript library for building user interfaces.

  • Vue.js photo Vue.js

    ๐Ÿ–– Vue.js is a progressive, incrementally-adoptable JavaScript framework for building UI on the web.

  • Typescript photo Typescript

    TypeScript is a superset of JavaScript that compiles to clean JavaScript output.

  • TensorFlow photo TensorFlow

    An Open Source Machine Learning Framework for Everyone

  • Django photo Django

    The Web framework for perfectionists with deadlines.

  • D3 photo D3

    Bring data to life with SVG, Canvas and HTML. ๐Ÿ“Š๐Ÿ“ˆ๐ŸŽ‰

Recommend Topics

  • javascript

    JavaScript (JS) is a lightweight interpreted programming language with first-class functions.

  • web

    Some thing interesting about web. New door for the world.

  • server

    A server is a program made to process requests and deliver data to clients.

  • Machine learning

    Machine learning is a way of modeling and interpreting data that allows a piece of software to respond intelligently.

  • Game

    Some thing interesting about game, make everyone happy.

Recommend Org

  • Facebook photo Facebook

    We are working to build community through open source technology. NB: members must have two-factor auth.

  • Microsoft photo Microsoft

    Open source projects and samples from Microsoft.

  • Google photo Google

    Google โค๏ธ Open Source for everyone.

  • D3 photo D3

    Data-Driven Documents codes.