r-spatial / mapedit Goto Github PK
View Code? Open in Web Editor NEWInteractive editing of spatial data in R
Home Page: https://www.r-spatial.org/r/2019/03/31/mapedit_leafpm.html
License: Other
Interactive editing of spatial data in R
Home Page: https://www.r-spatial.org/r/2019/03/31/mapedit_leafpm.html
License: Other


This is to continue the discussion from da29ff0#diff-2500a1ff7485db873721e70572309874R26.
In case people are digitising in non-wemercator CRS, should playback still show the playback in webmercator or replay in native CRS without a map background? I think it has merit to replay in native CRS but would appreciate thoughts from @mdsumner for example
geojson.io (not the R package geojsonio) provides a very nice interface with Leaflet and Leaflet.Draw.Drag to create, edit, and delete features. Sometimes I even surprise myself. Try this after a couple very minor changes to geojson.io.
library(shiny)
# turn on shiny.trace to see message
#   since I have not added the mechanism to retrieve the changes
#   as a gadget or something similar
options(shiny.trace=TRUE)
shiny::runGitHub("geojson.io","timelyportfolio","shiny")
I thought this would be an excellent inspiration for useful functionality, or with some additional work, provide another edit function that we might use. Be sure to try the Meta toolbar and also the Table function in the right sidebar next to JSON.
I haven't explored the implications of this enough, but I definitely see the need to have a lower level function than selectFeatures.sf to pass back an index from a select operation.
We could do selectFeatures(x)$column but that seems a bit round-about. I'll want to use this to classify data values in the data.frame, so you might do something like this:
x %>% mutate(selected = selectFeaturesIndex(x)) %>% filter(selected & property > value)
(I presume it probably doesn't actually make sense to include the out select logic in the pipe like this, it's probably too much to ask to get mutate(selected = selectFeatures(.)) to work this way. )
More straightforward would be
x$selected <- selectFeaturesIndex(x)
x %>% filter(selected & property > value)
selectFeaturesIndex would add layer of abstraction, return a logical vector and be used by selectFeatures, and other filter+other functions we could write.
Apologies for not actually having tried this out, but wanted to ask about it sooner rather than later.
It would be nice if users could control which feature they were editing by selecting a row from a DT table widget in the editMap editor.
Here's my use case: I have a tibble of non-spatial data that I want to convert into an sf object, adding geometries to each row. mapedit seems like the right package for the job! I can convert the tibble to sf by adding a sfc with empty geometries, but then there's no way to select them in the editMap editor. Having a table + map interface in the editor would allow a users to add new geometries to non-spatial data by going row by row, highlighting and drawing each shape/line/point one by one.
Additionally, I could see such an interface being useful for users who want to create MULTI* geometries (e.g., a MULTIPOLYGON containing > 1 polygons).
promoting #29 (comment) to a separate issue as hole editing and removal could be a very nice use case for mapedit
Based on the original issue comment, there seems to be a bug with hole editing that I have not been able to reproduce yet. Beyond the bug, hole editing and removal would be a nice feature. There was some discussion on hole editing at Leaflet/Leaflet.draw#90 and Leaflet/Leaflet.draw#146, but this appears to have died.
It may be a simple question, but I cannot make it work as I call edit module:
server <- function(input, output) {
ns <- shiny::NS("eview")
emapx <- callModule(editMod, "eview", leaflet(...))
...
}
The leaflet map correctly show, and leafletProxy(ns("map")) also works, including the popup when clicking marker.
But I cannot use input$map_bounds or input$map_marker_click to detect map bounds and to get triggered by marker click through the leaflet id "map". The original usage under only shiny+leaflet is ok. Do I misuse the id of leaflet (in edit module of mapedit) for input$'MAPID'_bounds (and _marker_click)? Is there any suggestion to do so? Thanks.
While introducing drawFeatures I noticed that the newly introduced mapview::addImageQuery (which is used by default in mapview for raster layers) breaks editMap.
library(mapedit)
library(mapview)
library(leaflet)

m_leaf_wo = leaflet() %>%
  addProviderTiles("OpenStreetMap") %>%
  addRasterImage(poppendorf[[4]], layerId = "rst")

m_leaf_w = leaflet() %>%
  addProviderTiles("OpenStreetMap") %>%
  addRasterImage(poppendorf[[4]], layerId = "rst") %>%
  addImageQuery(poppendorf[[4]], layerId = "rst")

m_mapv_wo = mapview(poppendorf[[4]], label = FALSE)

m_mapv_w = mapview(poppendorf[[4]])

editMap(m_leaf_wo) # works fine
editMap(m_leaf_w)  # doesn't work
editMap(m_mapv_wo) # works fine
editMap(m_mapv_w)  # doesn't work
Alone, all these maps work fine and the imageQuery is displayed as intended.
@timelyportfolio I see lots of shiny related js stuff when inspecting in the browser console so my hunch is that mapview::adImageQuery lacks shiny support somehow. Yet, my knowledge of both shiny and js is too limited to understand what's going on. The relevant js code for addImageQuery is found here. Would you mind having a look at what's happening here and how to potentially fix it?
I'm thinking a way to allow users to edit and add OSM elements could be a massive boost for open data and ease contributions to R users.
I suspect @mpadge would be a fan of this idea and could provide an indication of whether the osmdata package could help.
May be a bit of a pipe-dream though as OSM data has a rather unusual data schema - even if it were only supported for points/tag changes it could be useful though. Food for thought...
selectFeatures() by @tim-salabim is brilliant and helpful. editFeatures done properly could also be very nice, but will require a little more care to apply the edits, add, and deletes. I will try to describe my initial thoughts from quite a bit of experimentation.
editFeatures() should return a new sf with merged changes rather than attempting to mutate the original/source sf.
sf geometryeditFeatures() could add new a new non-primary geometry column for edits like a join might, add new property column to mark deletes, and add geometries by adding to the new edit column if done as stated in first item of the list with property column marker like deletes. However, I think it should simply merge the changes into the primary geometry column.
Changing the geometry column of an sf is not well-documented, and I tried a whole lot of different ways. @tim-salabim though showed me the nifty little trick of assignment (timelyportfolio/r-spatial.org@bf13e81#commitcomment-22430626) with st_geometry that seems to work as expected. I would like to test this thoroughly, and if it works as it seems then add some examples and better documentation to sf::st_geometry().
When I do
editFeatures(franconia[1:5, ]) %>%
  mapview()
and in that session both delete a feature and edit another one, I get the error:
Error in CPL_get_bbox(obj, 3) : Not a matrix.traceback:
22.
stop(structure(list(message = "Not a matrix.", call = CPL_get_bbox(obj,
    3), cppstack = NULL), .Names = c("message", "call", "cppstack"
), class = c("Rcpp::not_a_matrix", "C++Error", "error", "condition"
)))
21.
CPL_get_bbox(obj, 3)
20.
structure(CPL_get_bbox(obj, 3), names = c("xmin", "ymin", "xmax",
    "ymax"))
19.
bbox.MtrxSetSetSet(obj)
18.
structure(bb, class = "bbox", crs = st_crs(x))
17.
bb_wrap(bbox.MtrxSetSetSet(obj), obj)
16.
st_bbox.sfc_MULTIPOLYGON(x)
15.
st_bbox(x)
14.
`[.sfc`(geom, i)
13.
geom[i]
12.
`[.sf`(orig, which(!(orig_ids %in% del_ids)), ) at merge.R#72
11.
orig[which(!(orig_ids %in% del_ids)), ] at merge.R#72
10.
merge_delete(structure(list(NUTS_ID = c("DE241", "DE242", "DE243",
"DE244", "DE245"), SHAPE_AREA = c(0.00673601232111, 0.00842446859281,
0.00598234136934, 0.00732948035553, 0.146698316001), SHAPE_LEN = c(0.392622499474,
0.624726298357, 0.518547080489, 0.456981511253, 3.4819699025),  ...
9.
eval(call(paste0("merge_", op), left_sf, sf_merge, c(edit_id = "layerId")))
8.
eval(call(paste0("merge_", op), left_sf, sf_merge, c(edit_id = "layerId"))) at edit.R#199
7.
f(init, x[[i]])
6.
Reduce(function(left_sf, op) {
    op <- tolower(op)
    if (op == "add")
        sf_merge <- crud$finished ... at edit.R#172
5.
editFeatures.sf(franconia[1:5, ]) at edit.R#119
4.
editFeatures(franconia[1:5, ])
3.
eval(lhs, parent, parent)
2.
eval(lhs, parent, parent)
1.
editFeatures(franconia[1:5, ]) %>% mapview() @tim-salabim, promoting timelyportfolio@d476b4c#commitcomment-27624345 here so we can fully integrate crosstalk. I'd like to leave crosstalk in experiments until after 0.4.0, so that this will not hold up CRAN submission.
@timelyportfolio I have hacked a modification into this (see below) to enable selection only on ctrl + click using if(e.originalEvent.ctrlKey){...}. Hence, the map renders normally and popups can be queried as usual. When ctrl button is pressed then clicking will make the selection and popups are disabled. Would you mind having a look at this (I'm sure there's a smarter way of achieving this - my approach is copy&paste from SO). Also, what are your thoughts on having ctrl+click as the default behaviour for the click GUIs in mapedit (e.g. `selectFeatures(x, mode = "ctrlClick"))?
library(sf)
library(leaflet)
library(crosstalk)
library(htmltools)
library(mapview)

# boroughs<- st_read("X:/Appelhans Tim/boroughs.geojson")
# boroughs$x <- seq(1:5)
# boroughs$y <- seq(2,10,2)

franconia_sd <- SharedData$new(
  franconia,
  key=~NUTS_ID,
  # provide explicit group so we can easily refer to this later
  group = "franconia"
)

map <- leaflet(franconia_sd) %>%
  addProviderTiles(providers$CartoDB.Positron) %>%
  addPolygons(
    data=franconia_sd,
    layerId = ~NUTS_ID,
    color = "#444444",
    weight = 1,
    smoothFactor = 0.5,
    opacity = 1.0,
    fillOpacity = 0.5,
    fillColor = ~colorQuantile("Greens", SHAPE_AREA)(SHAPE_AREA),
    popup = mapview::popupTable(franconia)
    #  turn off highlight since it interferes with selection styling
    #   if careful with styling could have both highlight and select
    #    highlightOptions = highlightOptions(color = "white", weight = 2)
  )

# borrow from https://github.com/r-spatial/mapedit/blob/master/R/query.R#L73-L132
#   to select/deselect features but instead of Shiny.onInputChange
#   use crosstalk to manage state
add_select_script <- function(lf, styleFalse, styleTrue, ns="") {
  ## check for existing onRender jsHook?

  htmlwidgets::onRender(
    lf,
    sprintf(
      "
      function(el,x) {
      var lf = this;
      var style_obj = {
      'false': %s,
      'true': %s
      }
      var crosstalk_group = '%s';
      // instead of shiny input as our state manager
      //   use crosstalk
      if(typeof(crosstalk) !== 'undefined' && crosstalk_group) {
      var ct_sel = new crosstalk.SelectionHandle()
      ct_sel.setGroup(crosstalk_group)
      ct_sel.on('change', function(x){
      if(x.sender !== ct_sel) { //ignore select from this map
      lf.eachLayer(function(lyr){
      if(lyr.options && lyr.options.layerId) {
      var id = String(lyr.options.layerId)
      if(
      !x.value  ||
      (
      Array.isArray(x.value) &&
      x.value.filter(function(d) {
      return d == id
      }).length === 0
      )
      ) {
      toggle_state(lyr, false)
      toggle_style(lyr, style_obj.false)
      }
      if(
      Array.isArray(x.value) &&
      x.value.filter(function(d) {
      return d == id
      }).length > 0
      ) {
      toggle_state(lyr, true)
      toggle_style(lyr, style_obj.true)
      }
      }
      })
      }
      })
      }
      // define our functions for toggling
      function toggle_style(layer, style_obj) {
      layer.setStyle(style_obj);
      };
      function toggle_state(layer, selected, init) {
      if(typeof(selected) !== 'undefined') {
      layer._mapedit_selected = selected;
      } else {
      selected = !layer._mapedit_selected;
      layer._mapedit_selected = selected;
      }
      if(typeof(Shiny) !== 'undefined' && Shiny.onInputChange && !init) {
      Shiny.onInputChange(
      '%s-mapedit_selected',
      {
      'group': layer.options.group,
      'id': layer.options.layerId,
      'selected': selected
      }
      )
      }
      return selected;
      };
      // set up click handler on each layer with a group name
      lf.eachLayer(function(lyr){
      if(lyr.on && lyr.options && lyr.options.layerId) {
      // start with all unselected ?
      toggle_state(lyr, false, init=true);
      toggle_style(lyr, style_obj[lyr._mapedit_selected]);
      lyr.on('click',function(e){
      console.log(e.originalEvent.ctrlKey)
      if(e.originalEvent.ctrlKey){
      var selected = toggle_state(e.target);
      toggle_style(e.target, style_obj[String(selected)]);
      if(ct_sel) {
      var ct_values = ct_sel.value;
      var id = lyr.options.layerId;
      if(selected) {
      if(!ct_values) {
      ct_sel.set([id, String(id)]) // do both since Plotly uses String id
      }
      // use filter instead of indexOf to allow inexact equality
      if(
      Array.isArray(ct_values) &&
      ct_values.filter(function(d) {
      return d == id
      }).length === 0
      ) {
      ct_sel.set(ct_values.concat([id, String(id)]))  // do both since Plotly uses String id
      }
      }
      if(ct_values && !selected) {
      ct_values.length > 1 ?
      ct_sel.set(
      ct_values.filter(function(d) {
      return d != id
      })
      ) :
      ct_sel.set(null) // select all if nothing selected
      }
      var nodes = document.getElementByClass('popup-pane').getElementsByTagName('*');
      //var nodes = document.getElementsByClassName('leaflet-popup-pane')[0].getElementsByTagName('*');
      for(var i = 0; i < nodes.length; i++){
      nodes[i].disabled = true;
      }
      }
      }
      });
      }
      });
      }
      ",
      jsonlite::toJSON(styleFalse, auto_unbox=TRUE),
      jsonlite::toJSON(styleTrue, auto_unbox=TRUE),
      if(inherits(getMapData(map), "SharedData")) {getMapData(map)$groupName()} else {""},
      ns
    )
  )
  }


# try it with DT datatable
library(DT)

# no reason to carry the load of the feature column
#   in the datatables
#   so we will modify the data to subtract the feature column
#   not necessary to use dplyr but select makes our life easy
#   also need to modify targets, colnames, and container
dt <- datatable(franconia_sd, width="100%")
dt$x$data <- dplyr::select(dt$x$data, -geometry)
dt$x$options$columnDefs[[1]]$targets <- seq_len(ncol(franconia)-1)
attr(dt$x, "colnames") <- attr(dt$x, "colnames")[which(attr(dt$x, "colnames") != "geometry")]
dt$x$container <- gsub(x=dt$x$container, pattern="<th>geometry</th>\n", replacement="")
dt


browsable(
  tagList(
    tags$div(
      style = "float:left; width: 49%;",
      add_select_script(
        map,
        styleFalse = list(fillOpacity = 0.2, weight = 1, opacity = 0.4, color="black"),
        styleTrue = list(fillOpacity = 0.7, weight = 3, opacity = 0.7, color="blue"),
        ns = ""
      )
    ),
    tags$div(
      style = "float:left; width: 49%;",
      dt
    )
  )
)The following came up on R-sig-Geo today. I have mirgrated to here as I don't know if @timelyportfolio is on that mailing list:
Hi I am putting together a shiny map app in which I want to allow for
selection or deselection of polygons from a map layer.
Importantly At the beginning of the process I would like a subset of the
polygons to be already selected ( and they can then be deselected using a
click if required).
The final set of selected polygons is then saved to disk.
Ideally I would like to be able ( eg using a shiny action button) to reset
the selection to the pre-selected polygons.
I have the basic click select working fine, but cannot work out how to
pre-select some polygons so that they are dis as selected ( and can be
deselected with a click) at the start of the process.
Secondly is there a way to reset the selection to the pre-selected set.
The pre-selected polygon ids will change depending on another interactive.
toy example of code is below with comments about the two issues that I
cannot figure out:
library(shiny)
library(mapedit)
library(leaflet)
outputDir<-getwd()
saveData <- function(data,fileName) {
  # Write the file to the local system
  write.csv(
    x = data,
    file = file.path(outputDir, fileName),
    row.names = FALSE, quote = TRUE
  )
}


# An example se of preslected values for the polygon layer
# in the real app this will change based on other selections in the UI
preselected1<-gadmCHE$NAME_1[1:3]
preselected2<-gadmCHE$NAME_1[5:8]


ui <- fluidPage(
  radioButtons(inputId = "presel",label = "Preselection",choiceNames =
c("preselected1","preselected2"),choices =
c("preselected1","preselected2")),
  actionButton("startSel", "Show Polygons"),
  actionButton("endSel", "Do not Save"),
  actionButton("saveSel","Save Revised Selection"),
  actionButton("resetSel","Reset Selection\n does not work at the moment"),
  selectModUI("selector")

)

server <- function(input, output) {

  ns <<- NS("selector")

  base_map <- leaflet() %>%
  addTiles()%>%
  addPolygons(data =gadmCHE,
              label = ~NAME_1,
              layerId = ~NAME_1,
              group="Polygons")
  #####
  #####
  ####HOW can I feed in the preslected ids to the process so they
  ####are displayed when the polygons group is shown ?
  Selects<<-callModule(selectMod,
                    "selector",
                    base_map,
                    styleFalse = list(fillOpacity =0,
                                      weight = 1,
                                      opacity = 1),
                    styleTrue = list(fillOpacity = 1,
                                     weight= 1,
                                     opacity = 0))
  leafletProxy(ns("map"))%>%
    hideGroup("Polygons")

  observe({selOuts<-Selects()
  selOuts<<-selOuts
  selOut<<-t(selOuts[selOuts$selected==TRUE,"id"])})


  observeEvent(input$startSel,{
*    #####*
*    ####HOW can I feed in the preslected ids to the process so they*
*    ####are displayed when the polygons group is shown ?*
    leafletProxy(ns("map"))%>%
      showGroup("Polygons")})

   observeEvent(input$resetSel,{
    * ####*
*     ####*
*     ####How can I reset the polygons to the preselected set?*
    leafletProxy(ns("map"))%>%
      showGroup("Polygons")})

  observeEvent(input$endSel,{
    leafletProxy(ns("map"))%>%
      hideGroup("Polygons")})

  observeEvent(input$saveSel,{
    outname<-"Revision.csv"
    saveData(selOut,outname)
    rm(outname)
  })

}

shinyApp(ui = ui, server = server)Consider the following scenario:
library(mapview)
library(sf)
pol = st_cast(franconia[2, ], "POLYGON")[2, ]
cntrd = st_centroid(pol)
mapview(pol) + cntrd
The centroid lies outside the polygon which is correct in mathematical terms (at least in the current implementation of sf::st_centroid but there are cases where the user would like this point to lie inside the polygon. Obviously, mapedit could provide a nice way for a quick-fix here by enabling the user to freely drag the point to a location inside the polygon. Even though the manually adjusted position may not exactly be the centroid, it may well be a better approximation of it than a point lying outside the polygon.
To achive this, of course, the user would need to be able to use editFeatures with a user defined background map including the polygon. Hence, I think we need to change the logic of editFeatures away from argument platform towards argument map = NULL so that if NULL, we use set up a map using mapview(x) and else we use the supplied map.
I think we should follow this strategy also for selectFeatures as also then there may be scenarios where the user needs some sort of background reference features other than a map or satellite view (e.g. a raster image) to aid feature selection.
@timelyportfolio thoughts?
Leaflet.pm offers draw/edit functionality similar to Leaflet.draw already provided in leaflet.extras. mapedit has relied upon Leaflet.draw + leaflet.extras up until now, but we miss out on snapping and cutting. I tested Leaflet.Snap with Leaflet.draw but quickly ran into a couple of bugs, so I did not feel comfortable adding the combination to leaflet.extras or mapedit.
After consulting with @tim-salabim, we decided that snapping and cutting were important enough to attempt a new leaflet editor package with Leaflet.pm. Work has begun, and we have a minimally working version at leafpm.
In addition, we have added an editor argument to the edit* suite of function in mapedit to further test the proof of concept. This is in branch leafpm with a quick example.
If anyone out there is inspired or motivated to try it, please let us know your experience. Thanks so much!
A simple list of existing R workflows where we think that mapedit could be useful
getTile.How should we handle CRS in combine_list_of_sf() (see lines)? Originally, I specifically chose 4326 since I wrote combine_list_of_sf to deal with GeoJSON from Leaflet.Draw events in edit*(). However, I am not sure I am comfortable with this approach for a couple of reasons.
rbind for sf, combine_list_of_sf() could be helpful elsewhere. If used elsewhere, combine_list_of_sf cannot be so crude with crs.I wanted to think through some options for dealing with this and discuss them in this issue. I have confirmed that even if edits made on a project leaflet map the edits are converted back to 4326,
crs argument - seems like we should do this no matter what even if we decide to continue to default to 4326crs from the list of features if all have the same crscrs and let user decide what to do with the returned sf - I could see some merit in this also and this seems most consistent with sf.promoted from #48
Before I implement the logic into mapedit, I wanted to post the results from my initial exploration.
library(mapview)
library(mapedit)
library(sf)

# @tim-salabim reports, this fails badly
#   and while leaflet draws the multilinestring correctly
#   Leaflet.draw seems to not like it
editFeature(trails[4,])

# we will need to cast to LINESTRING first
#  but be careful to retain some mechanism
#  to preserve the group for proper conversion back
#  to MULTILINESTRING
editFeatures(sf::st_cast(trails[4,], "LINESTRING"))


# one option will be to add a second column identifier
#  after we cast to LINESTRING
#  here is a minimal example before attempting to integrate
#  into the existing module
tr <- trails[c(1,4),]
tr$edit_id <- seq_len(nrow(tr))
# now will need to carefully cast
#  for some reason casting creates sfc
#  so also need to st_sf to get back to sf
tr2 <- st_sf(st_cast(tr, "LINESTRING"))
tr2


# ignore the editMap part for now
#  and see if we can convert back
#  I might be making this way harder than it should be
#  but I could not find a combination of aggregate.sf
#  or dplyr::group_by that would accomplish this
tr3 <- tr
st_geometry(tr3) <- split(tr2, tr2$edit_id) %>%
  lapply(function(x){st_multilinestring(st_geometry(x))}) %>%
  st_sfc
plot(tr3)
tr3
@edzer, is there a way to group_by and then make st_multilinestring on each grouped edit_id? I also tried to do this with aggregate.sf with no luck since it seems the aggregate function could only apply to non-geometry columns.
editFeatures(breweries[1, ]) will zoom in to a zoom level of 100 in the initial view. This is, I assume, because zoom level 100 is the maxZoom defined in mapview (to enable scrolling past the default zoom of 18/19 to investigate whether a line may actually be a polygon - useful for sliver polygons). I think we need to use leaflet's default expandLimits (or similar) to initiate the view.
How should we handle recording of what has been done to a set of features or a map? editMap currently returns a list with entries drawn , edited, deleted and finished, some of which will be NULL depending on what has been done. In order to ensure reproducibility, I think that all higer level functions (such as a potential editFeatures) should ensure that any changes are recorded somehow. I am just not quite sure how to implement this.
record argument?Any thoughts more than welcome!
The current editMod returns a list of drawn, edited, deleted, and finished sf collections. I'm guessing that a common use case will be for people wanting to make manual edits to an existing sf collection.
A simplified editMod might take an existing map, callModule(editMod, "editor", mapview(existing_sf)@map), and return an sf that is existing_sf:
I have an issue using {mapedit} with the github dev version of {sf}.
I use that:
library(mapview)
library(mapedit)

what_we_created <- mapview() %>%
  editMap()
But when I clicked on "Done", I have the following error:
no method 'st_read' for object of classe "json"
The console also shows the following steps:
Listening on http://127.0.0.1:4217
Warning: Error in UseMethod: pas de méthode pour 'st_read' applicable pour un objet de classe "json"
Stack trace (innermost first):
    91: st_read
    90: as.data.frame
    89: tibble::as_tibble
    88: st_as_sf
    87: sf::read_sf
    86: st_as_sfc.geo_list
    85: FUN
    84: lapply
    83: combine_list_of_sf
    82: FUN
    81: lapply
    80: <reactive>
    69: crud
    68: observerFunc
    13: shiny::runApp
    12: shiny::runGadget
    11: editMap.leaflet
    10: editMap.mapview
     9: editMap
     8: function_list[[k]]
     7: withVisible
     6: freduce
     5: _fseq
     4: eval
     3: eval
     2: withVisible
     1: %>%
This works correctly with the CRAN version of library {sf}, so it seems that something has changed in the {sf} objects format, which has not been taken into account in {mapedit}. This does not work with dev version of {mapedit} too.
editFeatures with a personal shapefile read with sf does not work.
Using the latest CRAN versions denoted in reprex below.
Turns up on Win 10, 64 bit, R version 3.4.2 (2017-09-28).
library(mapview) # 2.2.0
library(mapedit) # 0.3.2

download.file("https://github.com/brry/course/raw/master/data/PrecBrandenburg.zip",
              destfile="prec.zip")
unzip("prec.zip")
p <- sf::st_read("PrecBrandenburg/niederschlag.shp")

ed <- editFeatures(franconia) # works fine
ed <- editFeatures(p) # Error in x$edit_id : $ operator is invalid for atomic vectors

berryFunctions::tryStack( editFeatures(p) )
# sys.calls: berryFunctions::tryStack -> editFeatures -> editFeatures.sf ->
# mapview::addFeatures -> addPolygonFeatures -> garnishMap -> do.call - fn_lst[[i]]
# ->  -> invokeMethod -> eval -> eval -> invokeMethod -> evalFormula -> evalAll
# -> lapply -> FUN -> resolveFormula -> eval -> eval -> x$edit_id
(Don't try traceback(). With the do.call stuff, it will print entire objects. tryStackfilters that out.)
This is a promotion of the discussion in #19 with particular reference to comments.
@fdetsch proposed the idea of providing a selectMap wrapper for sf and @tim-salabim responded with selectFeatures. This seemed to work well until the selectFeatures was integrated into the MODIS package fdetsch/MODIS@353c2f4. selectFeatures then erratically returned the selection, and I have replicated on my machine.
mapedit allows one to manually create simple features. Because the process is a manual one, it is difficult to reproduce. Thus, if an object is accidentally overwritten or deleted, the previous manual work is lost. A solution to avoid this is to have mapedit functions to first check whether an object is being overwritten and warn the user about it before proceeding. I think that this could be a useful addition to the package. However, I do not know how this could be done.
I just find that if you add too many shapes (more than three usually) in Editmods and delete then it will occur a bug shows "argument is of length zero".
I find this when using the code in your case: "Edit as Shiny Module"
https://www.r-spatial.org/r/2017/06/09/mapedit_0-2-0.html
As per title: the title parameter is supported by editFeatures, but not by selectFeatures, which seems a small inconsistency.
Using e.g. editFeatures(mapview::franconia[1, ]) then activating "edit layers" and finally hitting "save" without doing any editing crashes the shiny session. Error:
Warning: Error in vapply: values must be length 3,
 but FUN(X[[1]]) result is length 1
Stack trace (innermost first):
    80: vapply
    79: unique
    78: sf::st_sfc
    77: sf::st_sf
    76: combine_list_of_sf [/home/ede/software/rpkgdev/mapedit/R/edit_map_return_sf.R#88]
    75: FUN [/home/ede/software/rpkgdev/mapedit/R/modules.R#228]
    74: lapply
    73: <reactive> [/home/ede/software/rpkgdev/mapedit/R/modules.R#218]
    62: crud
    61: observerFunc [/home/ede/software/rpkgdev/mapedit/R/edit.R#60]
     6: shiny::runApp
     5: shiny::runGadget
     4: editMap.leaflet [/home/ede/software/rpkgdev/mapedit/R/edit.R#71]
     3: editMap [/home/ede/software/rpkgdev/mapedit/R/edit.R#17]
     2: editFeatures.sf [/home/ede/software/rpkgdev/mapedit/R/edit.R#162]
     1: editFeatures [/home/ede/software/rpkgdev/mapedit/R/edit.R#119]
Pressing "cancel" does not crash the session and I guess would be the more logical choice, yet it would be nice if we could prevent the session from crashing when hitting "save".
@timelyportfolio I really like the idea of the flubberized playback. In a scenario where person A does:
library(mapedit)
library(mapview)
edited = editFeatures(franconia[1, ]) # do some editing
save(edited, file = "edited.rda")
and then sends edited.rda to person B, person B could then ideally simply use:
load("edited.rda")
playback(edited)
to get a quick impression of what has been done by person A.
Also, I think this would be a great show-off for the conference talk :-)
Thanks for an awesome package.
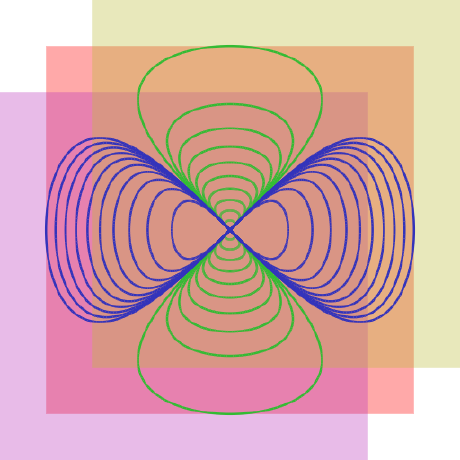
I've used it for work and all went well until I looked at the object that I created.
I definitely saved a polygon representing the roof space of this site plan but plot(r_new2$finished$geometry) came out like this (it should be a nice curve following the roof which was what I drew):
Any ideas why? Have others reported this - can retry if I discover what I'm doing wrong (I did some re-editing).
Here's some partitially reproducible code, which geo-referenced the raster - that was very useful!
Hello,
I am self-taught in R and computer coding, so I apologize if this question is poorly worded or already answered elsewhere.
I am trying to plot a reactive dataset in editMod, while retaining the ability to use the edit (draw) functions provided by editMod. So far I have not found a way to plot reactive data using editMod.
I want a map that allows me to:
Plot spatial data that can be subsetted by some kind of reactive variable (below it is the "mag" variable)
Draw across a certain group of points and generate summary data based on the reactive subset of the plotted data.
Below is a reproducible example using the supplementary "quakes" dataset. In the below map, I can generate summary data based on a reactive dataset selected by the slider bar, but the reactive dataset is not reflected in what is plotted on the map.
library(mapview)
library(leaflet)
library(shiny)
library(ggplot2)
library(mapedit)
library(leaflet.extras)
library(sf)

ui.q <- fluidPage(

  # Application title
  titlePanel("Quake data exploration"),

  sidebarLayout(
    sidebarPanel(
      sliderInput("range",
                  label = "Range of earthquake magnitude:",
                  min = 4.0, max = 6.4, value = c(4.0, 6.4), step = 0.1)
    ),

    mainPanel(
      fluidRow(

         editModUI("editor", height = 860),

         absolutePanel(id = "controls", class = "panel panel-default", fixed = TRUE,
                                           draggable = TRUE, top = 120, left = "auto", right = 20, bottom = "auto",
                                           width = 400, height = "auto",

                                           h4("Summary data"),

                                           plotOutput("plot")))
        )
      )
    )

# Define server logic
server.q <- function(input, output){

  #create a sf of the quake data.
  quake_mx <- data.matrix(quakes[,2:1])
  quake_mp <- st_multipoint(quake_mx)
  quake_sf <- st_sf(st_cast(st_sfc(quake_mp), "POINT"), quakes, crs=4326)


  #trying to subset the quake_sf data by the range of magnitude inputted by the slider bar.
  #this creates a reactive dataframe and I can't seem to get it to be reflected in the editMod output.
  #I can get this to work when I use leafletProxy but then we lose the ability to draw.

  datasetMag <- reactive({
    quake_sf = subset(quake_sf, mag %in% c(input$range[1]:input$range[2]))
    })

#generate the leaflet map
  lf.quakes <- leaflet(options = leafletOptions(minZoom = 4, maxZoom = 10)) %>%
    addTiles() %>%
    addProviderTiles("Esri.OceanBasemap",group="OceanBasemap") %>%
    addProviderTiles("Esri.WorldImagery",group="WorldImagery") %>%

    addCircleMarkers(data = quake_sf,
                     color = "red",
                     weight = 1,
                     fillOpacity = 0.7,
                     popup = popupTable(quake_sf, zcol = "mag"),
                     radius = quake_sf$mag) %>%

    addLayersControl(baseGroups = c("OceanBasemap","WorldImagery"),
                                  options = layersControlOptions(collapsed = FALSE))


  #call the editMod function from 'mapedit' to use in the leaflet map. I think this may be the line where I am going wrong

  edits <- callModule(editMod, "editor", leafmap = lf.quakes)


  #generate the reactive dataset based on what is drawn on the leaflet map
  datasetInput <- reactive({
    mag.range = c(input$range[1]:input$range[2])
    req(edits()$finished)
    quake_intersect <- st_intersection(edits()$finished, quake_sf)
    df <- data.frame(quake_intersect)
    df = df[df$mag %in% mag.range,] #make the dataset reactive to the slider input range
  })

  #render a histogram with the reactive dataset as the output

  output$plot <- renderPlot({
    hist(datasetInput()$mag, col = "grey", border = "black")
  })
}

shinyApp(ui.q, server.q)
I think it would be handy if users could add labels (based on some column) to selectFeatures to aid the selection. I will try and implement this in the next few days, as I guess this does not involve any JS as such.
As a side note, this came to my mind when viewing the recording of the mapedit talk where I realised that I should have provided an example of selecting my favorite brewery from the breweries data set in mapview (that way I could have easily stirred up the crowd by emphasizing that Franconian beer is much better than Belgian beer ;-) ). Why do these things always occur to me afterwards...
As suggested by @tim-salabim on Twitter, generalize the editMap function to use more than just Leaflet.Draw.
edit(<object>, editFunction())
#As in
mapedit::editMap(leaflet_map, leafletDraw())?As far as I can tell, the current Shiny modules don't allow any interaction with the map beyond the editing. You essentially hard code what's displayed on the map and there doesn't seem to be a way to modify the map interactively as with a normal leaflet map via leafletProxy(). In addition, I want to be able to add and remove the editing toolbar. As it stands, I need two map interfaces, one to collect the data (using editModUI) and another to do something with it (using leafletOutput).
Here's an example of what I want to. The only difference is I want to save the edits in a reactive object.
library(shiny)
library(sf)
library(leaflet)
library(leaflet.extras)

ui <- fluidPage(
  actionButton("start", "Start Editing"),
  actionButton("end", "End Editing"),
  selectInput("dropdown", "Draw Points?", choices = c(Yes = "yes", No = "no")),
  leafletOutput("map")
)
server <- function(input, output, session) {
  output$map <- renderLeaflet({
    leaflet() %>%
      addTiles() %>%
      setView(-90, 42, zoom = 10)
  })
  observeEvent(input$start, {
    leafletProxy("map") %>%
      addDrawToolbar()
  })
  observeEvent(input$end, {
    leafletProxy("map") %>%
      removeDrawToolbar()
  })
  observe({
    if (input$dropdown == "yes") {
      pts <- data.frame(lng = rnorm(100, -90), lat = rnorm(100, 42)) %>%
        st_as_sf(coords = c("lng", "lat"))
      leafletProxy("map") %>%
        addCircleMarkers(data = pts, group = "points")
    } else {
      leafletProxy("map") %>%
        leaflet::clearGroup("points")
    }
  })
}
shinyApp(ui, server)
Thanks for making this project. I would like to use if for some GIS projects I have but I'm having trouble converting the object made by editMap to something I could use writeOGR with.
It might be elementary to you but it would be helpful for myself. Thanks!
I want to share this while it's fresh, it's not something I tend to think I need:
Straight mapview(any-thing or just tiles) and digitizing points for use later is a pretty simple but open opportunity I think. I just opened up Manifold for 5 minutes with a colleague to collect several dozen points from an old krill figure as longlats - and they were amazed - I forget many people just don't have the facilities to do that. I could have use mapedit but
It might be worth presenting a simple-as-possible example of doing just that. It's totally needs-driven and exactly fit for purpose on the day it's needed, though usually a feature we tend to look past to more complex things.
In this case I'd probably wrap the whole set up into one function, like "pdigitize()" that simple returned a data frame of longitude latitude. The UI would need just a "add multi point" button, enabled by default.
Also realted, I sometimes do a lot of rough affine-based georeferencing of maps sometimes, and I always use Manifold or my own locator-driven DIY method in R/raster, and rarely something crafted with VRT and GDAL. I'll try work out an example for mapedit, it requires side-by-side maps one in plain view and one in the native projection .
@tim-salabim brings up a good point that leaflet and mapview are camelCase. sf though is snake_case. Since leaflet and mapview are closest, I think that we should switch to camelCase. We are early enough in development that we can and should decide definitively at this point to prevent pain of a major API change. Thoughts?
Hi,
I am calling selectFeatures from the button of a GUI-based application, using viewer = browserViewer(browser = getOption("browser")) to allow selection from a browser.
All works well, and when I click "DONE" the selected features are passed back to the caller.
The only problem is that after I click DONE the browser window is greyed out but not closed, so that it appears that the "application" crashed.
You can replicate the problem using:
nc <- st_read(system.file("shape/nc.shp",package="sf"))
mapedit::selectFeatures(nc, viewer = browserViewer(browser = getOption("browser"))
Is there any way to automatically close the window (i.e., the browser tab) when the selection is completed?
Thanks in advance!
PS: I am working with the current CRAN version of mapedit (0.3.2) becausethis functionality should be implemented in a CRAN package, so using the github version is not a feasible option
I think for reproducibility, similar to the recorder attribute in editFeatures, it would be good to not only return the selected features, but also the features/locations used (drawn/clicked) for the selection. For mode = "draw" this is straight forward, but for mode = "click" this may require some effort @timelyportfolio?
Filing #24 (comment) as a separate issue to track progress.
Ideal behavior for both edit* and select* functions would be to fill the height of the viewer window. This is complicated by the fact that leaflet does not work with height='auto' or height='100%'.
In the first release, we chose to return the values from edit and select to the R console. However, for greater impact, providing a Shiny module will allow users to easily add edit and select within a larger Shiny app. I'd like to add functions for the modules and then change edit and select to use the modules. To prevent confusion, edit and select should probably still be used to return values to R.
Dear mapedit users,
I am trying to make procedure in which I am loading raster maps and then get them to browser (Chrome) and interact with them (making polygons for further masking) using mapedit. I am running this in a batch using the for loop. However, I found that when loading within loop, mapedit is able to open correctly only every second map.
The core of this approach can be simplified in the following loop:
library(mapedit)
library(leaflet)

for(i in 1:10) {
New_Map<-leaflet()  %>%
  editMap(title=i)
flush.console()
}
You can see that you are not able to interact with maps 2,4,6,8 and 10.
If I am running that manually for each "i" without the for loop, then it works well.
I am using R version 3.5.1. I run the code directly in the Rgui which leads that the mapedit is opened in web browser. I tried it also with R-studio where the same behavior was encountered.
If I add a delay within the loop by e.g. Sys.sleep(5) then you can see that there is attempt to open maps 2,4,6,8 and 10 but it results in the following Chrome message "This site can’t be reached 127.0.0.1 refused to connect."
I would be thankful for any suggestion.
Milan
My first enhancement request is for drawing/edit snap-mode, so that we can align segment-based shapes to existing vertices. Snap is illustrated here:
http://makinacorpus.github.io/Leaflet.Snap/
Because we can upload point layers already this will also allow a way to draw exacting shapes if we want that for demonstrations, and more importantly to create simple features layers that are topologically sound as a network.
I'm really interested to explore the igraph connection:
https://gist.github.com/timelyportfolio/94c44959cf73e96a12ee2e194aaaaf2a
and this will be useful for leveraging TopoJSON as well.
I might be missing something obvious, but if mapedit can support playback, is should be possible to have undo and redo on individual edits. For example, if I press ctrl+z (or click some dedicated undo button) the latest point added to a polygon is removed, and redo adds it back. Currently, as far as I can tell, the cancel button undos all the changes to a feature as a unit and not individual changes.
Hi and thanks a lot for the awesome job here (and elsewhere).
I have no idea where to ask this question but I try here. Apologies if I should ask to leaflet for R or elsewhere.
I have struggling hard and for long to develop a digitizing software for morphometrics. Long story short: it would be widely used and mapview/edit are more than starters.
One blocking aspect for this now is to properly display images using pixels coordinates. So far, I manage to display any image using raster with xmx= 1 (and the ratio for ymx) but that's far from being clean (ie we need to retransform into pixels, scales are wrong, etc.).
I would pretty much need what's described in the leafletjs doc for non-geographical maps. On the leaflet() side, L.CRS.Simple seems to be the way to go, but, for such raster, we still need a projection. I have tried for a week and I nearly #made no progress. So, dear gurus, any idea how can we circumvent this problem and project an image (as a raster) in pixels coordinates and on a cartesian plan? A reproducible and minimal bit of code below if this may help.
Thanks a lot for your time and skills
# dependencies
library(jpeg)
library(raster)
library(leaflet)
library(leaflet.extras)
library(mapview)
library(mapedit)

# dl an image
path <- "https://upload.wikimedia.org/wikipedia/commons/thumb/5/58/CheHigh.jpg/280px-CheHigh.jpg"
che <- tempfile()
download.file(path, che, mode="wb")
im <- jpeg::readJPEG(che)

# prepare a raster from it
r  <- raster(xmn=0, xmx=1,
             ymn=0, ymx=nrow(im)/ncol(im),
             ncols=ncol(im), nrows=nrow(im))
r <- setValues(r, as.numeric(t(im)))

# prepare the leaflet
lf <- leaflet() %>% addTiles() %>% addRasterImage(r)
# view it
editMap(lf)
Referring to #19 (comment) @fdetsch has renewed this request with me in a conversation we had the other day.
I think this would be very nice to have to select multiple features in one-fell-swoop. The question that arises is whether this is best implemented via crosstalk or if we can just as easily implement it via sf functionality (i.e. draw polygon/rectangle and use st_intersects to identify the features to be selected).
@timelyportfolio I would love to hear your thoughts on this one.
Where does one obtain leaflet.extras? it does not seem to be available from CRAN:
> "leaflet.extras" %in% rownames(available.packages())
[1] FALSE
Using the latest version from gitHub, I seem to be unable to use editMap and editFeatures in this package: a mostly empty window is displayed. I am running from the R command line, but the same holds true from Rstudio.
Basic example:
library(mapview)
library(mapedit)
lf = mapview()
editMap(lf)
Only shows the following:

> sessionInfo()
R version 3.4.4 (2018-03-15)
Platform: x86_64-pc-linux-gnu (64-bit)
Running under: Linux Mint 18

Matrix products: default
BLAS: /usr/lib/libblas/libblas.so.3.6.0
LAPACK: /usr/lib/lapack/liblapack.so.3.6.0

locale:
[1] C

attached base packages:
[1] stats     graphics  grDevices utils     datasets  methods   base

other attached packages:
[1] shiny_1.0.5    mapedit_0.4.1  mapview_2.4.0  pacman_0.4.6   colorout_1.1-2

loaded via a namespace (and not attached):
 [1] Rcpp_0.12.16            compiler_3.4.4          plyr_1.8.4              tools_3.4.4
 [5] R.methodsS3_1.7.1       R.utils_2.6.0           base64enc_0.1-3         iterators_1.0.9
 [9] class_7.3-14            gdalUtils_2.0.1.14      digest_0.6.15           jsonlite_1.5
[13] viridisLite_0.3.0       satellite_1.0.1         lattice_0.20-35         png_0.1-7
[17] foreach_1.4.4           DBI_1.0.0               crosstalk_1.0.0         yaml_2.1.18
[21] RPostgreSQL_0.6-2       rgdal_1.2-18            spData_0.2.8.3          e1071_1.6-8
[25] raster_2.6-7            htmlwidgets_1.2         webshot_0.5.0           stats4_3.4.4
[29] classInt_0.2-3          leaflet_2.0.0           grid_3.4.4              sf_0.6-3
[33] R6_2.2.2                sp_1.2-7                udunits2_0.13           magrittr_1.5
[37] leaflet.extras_0.2.9002 units_0.5-1             scales_0.5.0.9000       codetools_0.2-15
[41] htmltools_0.3.6         mime_0.5                xtable_1.8-2            colorspace_1.3-2
[45] httpuv_1.3.5            miniUI_0.1.1            munsell_0.4.3           R.oo_1.21.0
Hi guys,
see the following mapview object: https://www.dropbox.com/s/l0owf7cul38o7x7/test-map.rda?dl=0
When saving edits of a layer and checking the result, the CRS is always 4326 (as far as I saw thats the intended behaviour):
editMap(map1, targetLayerId = "laukiz1", record = TRUE) -> map2
mapview(map2$finished)

Simple feature collection with 1 feature and 2 fields
geometry type:  POLYGON
dimension:      XY
bbox:           xmin: 505685.5 ymin: 4799974 xmax: 505768.5 ymax: 4800021
epsg (SRID):    4326
proj4string:    +proj=longlat +datum=WGS84 +no_defs
  X_leaflet_id feature_type                       geometry
1          670      polygon POLYGON ((505685.5 4799999,...
The problem in my case is that the bbox is stored in UTM coordinates (because map1 is in UTM) and the proj4 string is in lat/long. This screws up the spatial object.
I figured out that I need to call st_set_crs with the matching crs of map1 to get a valid sf object again.
map2$finished %>%
st_set_crs(32630) -> new_objectst_transform, which should be normaly used here, does not work because of the UTM<->long/lat problem just mentioned. st_set_crs gives the usual warning message which can be ignored here. This post-processing is really confusing and might cause a lot of problems for unexperienced users.
Is there a way to specify the output CRS of a resulting editMap() object within the function call?
Wouldn't it be best to use the CRS of the layer that has been edited?
Thanks for your time and keep rocking 👍
See https://stackoverflow.com/questions/51580551/convert-xy-to-lat-long-in-r
We should probably add a check whether drawing happened / is happening within acceptable longlat bounds (-180/180 & -90/90)
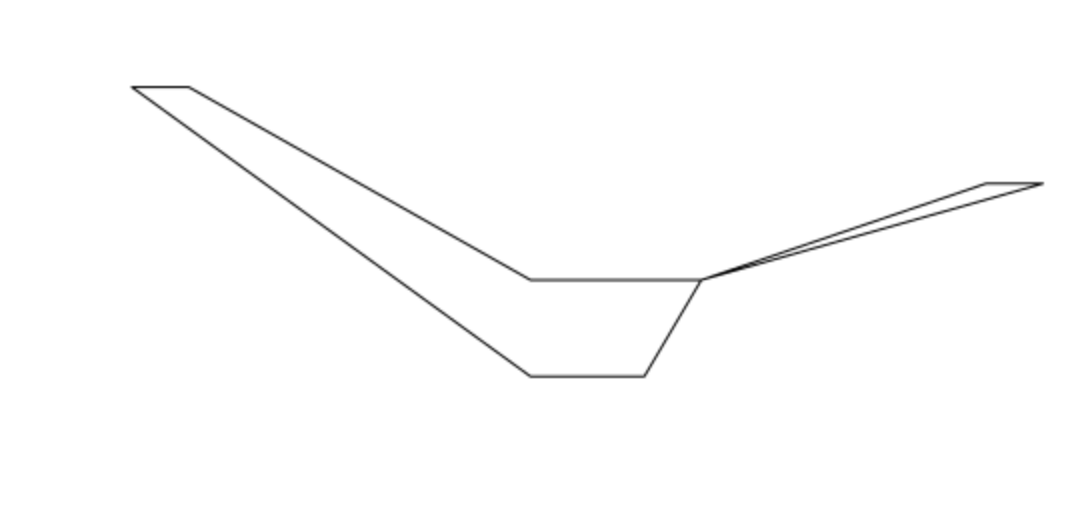
This became a clear need when I digitized the nodes in this image:
https://gist.github.com/mdsumner/449148a78ccea02b19ab1a21bfc5acb3
I really need a point that's not a big icon. I ended up digitizing it "top - down" so that each point didn't obscure points to come. :)
(I also forgot to assign the result, so this was a happy and rare use of .Last.value for me!).
A declarative, efficient, and flexible JavaScript library for building user interfaces.
🖖 Vue.js is a progressive, incrementally-adoptable JavaScript framework for building UI on the web.
TypeScript is a superset of JavaScript that compiles to clean JavaScript output.
An Open Source Machine Learning Framework for Everyone
The Web framework for perfectionists with deadlines.
A PHP framework for web artisans
Bring data to life with SVG, Canvas and HTML. 📊📈🎉
JavaScript (JS) is a lightweight interpreted programming language with first-class functions.
Some thing interesting about web. New door for the world.
A server is a program made to process requests and deliver data to clients.
Machine learning is a way of modeling and interpreting data that allows a piece of software to respond intelligently.
Some thing interesting about visualization, use data art
Some thing interesting about game, make everyone happy.
We are working to build community through open source technology. NB: members must have two-factor auth.
Open source projects and samples from Microsoft.
Google ❤️ Open Source for everyone.
Alibaba Open Source for everyone
Data-Driven Documents codes.
China tencent open source team.